
- Contact Us:
-

-

-

-


Daily Market Updates
23 Oct 2023
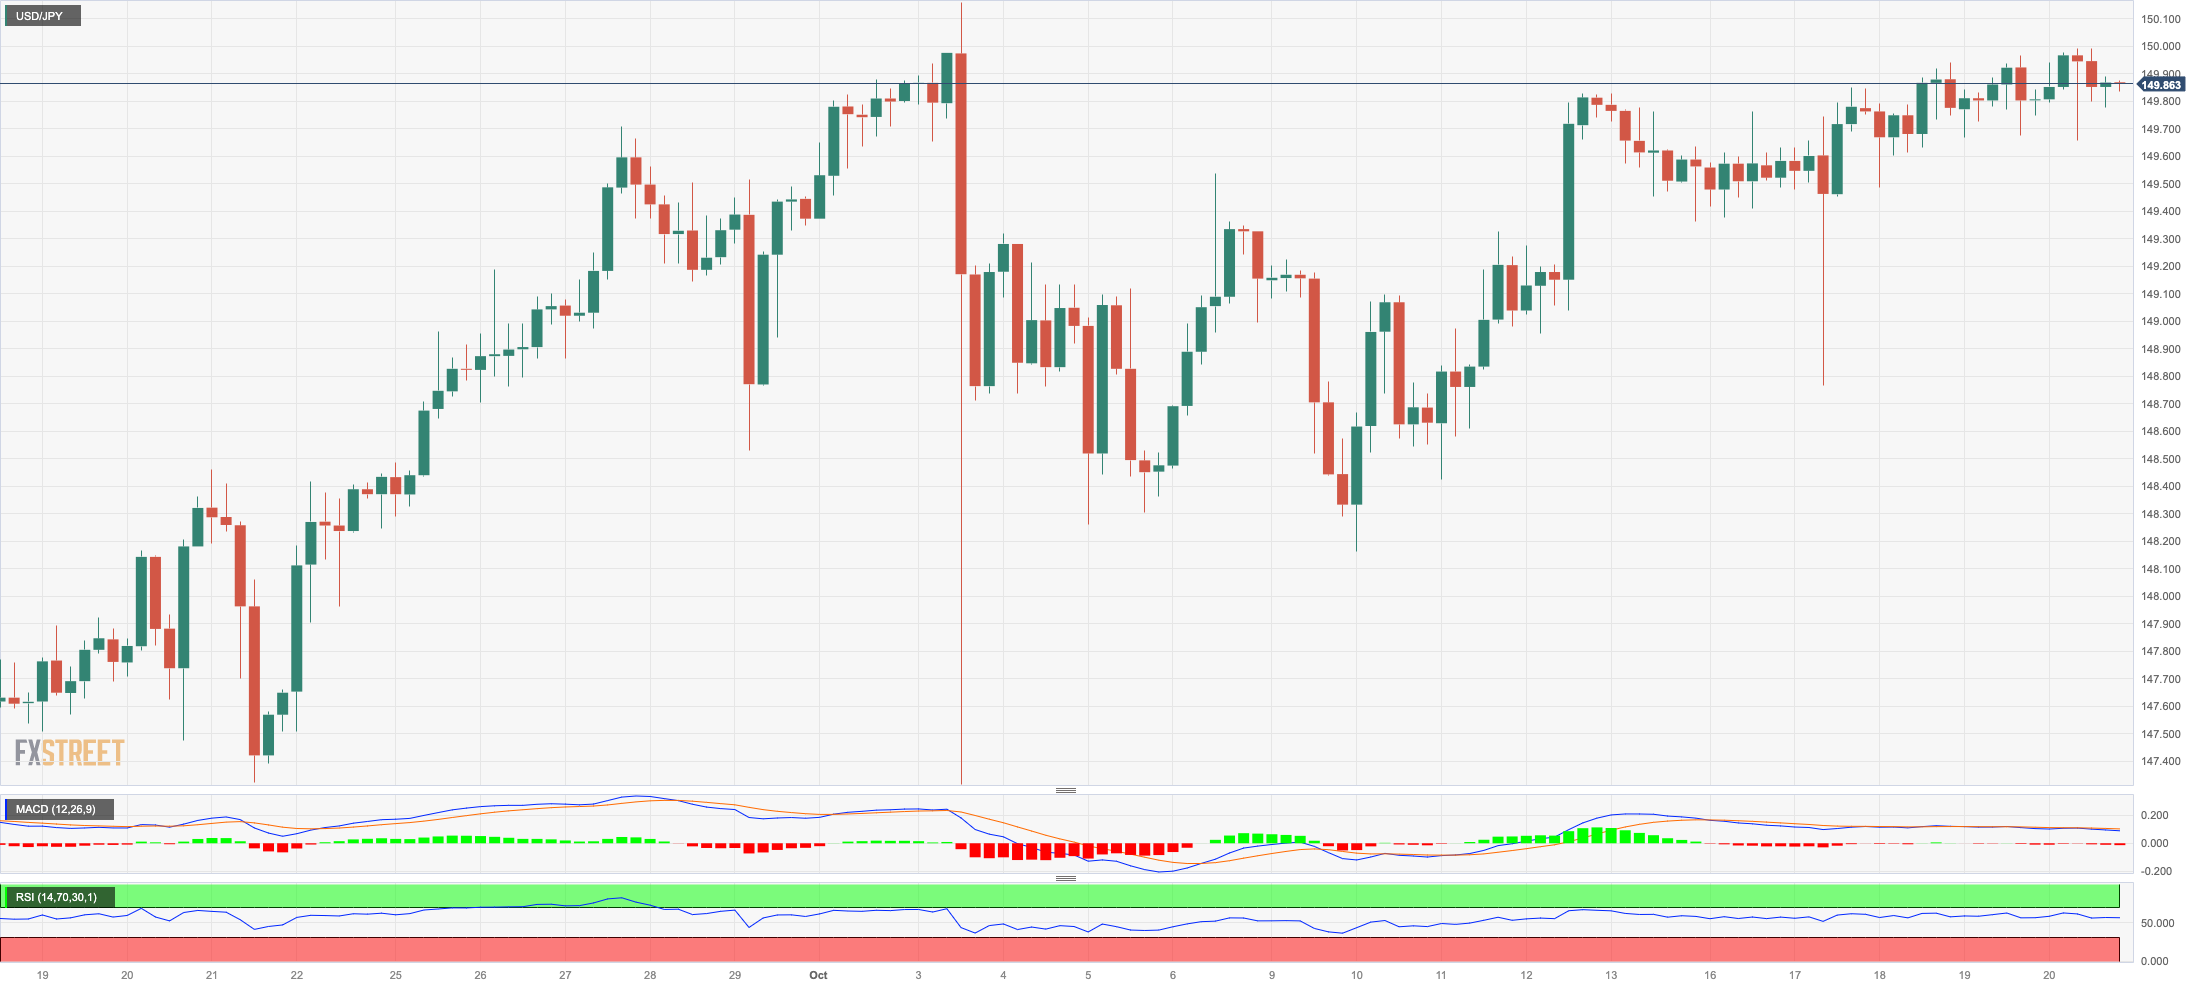
USDJPY
The better tone in the risk complex lifted USD/JPY to levels just shy of the critical 150.00 hurdle at the end of the week.
The move higher in the pair came exclusively in response to the improved appetite for riskier assets on the back of the continuation of the selling pressure hurting the greenback and declining US and Japanese yields.
News from the BoJ cited Governor K. Ueda as stating that there was a need to manage interest rate risk, given the exceptionally high uncertainty surrounding Japan's economic and price outlook. He emphasized the importance of closely monitoring the developments in the financial and foreign exchange markets, as well as their potential impact on Japan's economy and price levels. Furthermore, he mentioned that the BoJ would strive to achieve the 2% inflation target in a stable and sustainable manner while also promoting wage growth by maintaining the current accommodative policy with patience.
In the Japanese docket, the inflation rate rose 3.0% in the year to September, the core inflation rate gained 2.8% YoY, and the inflation rate ex-food and energy went up 4.2% over the last twelve months.
Immediately to the upside for USD/JPY comes the 2023 high of 150.16 (October 3), ahead of the 2022 top of 151.94 (October 21). By contrast, the transitory 55-day SMA at 147.39 is expected to offer initial contention ahead of the weekly low at 145.89 (September 11) and the interim 100-day SMA at 144.71. The loss of the latter exposes a move to the September low of 144.43 (September 1), ahead of the August low of 141.50 (August 7) and the 200-day SMA at 139.32, which precedes the July low of 137.23 (July 14). The daily RSI edged up marginally above 60.
Resistance levels: 149.99 150.16 151.94 (4H chart)
Support levels: 149.61 149.48 148.73 (4H chart)
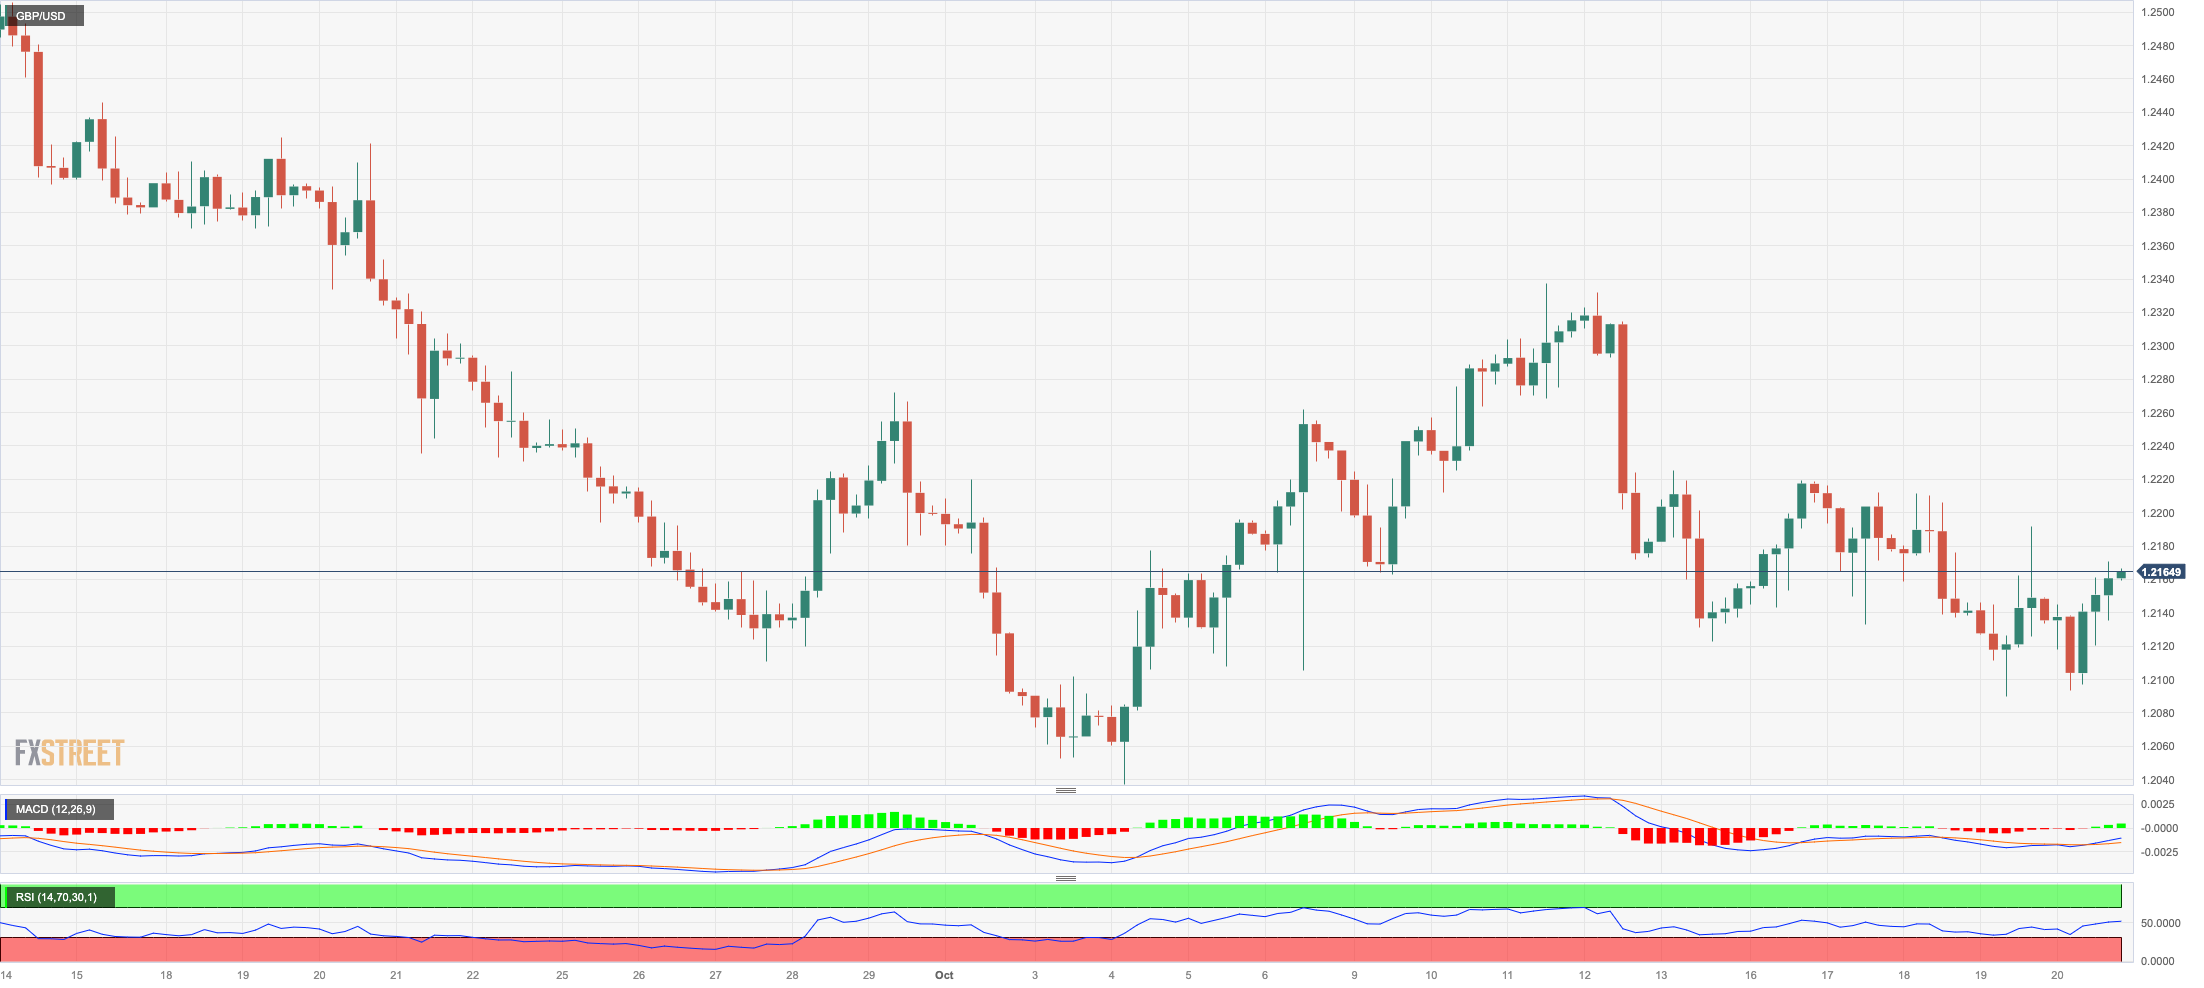
GBPUSD
Bulls remained in control of the British pound on Friday, lifting GBP/USD back to the 1.2170 region following an early drop to the sub-1.2100 area.
In fact, the quid managed to capitalize on another poor session of the greenback against a broad-based flattish mood in the FX universe at the end of the week, setting aside at the same time disappointing figures from the UK docket.
On the latter, Retail Sales in the UK contracted at a monthly 0.9% in September and 1.0% from a year earlier. In addition, Public Sector Net Borrowing increased to £13.526B also in September.
Further GBP/USD weakness might bring the pair down to the October low of 1.2037 (October 3). This number is barely shy of the psychologically important threshold of 1.2000 and the lowest point it hit in 2023, which was 1.1802 (March 8). The immediate resistance level for Cable, on the other hand, is represented by the October high of 1.2337 (October 11), followed by the 200-day SMA at 1.2441. Beyond this level, the following resistance levels are the weekly tops of 1.2746 (August 30), 1.2818 (August 10), and 1.2995 (July 27), all of which are prior to the key level of 1.3000. For the day, the RSI advanced past the 41 level.
Resistance levels: 1.2219 1.2286 1.2337 (4H chart)
Support levels: 1.2089 1.2037 1.1802 (4H chart)
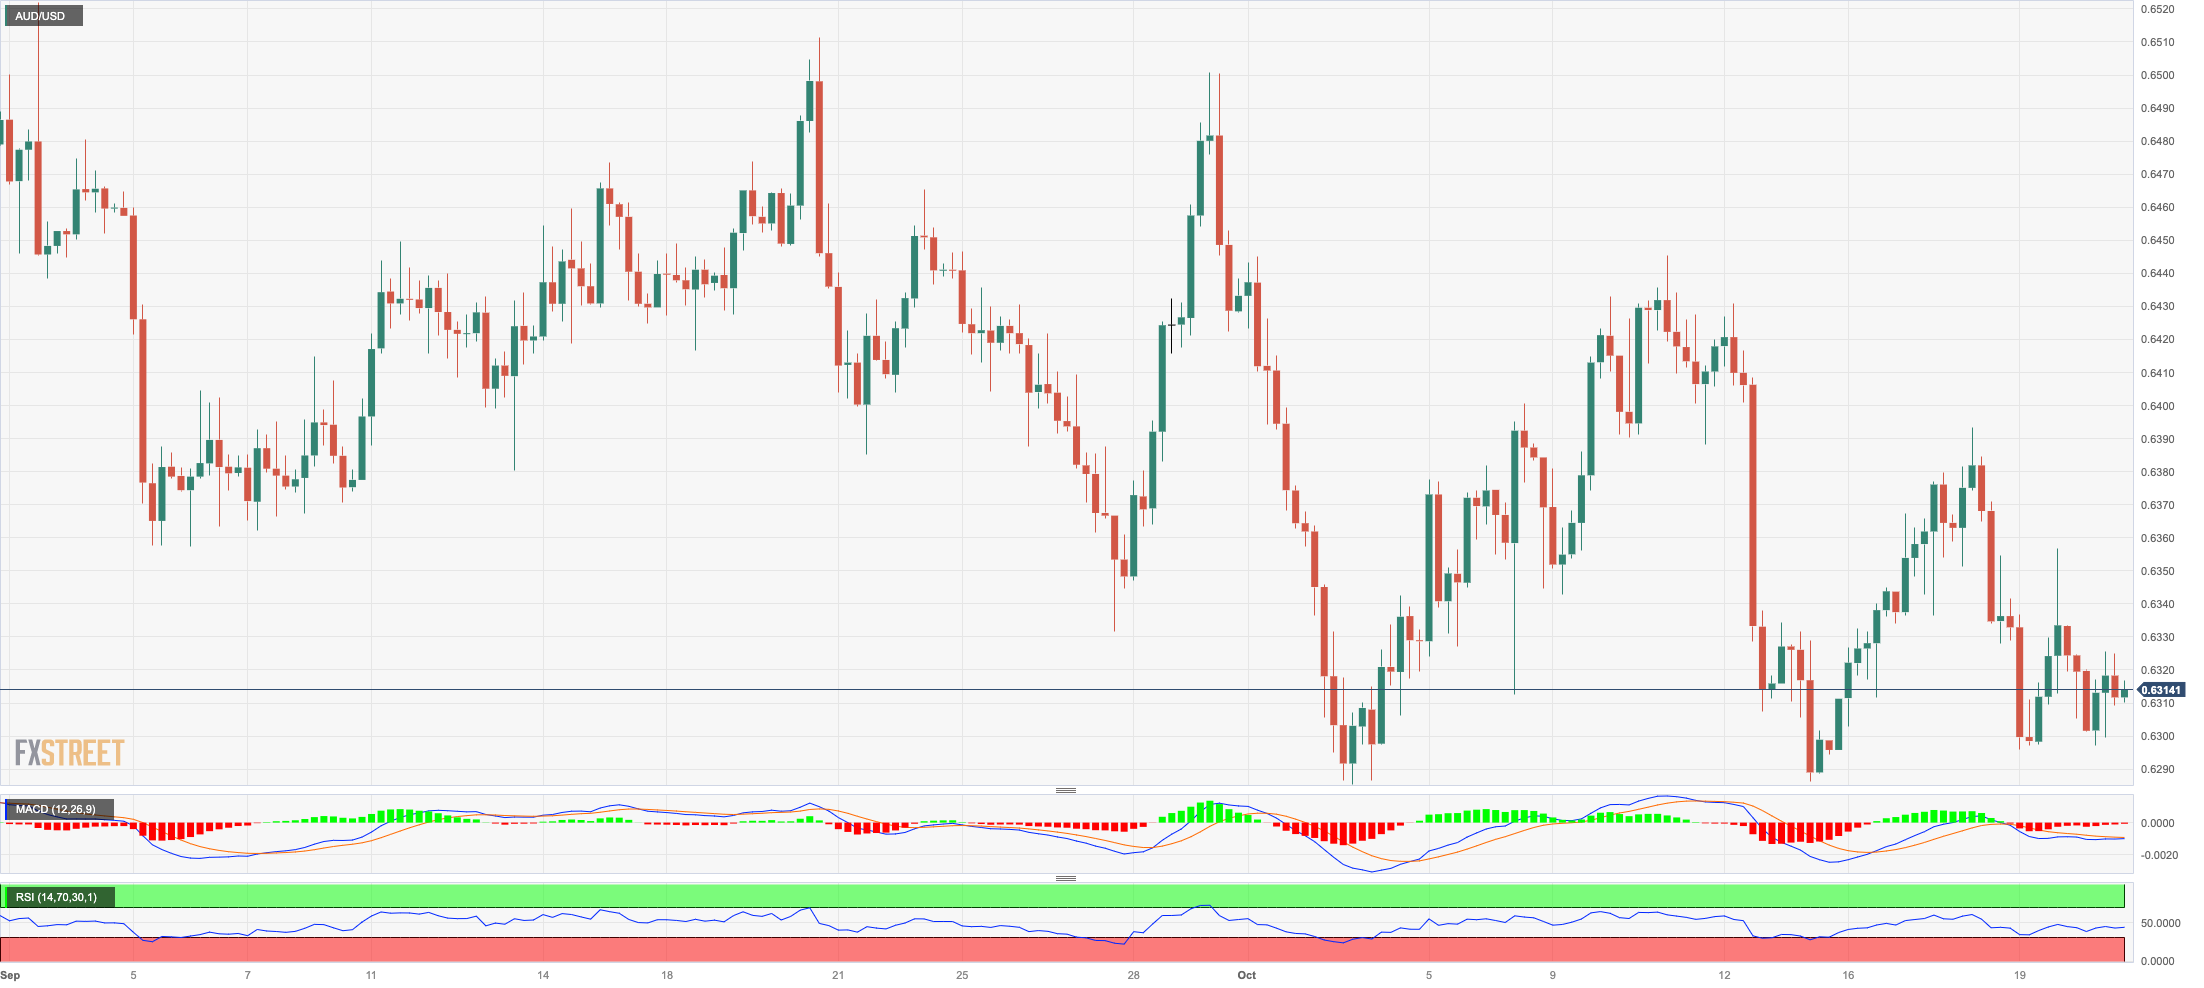
AUDUSD
AUD/USD added to the weekly leg lower and put the 0.6300 region to the test once again on Friday.
The Aussie dollar failed to stage any recovery despite the greenback trading once again in an offered bias, although the mixed price action in the commodity complex also seems to have played against AUD at the end of the week.
In addition, further weakness could have emerged after the PBoC left its interest rates unchanged early in the session, pouring cold water over expectations of potential rate cuts and further stimulus.
The Australian docket was empty on Friday.
The continuation of the selling pressure may cause the AUD/USD to challenge the 2023 bottom of 0.6285 (October 3) before the November 2022 low of 0.6272 (November 7) and the 2022 low of 0.6179 (October 13). On the flip side, the weekly high of 0.6445 (October 11) is the immediate up-barrier, seconded by another weekly top of 0.6522 (August 30). The latter's breakout shows the temporary 100-day SMA at 0.6551, prior to the weekly peak of 0.6616 (August 10) and the 200-day SMA at 0.6652. Further gains may push the pair to its July high of 0.6894 (July 14), then to the June top of 0.6899 (June 16), and eventually to the critical 0.7000 threshold. The RSI weakened to the vicinity of 41.
Resistance levels: 0.6356 0.6393 0.6445 (4H chart)
Support levels: 0.6295 0.6285 0.6272 (4H chart)
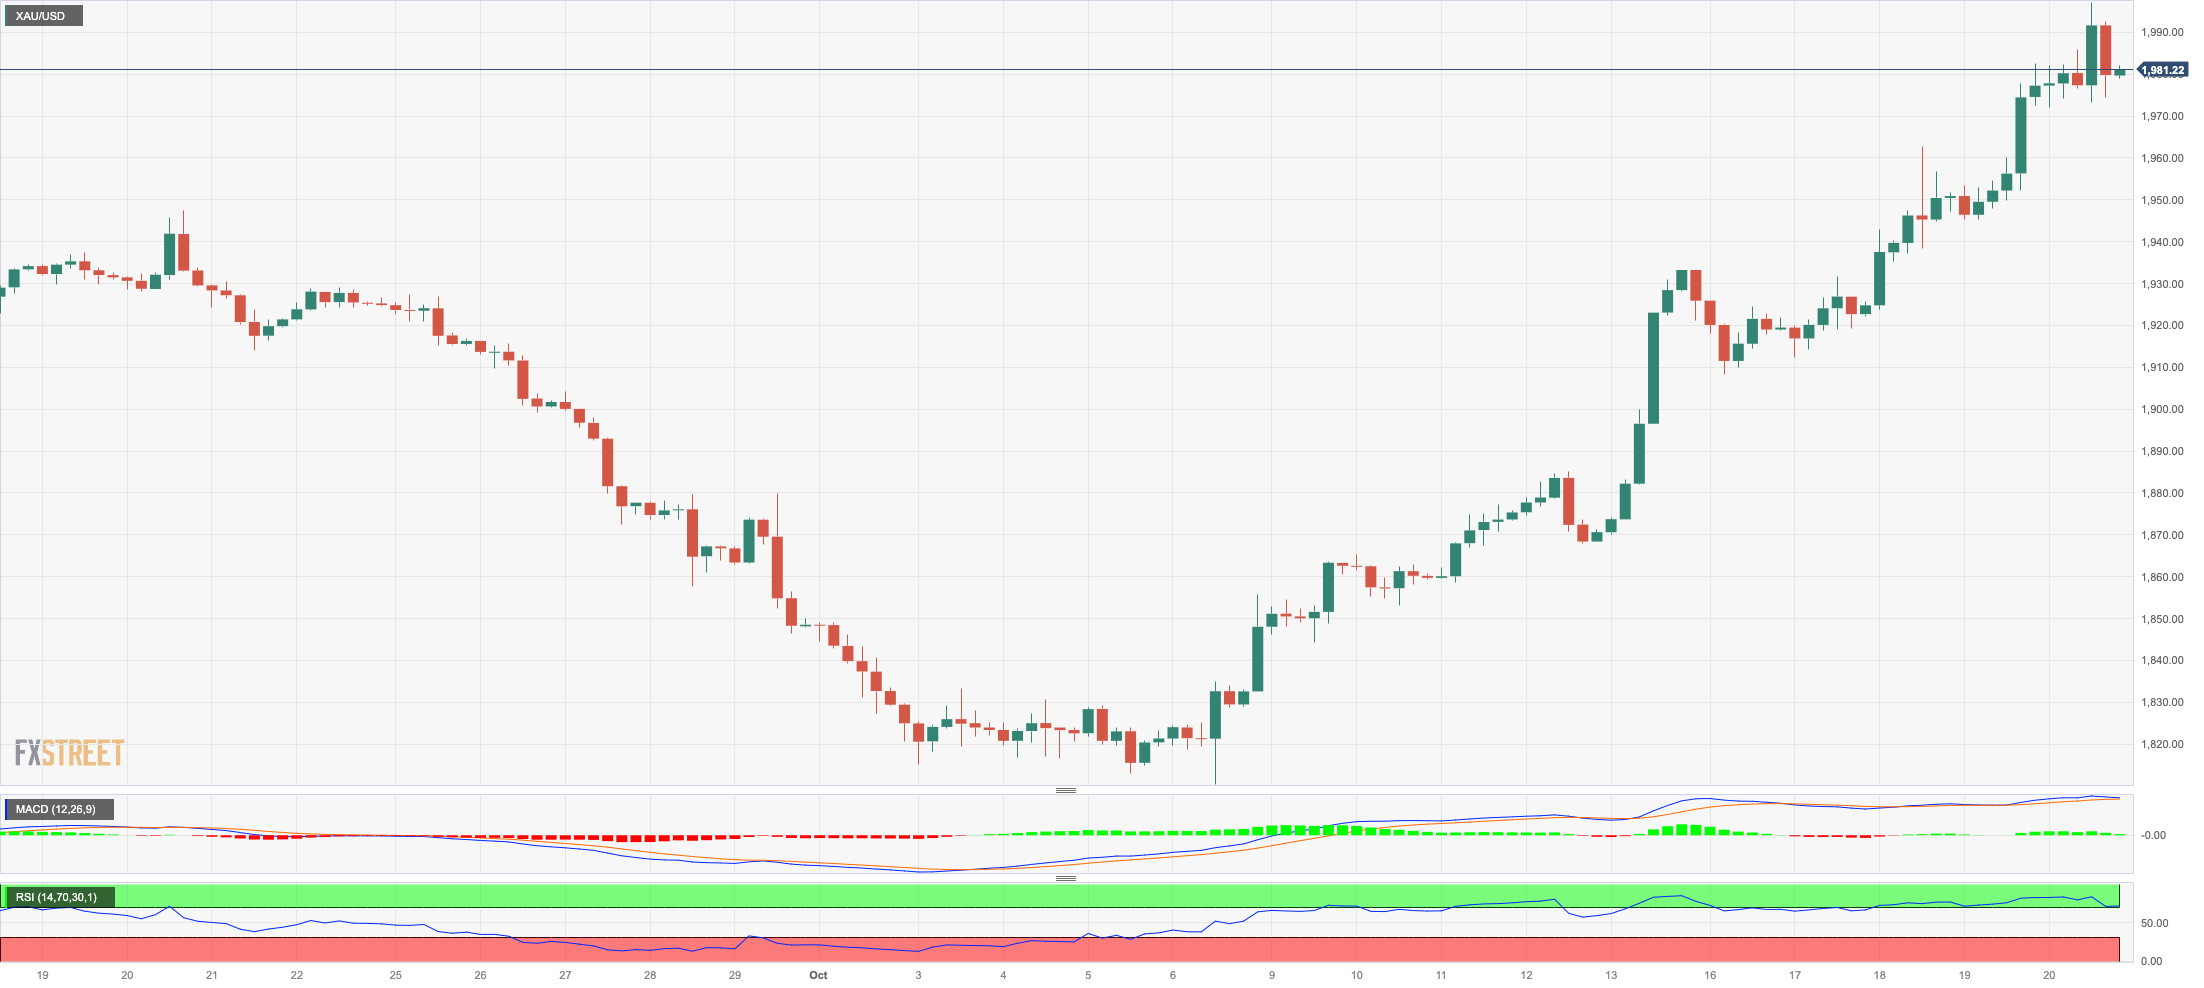
GOLD
Prices of the yellow metal advanced further and climbed to just cents away from the critical $2000 threshold per troy ounce for the first time since mid-May at the end of the week.
In fact, gold prices advanced for the fourth session in a row on Friday, underpinned by escalating geopolitical concerns in the Middle East, while diminishing US yields across the curve and the offered tone in the greenback also added to the already strong sentiment surrounding the precious metal.
Gold prices should now target the key $2000 level. From here, the 2023 high of $2067 (May 4) might be challenged, followed by the 2022 top of $2070 (March 8) and the all-time peak of $2075 (August 7, 2020). On the contrary, there is immediate support at the 200-day SMA at $1930 followed by the interim 55-day SMA at $1905 and the October low of $1810 (October 6). The loss of the later could put the 2023 low of $1804 (February 28) to the test prior to the crucial support zone of $1800.
Resistance levels: $1997 $2022 $2048 (4H chart)
Support levels: $1908 $1898 $1867 (4H chart)
CRUDE WTI
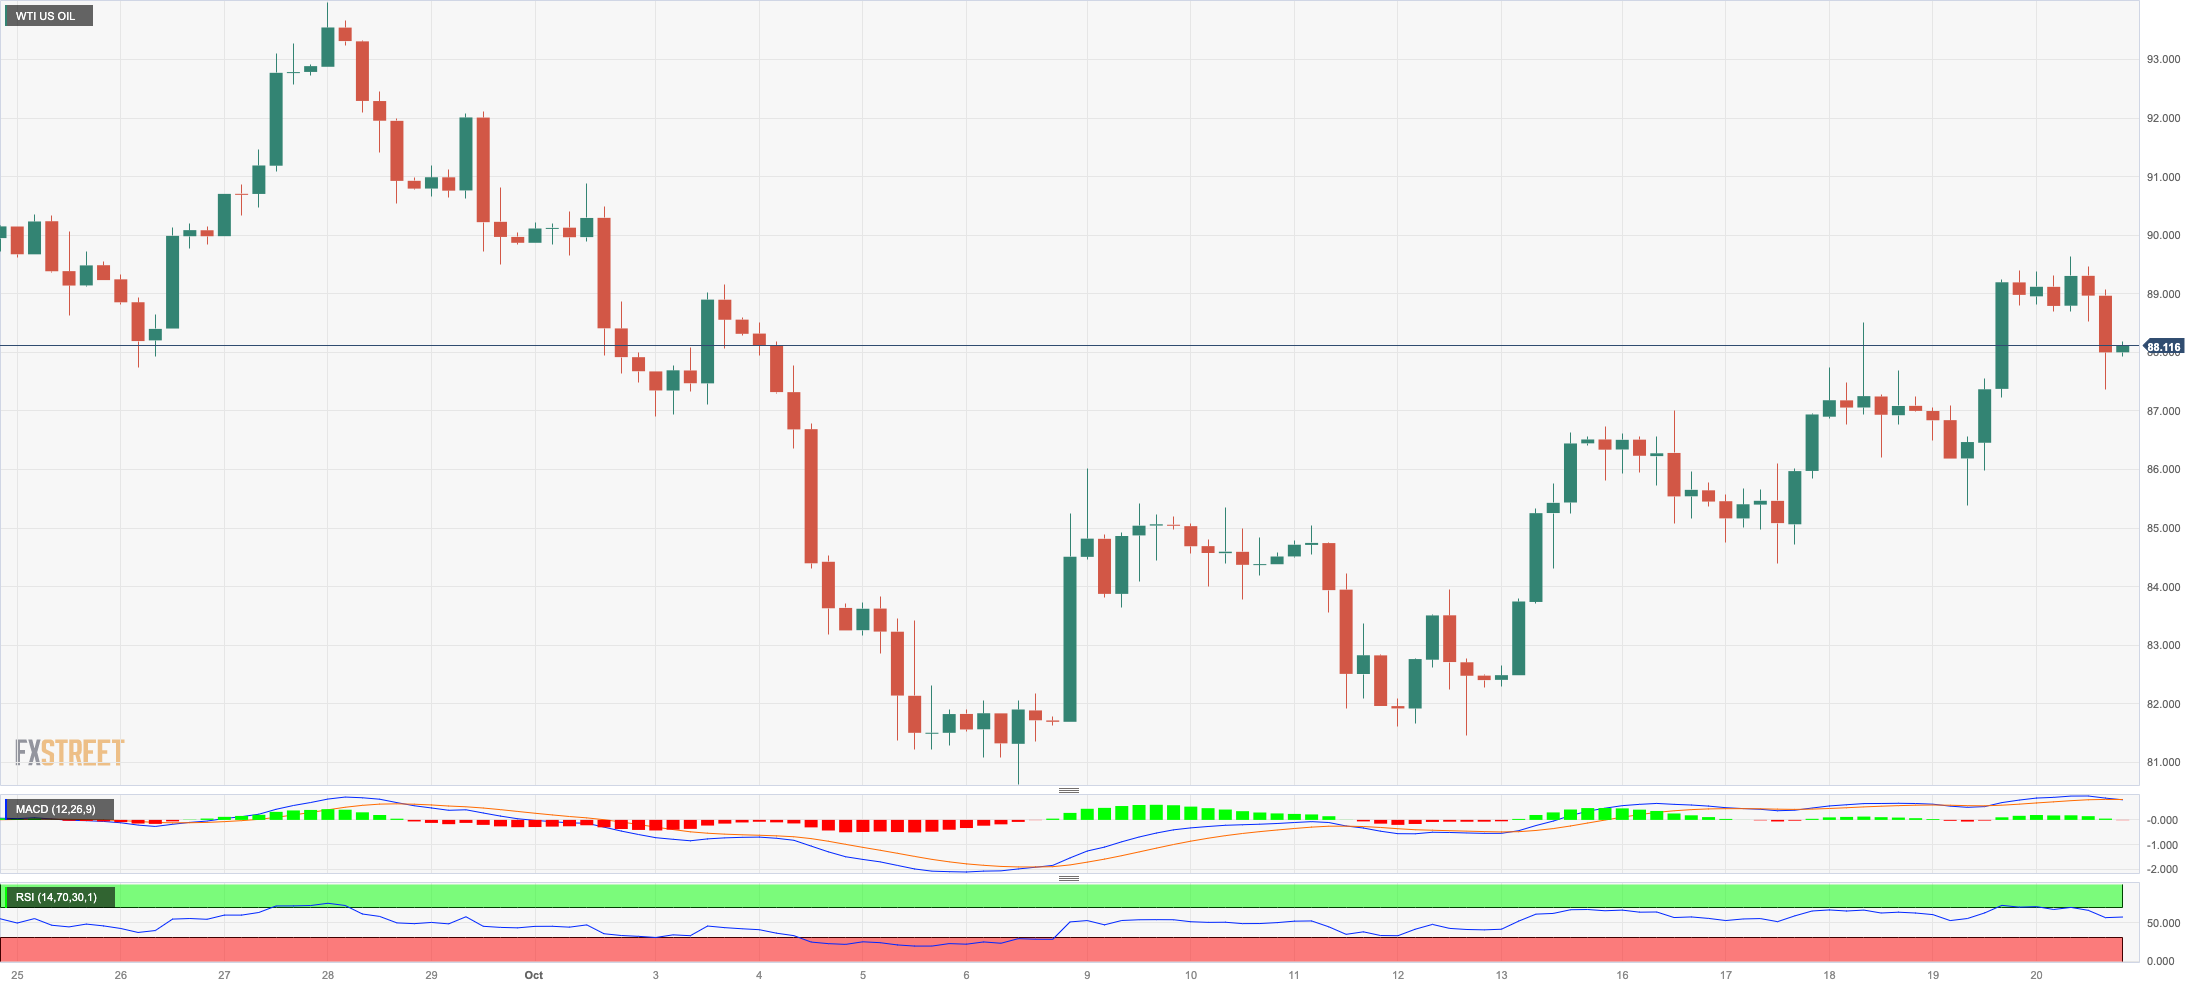
WTI prices halted their three-day positive streak on Friday, coming under some downside pressure and receding to the $88.00 area per barrel.
The daily downtick in crude oil prices came in response to alleviating concerns that the Middle East crisis could escalate to neighbouring regions, all after the Islamist group Hamas released two US hostages earlier on Friday.
However, the effervescence in the region appears far from abated for the time being, and so are fears around potential supply disruptions, which eventually acted as some contention for the bearish impulse.
Despite Friday’s decline, WTI clinched its second consecutive week of gains, managing to regain further ground following the pronounced pullback early in the month.
In the docket, the US oil rig count increased by 1 to 502 total active oil rigs in the week to October 20, according to driller Baker Hughes.
Next on the upside for WTI aligns the weekly high of $89.83 (October 18) before the 2023 top of $94.99 (September 28) and the weekly peak of $97.65 (August 30, 2022), all ahead of the psychological $100.00 mark per barrel. Conversely, the October low of $81.56 (October 6) emerges as the immediate contention before the critical $80.00 level, as well as the August low of $77.64 (August 24), which appears to be supported by the 200-day SMA at $78.00. If this zone is breached, the commodity may fall to the weekly low of $73.89 (July 17), ahead of the June low of $66.85 (June 12), and the 2023 low of $63.61 (May 4), all prior to the critical $60.00 level per barrel.
Resistance levels: $89.83 $91.84 $93.06 (4H chart)
Support levels: $85.44 $82.27 $81.47 (4H chart)
GER40
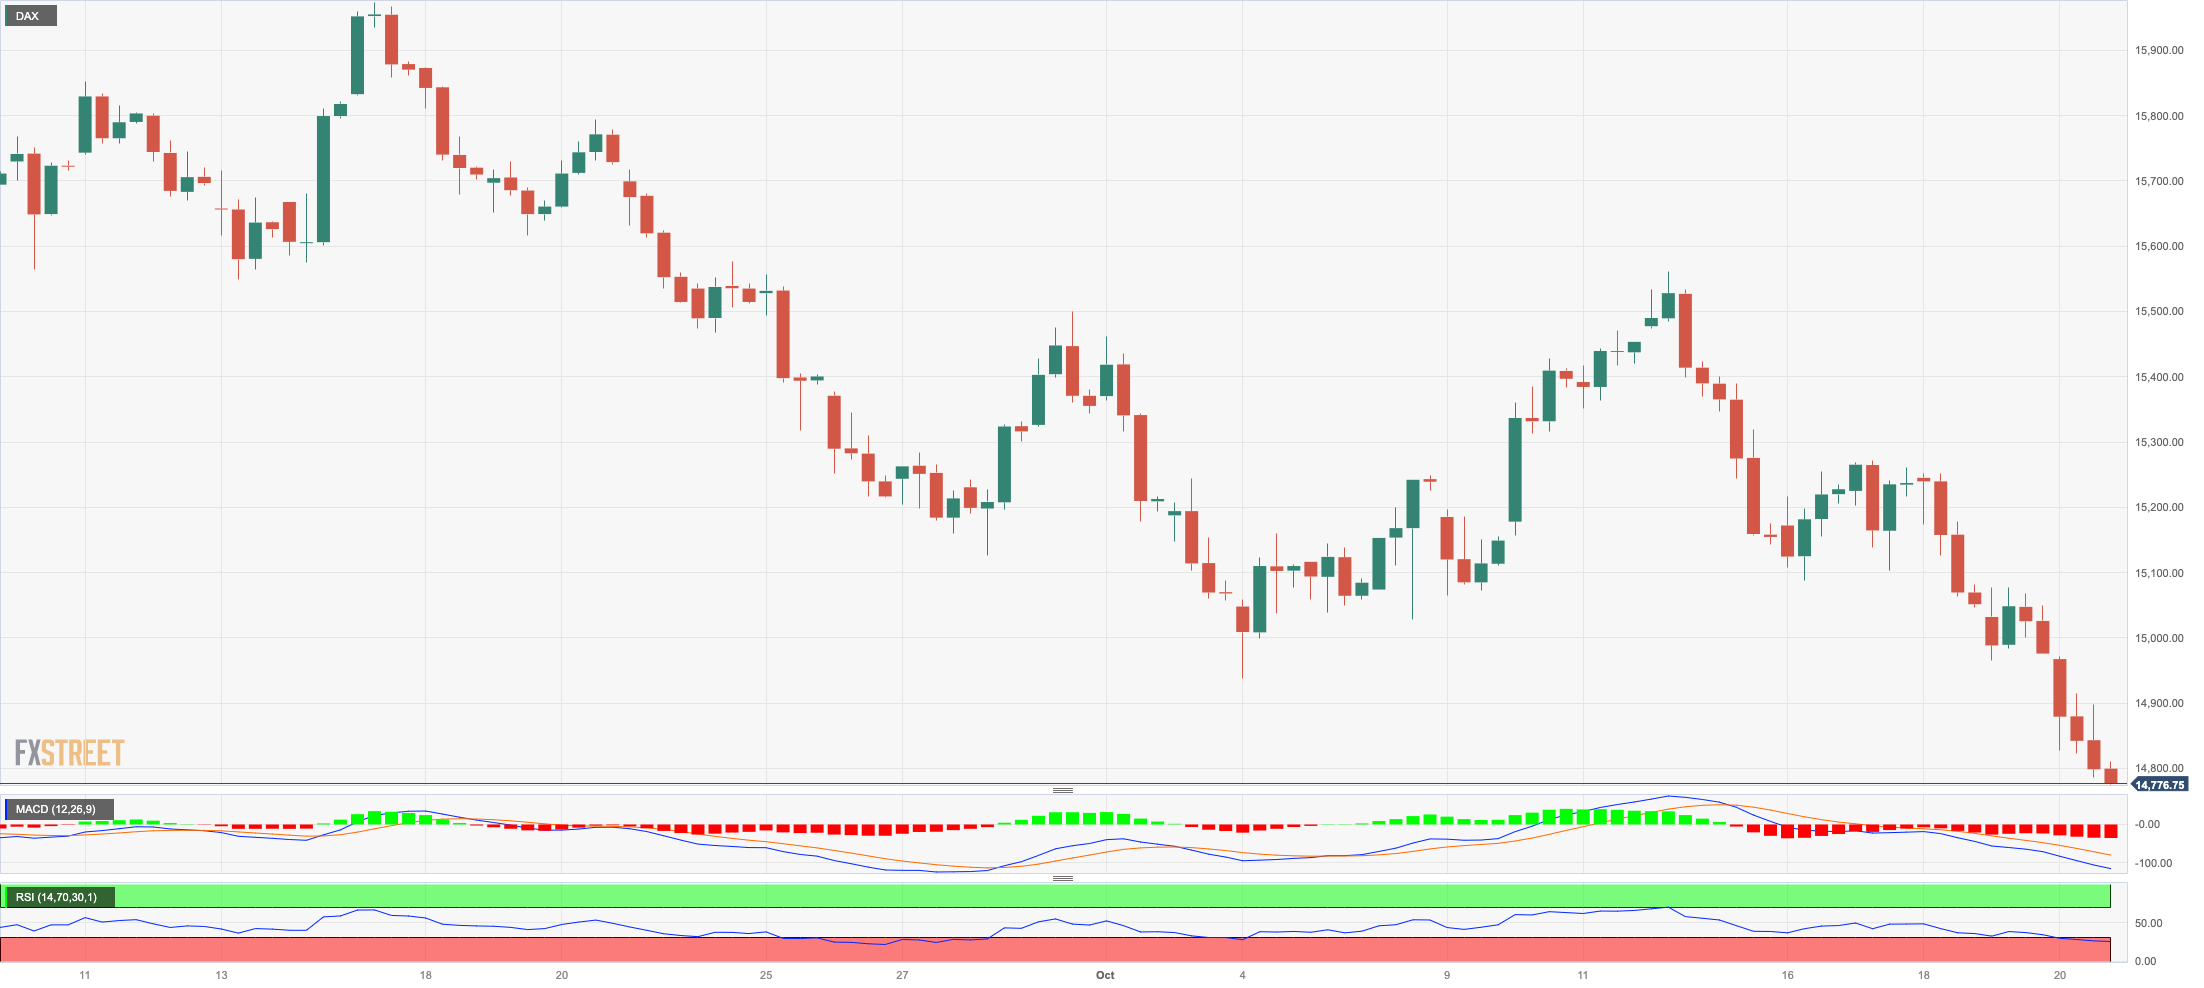
There was no respite for the downside pressure in European markets on Friday.
Against that, Germany’s benchmark DAX40 clinched its third straight session of losses, reaching levels last seen in late March around the 14800 zone.
The daily retracement of German equities came on the back of escalating geopolitical concerns in the Middle East, along with fears that the conflict could spread to other regions.
The persistent flight-to-safety mood among investors left no room for recovery in past sessions, leaving the index vulnerable to extra losses on the short-term horizon.
In addition, the perception that the Fed's tighter-for-longer narrative might extend more than expected was also another driver surrounding investors’ gloomy sentiment.
If bears keep pushing, the index may retest the March low of 14458 (March 20) prior to the December 2022 low of 13791 (December 20), and the 2022 low of 11862 (December 20). On the upside, the initial resistance is located at the October high of 15575 (October 12), followed by the important 200-day SMA of 15651. Further up, the September top of 15989 (September 15) is seen, prior to weekly peaks of 16042 (August 31) and 16060 (August 10). The breakout of the latter might send the index back to its all-time high of 16528 (July 31). The daily RSI sank to the 31 zone.
Best Performers: Fresenius SE, Rheinmetall AG, Covestro
Worst Performers: Heidelbergcement, Sartorius AG VZO, Siemens Energy AG
Resistance levels: 15575 15729 15989 (4H chart)
Support levels: 14798 14458 13791 (4H chart)
NASDAQ
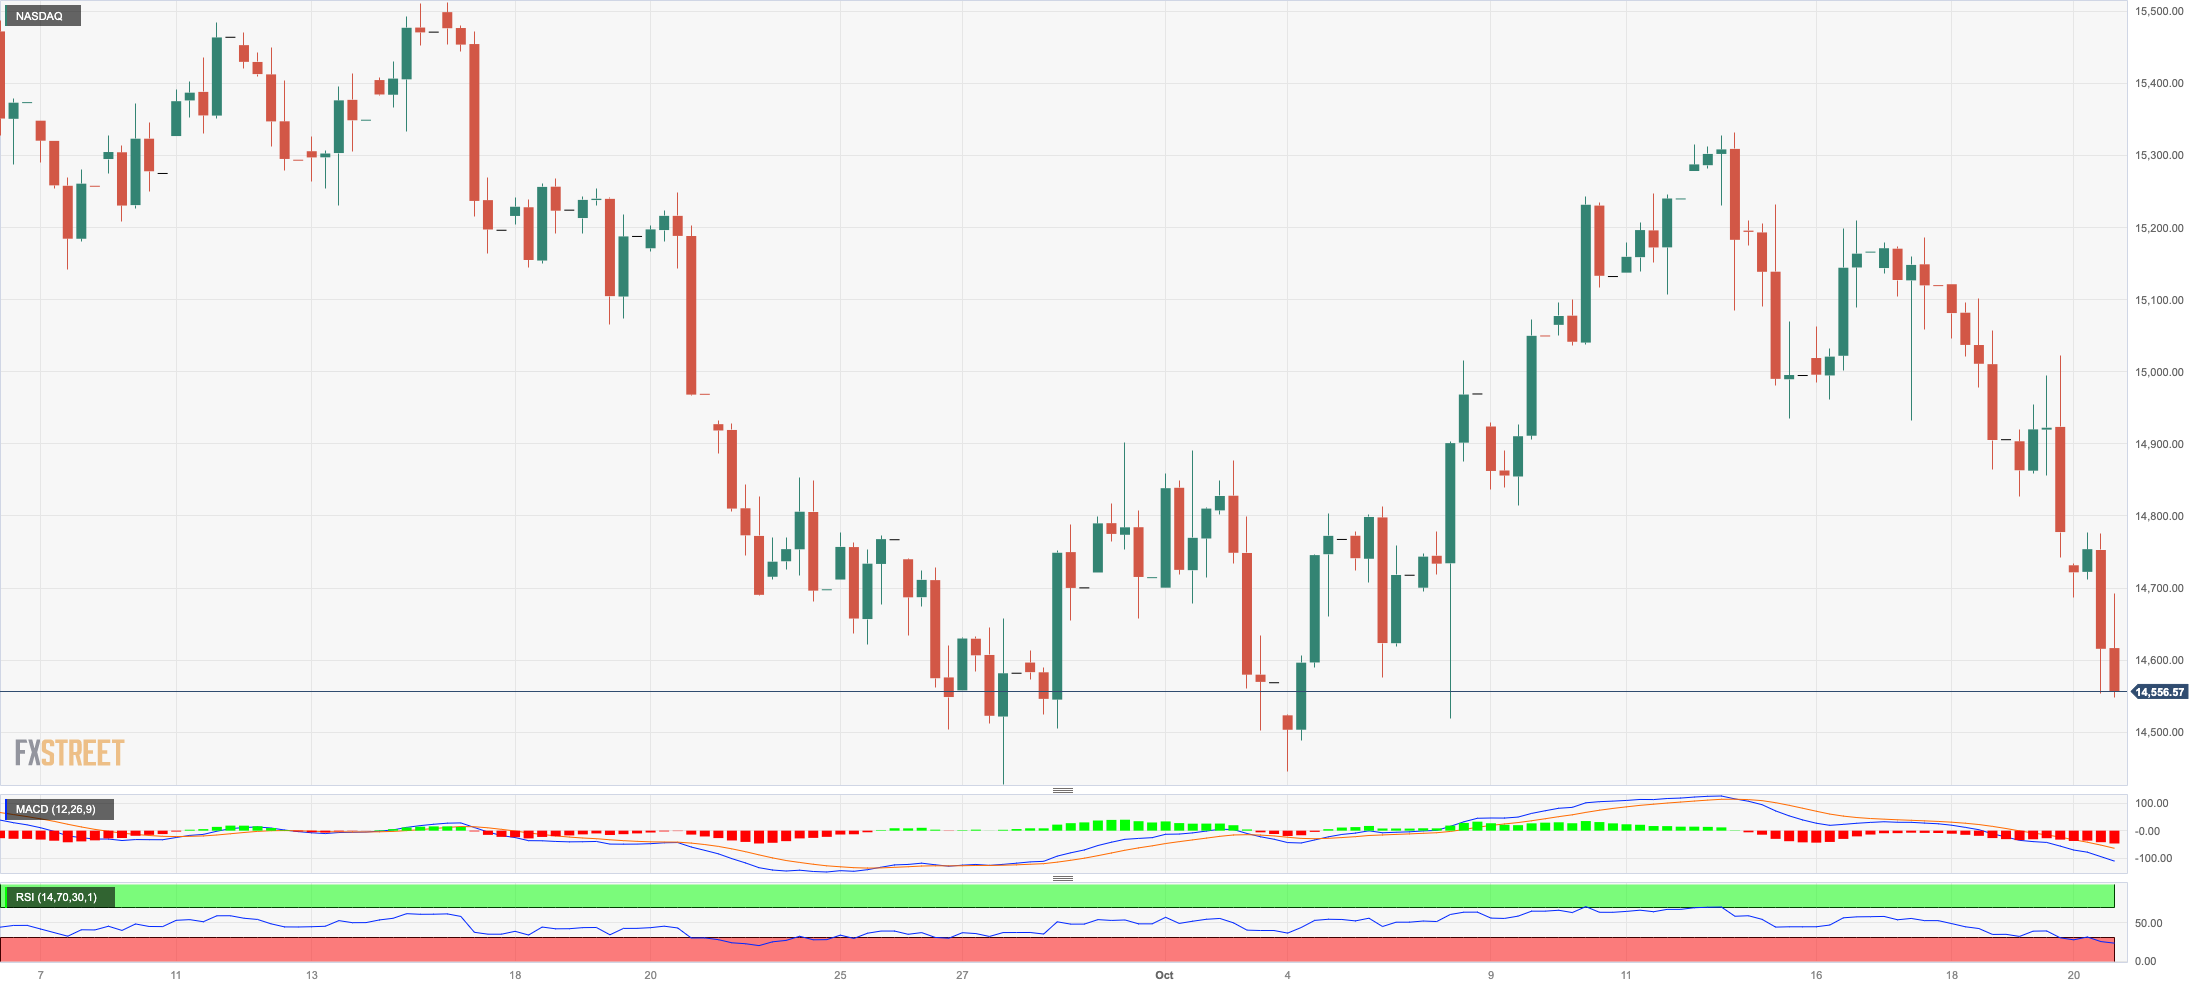
The fourth consecutive daily pullback dragged the tech reference Nasdaq 100 to new two-week lows near the 14500 level on Friday.
The tech index was no exception and succumbed to the broad-based risk-off sentiment on the back of unabated geopolitical fears, while further hawkish narrative from Fed speakers in combination with the recent pronounced uptick in US yields, all kept the price action in the tech sector depressed.
The Nasdaq 100 is approaching its September low at 14432 (September 27), which comes ahead of the weekly low of 14283 (June 7) and the 200-day SMA at 13844. Should this level be breached, there is a potential for a revisit to the April low at 12724 (April 25), followed by the March low at 11695 f(March 13), and ultimately the 2023 low at 10696 (January 6). On the contrary, the October high of 15333 (October 12) emerges as the next up barrier prior to the September top of 15618 (September 1), and the weekly peak of 15803 (July 31). The breakout of this level could prompt the index to dispute the 2023 high of 15932 (July 19), before the round level of 16000. The daily RSI deflated below the 39 yardstick.
Top Gainers: Walgreen Boots, O’Reilly Automotive, CSX
Top Losers: Enphase, Zscaler, Palo Alto Networks
Resistance levels: 15333 15512 15618 (4H chart)
Support levels: 14432 14283 13520 (4H chart)
DOW JONES
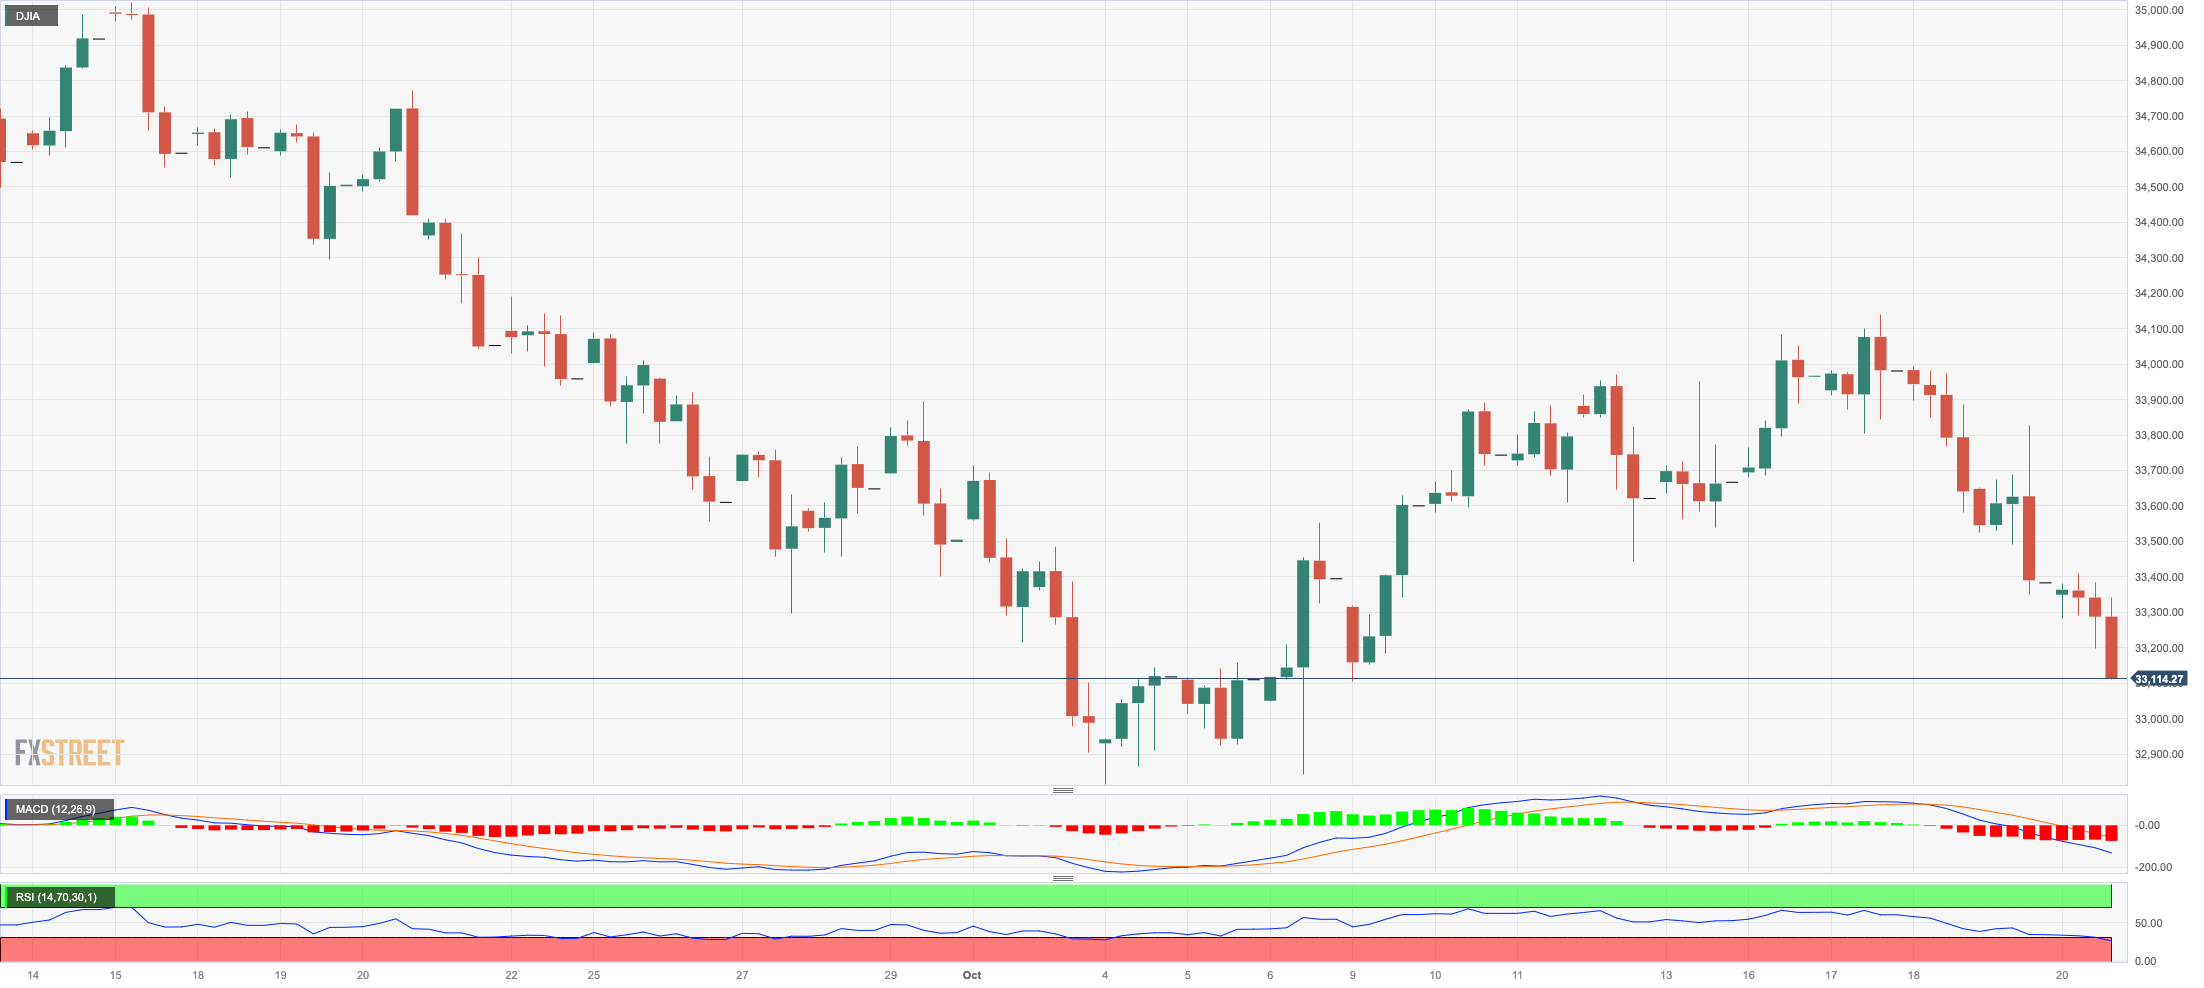
Another negative session for US stocks saw the blue-chip index Dow Jones drop to four-month lows near the 33100 region at the end of the week.
It was the third consecutive daily pullback in the index, which this time came accompanied by rising geopolitical jitters, safe haven demand, and firmer prospects that the Federal Reserve might stick to its restrictive stance for longer than anticipated.
At the end of the day, the Dow Jones retreated 0.86% to 33127, the S&P500 dropped 1.26% to 4224, and the tech-focused Nasdaq Composite deflated 1.53% to 12983.
Further weakness could prompt the Dow Jones to revisit the October low of 32873 (October 4) prior to the May low of 32586 (May 25) and the 2023 low of 31429 (March 15). Having said that, the next up barrier comes at the key 200-day SMA at 33829, while the surpass of this region carries the potential to spark extra gains to the October high of 34147 (October 17), which is just ahead of the interim 55-day and 100-day SMAs at 34277 and 34318, respectively. The September high of 34977 (September 14) is north of here, followed by the weekly top of 35070 (August 31) and the 2023 peak of 35679 (August 1). If the latter is exceeded, the 2022 high of 35824 (February 9) may be reached before the all-time top of 36952 (January 5, 2022). The day-to-day RSI dropped below the 36 level.
Top Performers: Merck&Co, Walgreen Boots, J&J
Worst Performers: American Express, Salesforce Inc, Intel
Resistance levels: 34147 34322 34977 (4H chart)
Support levels: 33118 32846 32586 (4H chart)
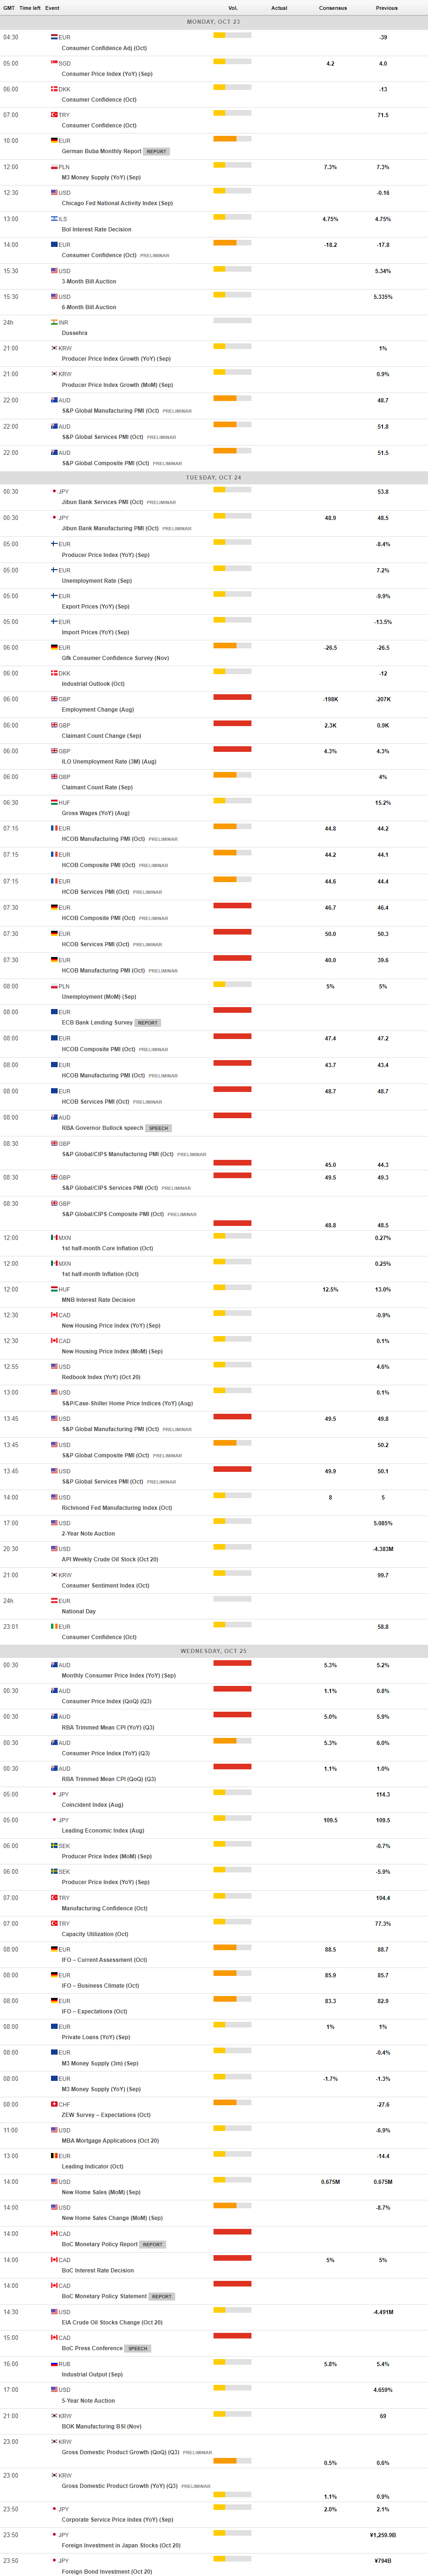
MACROECONOMIC EVENTS
All Information & Updates provided by:

All information relating to the financial markets available on this page has been prepared and issued by FXStreet (Forexstreet SL, Spain, Reg: B62498233) on the basis of publicly available information and all information believed to be reliable and does not conflict with Kuwaiti local laws, and all necessary care has been taken to before the company to ensure that the facts mentioned are correct from the source.
NCM Investment nor any of its directors or employees shall in any way be held responsible for the contents of this news, and the information contained on this page is intended only to provide clients with publicly available information and should not be construed as investment advice, report or analysis and/or constitute an offer or invitation to buy or sell financial instruments of any kind.
RISK WARNING: Forex and CFDs are highly risky leveraged products, as losses can exceed deposits. Please ensure you understand all the risks and take independent advice if necessary. NCM will segregate the clients based on the criteria of the regulator and its bylaws. NCM does not provide any advisory service; the material published does not constitute advice or a recommendation for a transaction in any financial instrument. NCM accepts no responsibility for any use of the content presented and any consequences of that use. Anyone acting on the information provided does so at their own risk.