
- Contact Us:
-

-

-

-


Daily Market Updates
24 Oct 2023
USDJPY
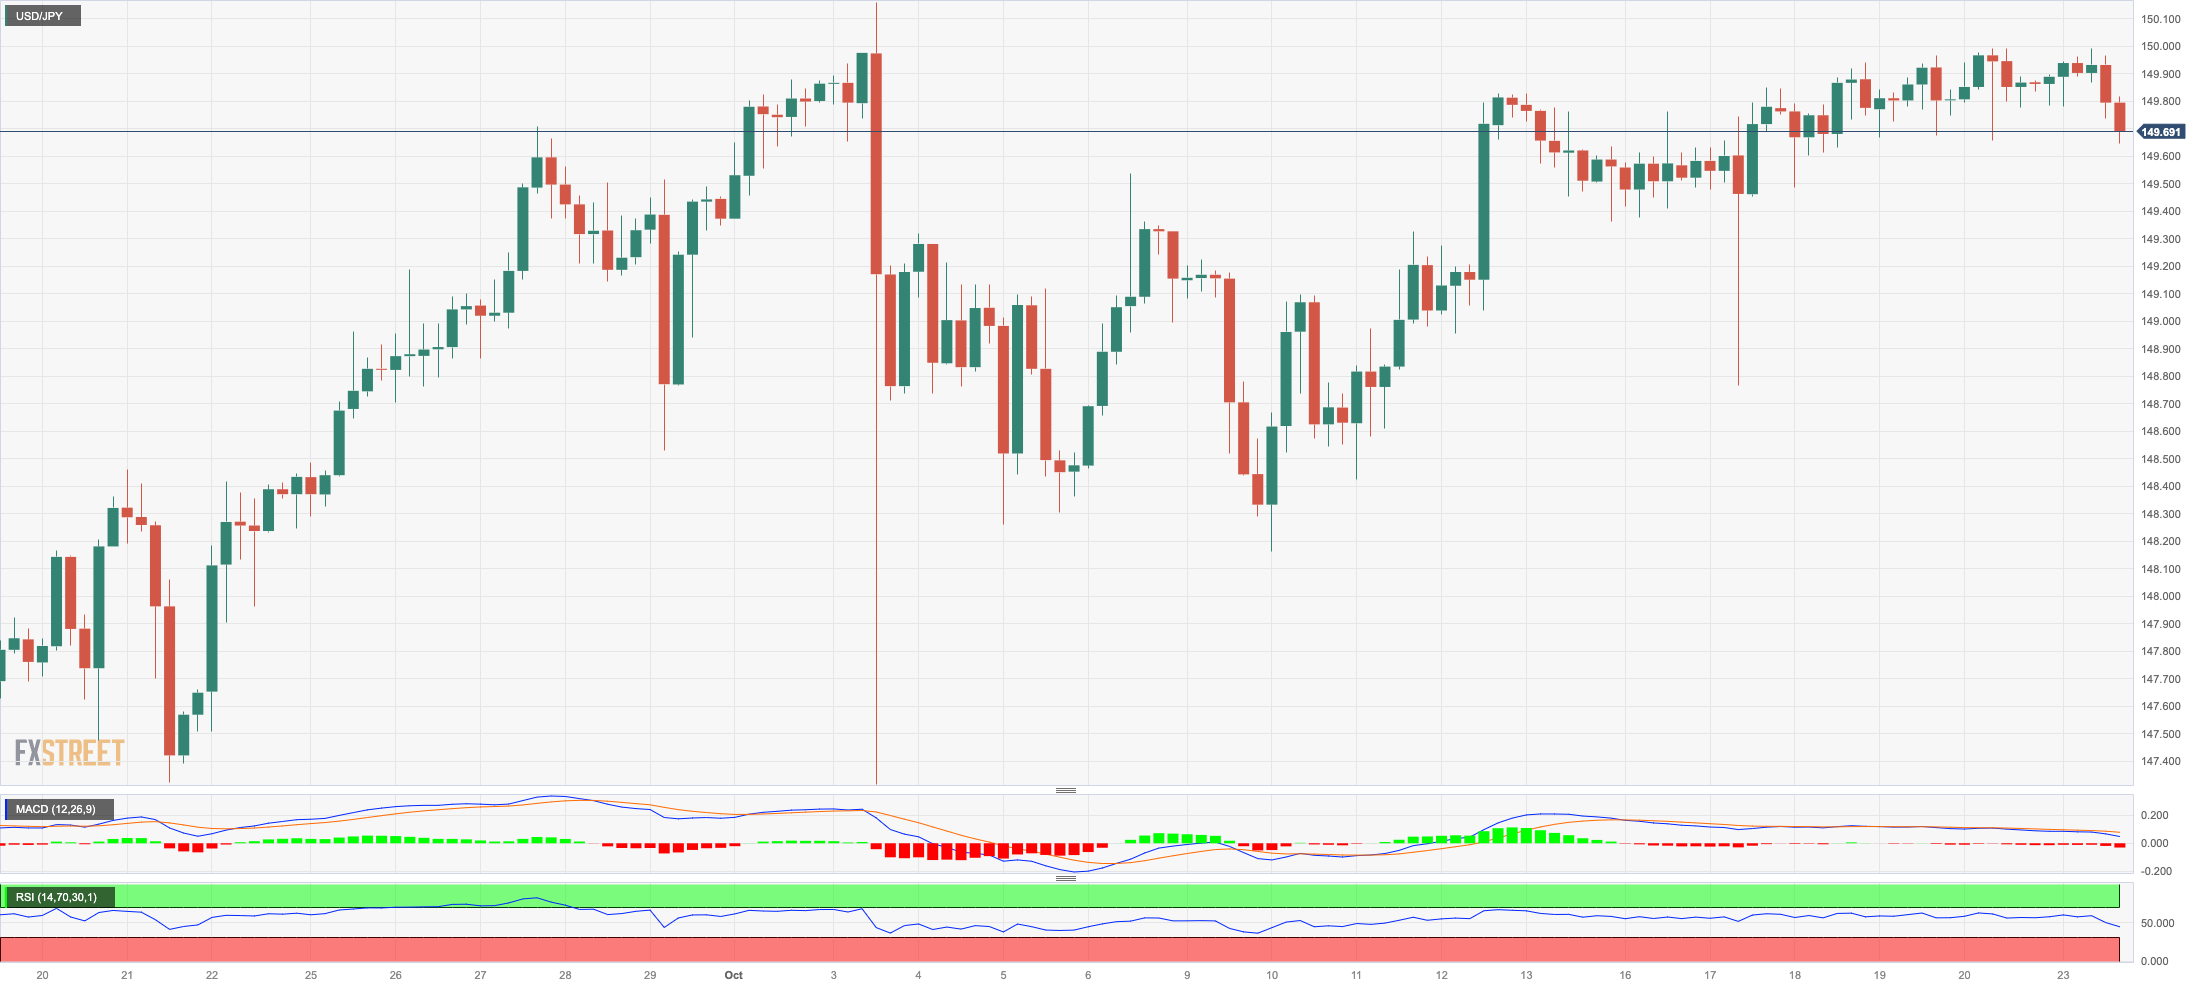
Increasing risk appetite trends and mixed price action in both US and Japanese bond markets prompted USD/JPY to extend its multi-session consolidative phase just below the critical 150.00 hurdle on Monday.
Indeed, US yields extended the decline vs. daily gains in their Japanese counterparts amidst a strong drop in the US dollar, while fears of FX intervention around the 150.00 zone continued to limit the pair’s upside potential.
The Japanese calendar was empty on Monday, while advanced Manufacturing and Services PMIs are due on Tuesday.
Further gains in USD/JPY target the 2023 high of 150.16 (October 3), followed by the 2022 top of 151.94. (October 21). By contrast, the October low of 148.16 (October 10) emerges as the immediate contention prior to the transitory 55-day SMA at 147.53, and the weekly low at 145.89 (September 11). South from here comes the intermediate 100-day SMA at 144.82 ahead of the September low of 144.43 (September 1), and the August low of 141.50 (August 7). Once cleared, the pair could challenge the 200-day SMA at 139.43, before the July low of 137.23 (July 14). The daily RSI hovered around the 59 zone.
Resistance levels: 149.99 150.16 151.94 (4H chart)
Support levels: 149.61 149.48 148.73 (4H chart)
GBPUSD
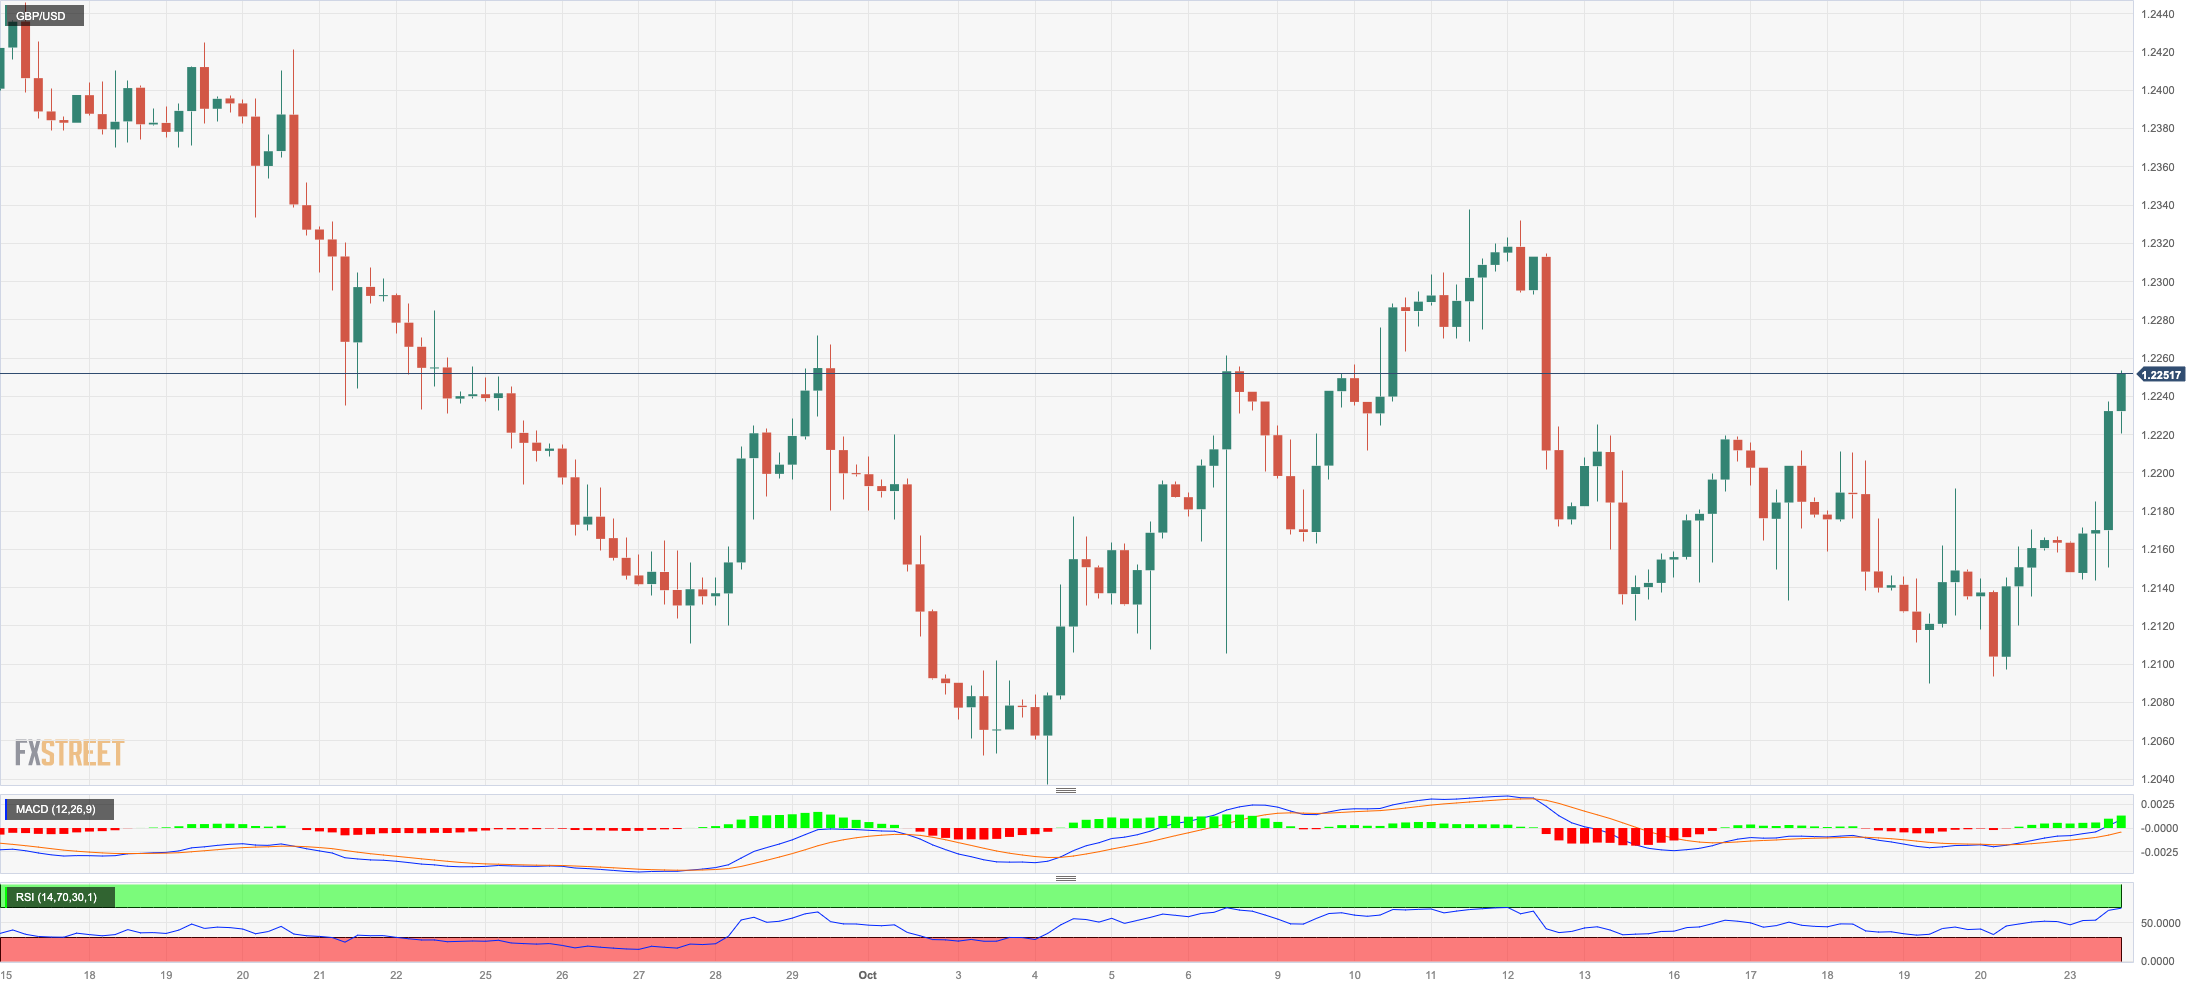
In line with the broader markets, GBP/USD traded in a positive fashion and managed to reclaim the area well north of 1.2200 the figure at the beginning of the week.
The British pound added to recent gains amidst the sharp retracement in the greenback in response to dwindling geopolitical concerns. In addition, unchanged expectations of another pause at the Federal Reserve event on November 1 also seem to have weighed on the dollar, while the BoE is also seen keeping its interest rates intact at its next gathering.
There were no data releases across the Channel on Monday.
Further GBP/USD loss may push the pair back to its October low of 1.2037 (October 3). This figure is just shy of the psychologically significant 1.2000 mark and the lowest point it reached in 2023, which was 1.1802 (March 8). Cable's immediate resistance level is indicated by the October high of 1.2337 (October 11), seconded by the 200-day SMA at 1.2441. Beyond this level emerges the weekly top of 1.2548 (September 11) prior to the transitory 100-day SMA at 1.2582. North from here comes the weekly peak of 1.2746 (August 30), seconded by 1.2818 (August 10), and 1.2995 (July 27) are, all of which precede the important level of 1.3000. The daily RSI jumped to the vicinity of the 50 threshold.
Resistance levels: 1.2253 1.2270 1.2337 (4H chart)
Support levels: 1.2089 1.2037 1.1802 (4H chart)
AUDUSD
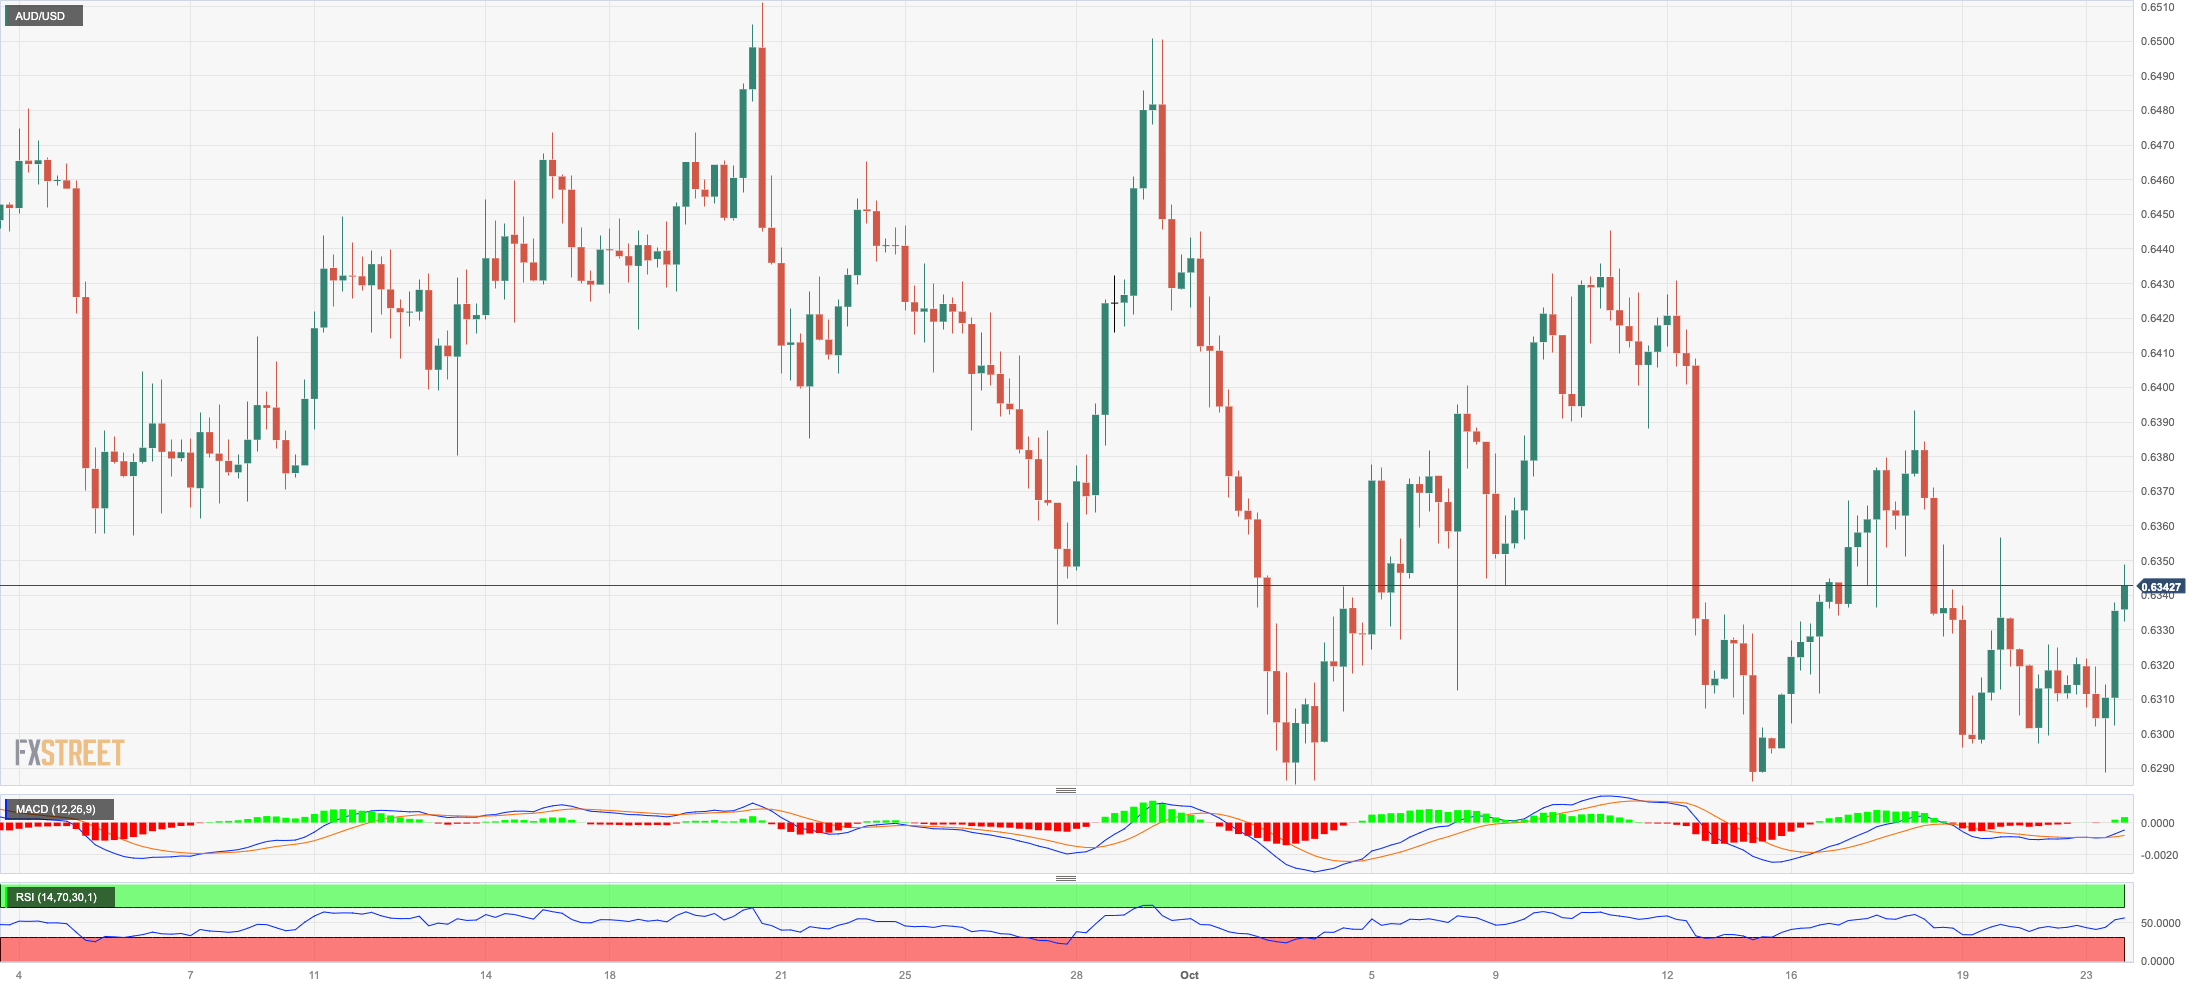
AUD/USD reversed three consecutive daily pullbacks and regained some upside traction, enough to advance past the 0.6300 hurdle on Monday.
In the meantime, the Aussie dollar regained composure against the backdrop of the pronounce decline in the greenback, declining US yields, and omnipresent cautiousness stemming from the geopolitical scenario, while broad-based mixed bias in the commodity universe also kept the pair’s upside potential somehow subdued.
There were no events or results on the Australian calendar at the beginning of the week.
If the selling pressure continues, the AUD/USD may test the 2023 low of 0.6285 (October 3) before the November 2022 low of 0.6272 (November 7) and the 2022 low of 0.6179 (October 13). On the upside, the weekly high of 0.6445 (October 11) is the immediate resistance, followed by another weekly top of 0.6522 (August 30) and the temporary 100-day SMA at 0.6548. The surpass of the latter could put a test of the weekly peak of 0.6616 (August 10) back on the radar before the 200-day SMA at 0.6649. Further increases may propel the pair to its July high of 0.6894 (July 14), then to the June top of 0.6899 (June 16), and finally to the key 0.7000 threshold. The everyday RSI edged higher and surpassed 45.
Resistance levels: 0.6356 0.6388 0.6445 (4H chart)
Support levels: 0.6288 0.6285 0.6272 (4H chart)
GOLD
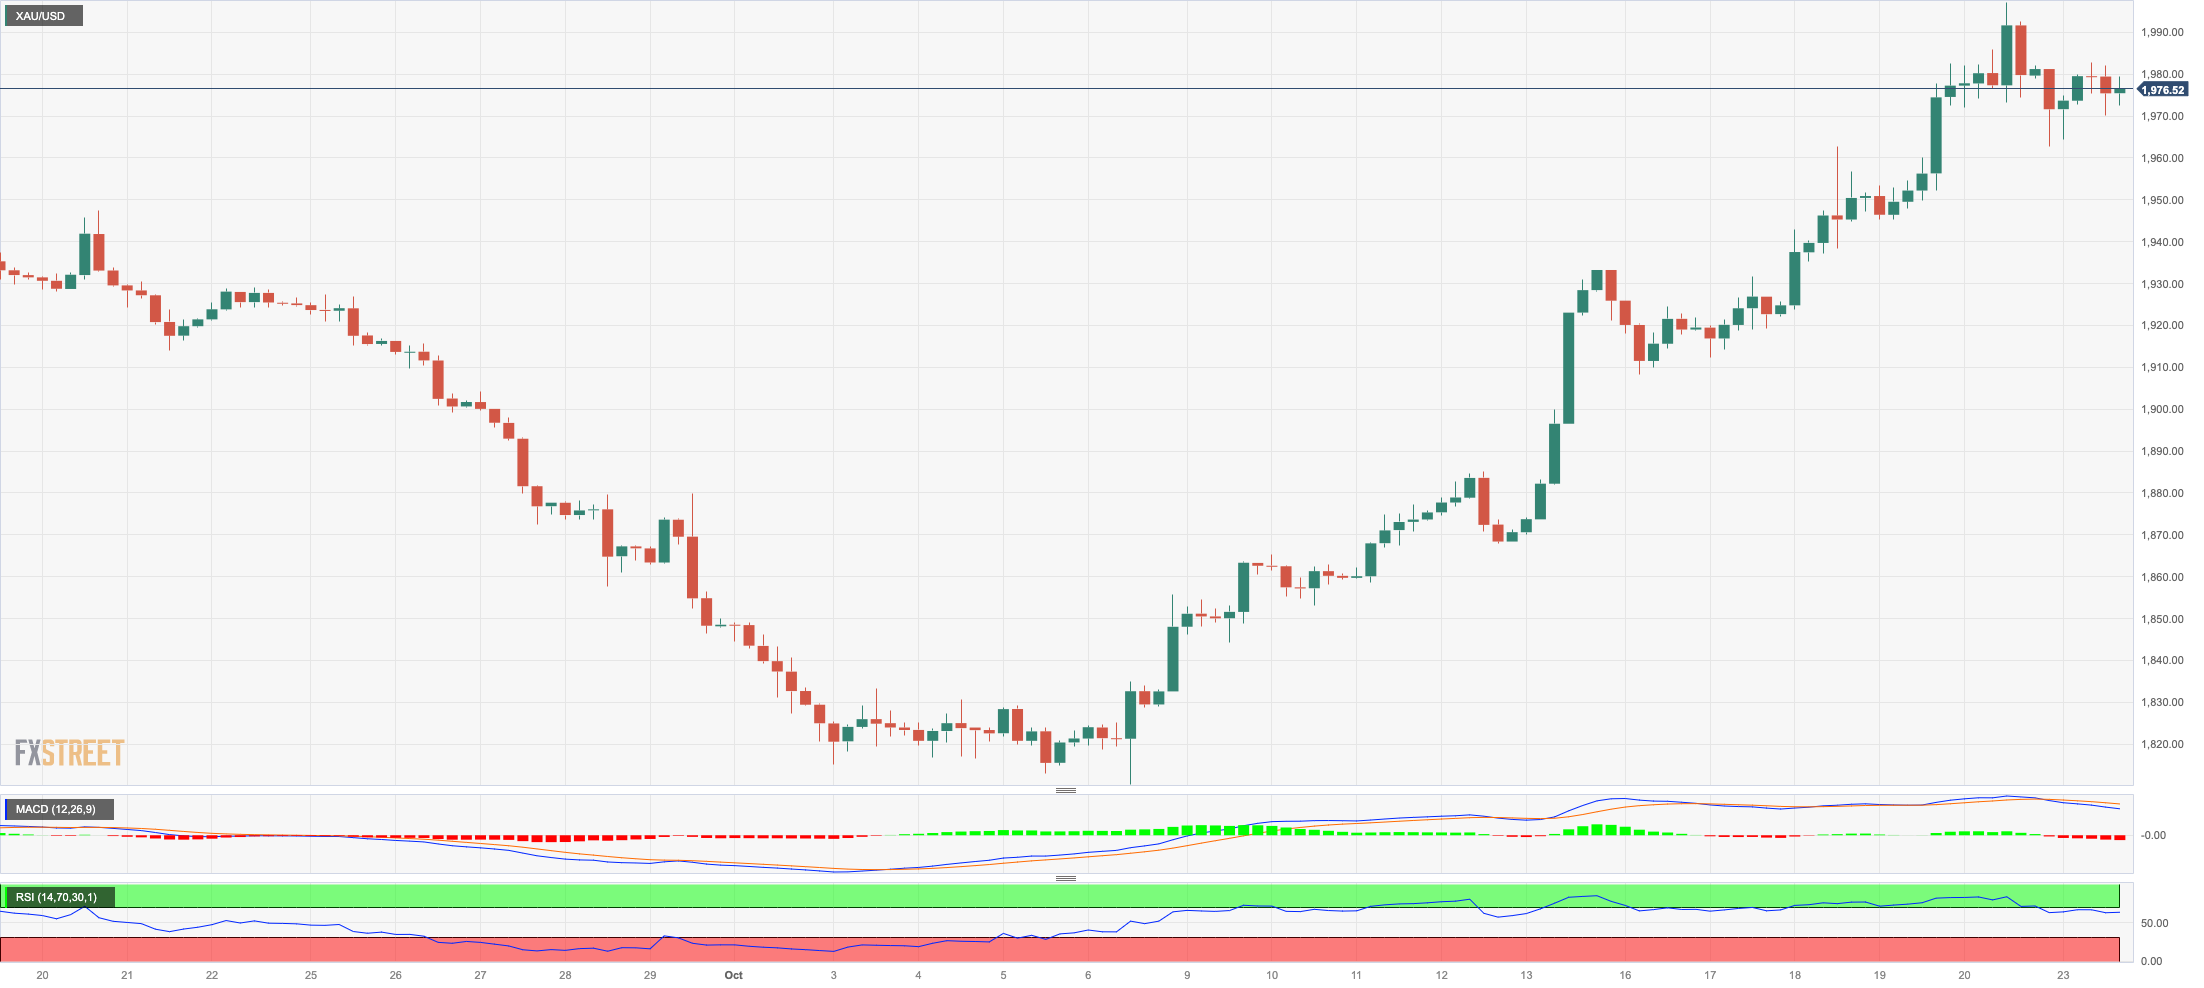
Gold prices traded on the defensive and halted a four-session positive streak at the beginning of the week.
Easing geopolitical concerns seem to have removed some strength from the recent rally in the yellow metal, which extended its rejection from Friday’s peaks in levels just shy of the critical $2000 mark per troy ounce.
The corrective decline in the precious metal came despite the pronounced sell-off in the greenback and some recovery in the US bond markets, particularly in the belly and the long end of the yield curve.
Gold prices should now aim for the critical $2000 milestone. The 2023 high of $2067 (May 4) may be challenged from here, followed by the 2022 top of $2070 (March 8) and the all-time peak of $2075 (August 7, 2020). On the contrary, the 200-day SMA at $1931 provides immediate support, followed by the intermediate 55-day SMA at $1906 and the October low of $1810 (October 6). If the latter fails, the 2023 low of $1804 (February 28) might be put to the test before the critical support zone of $1800.
Resistance levels: $1997 $2022 $2048 (4H chart)
Support levels: $1964 $1908 $1867 (4H chart)
CRUDE WTI
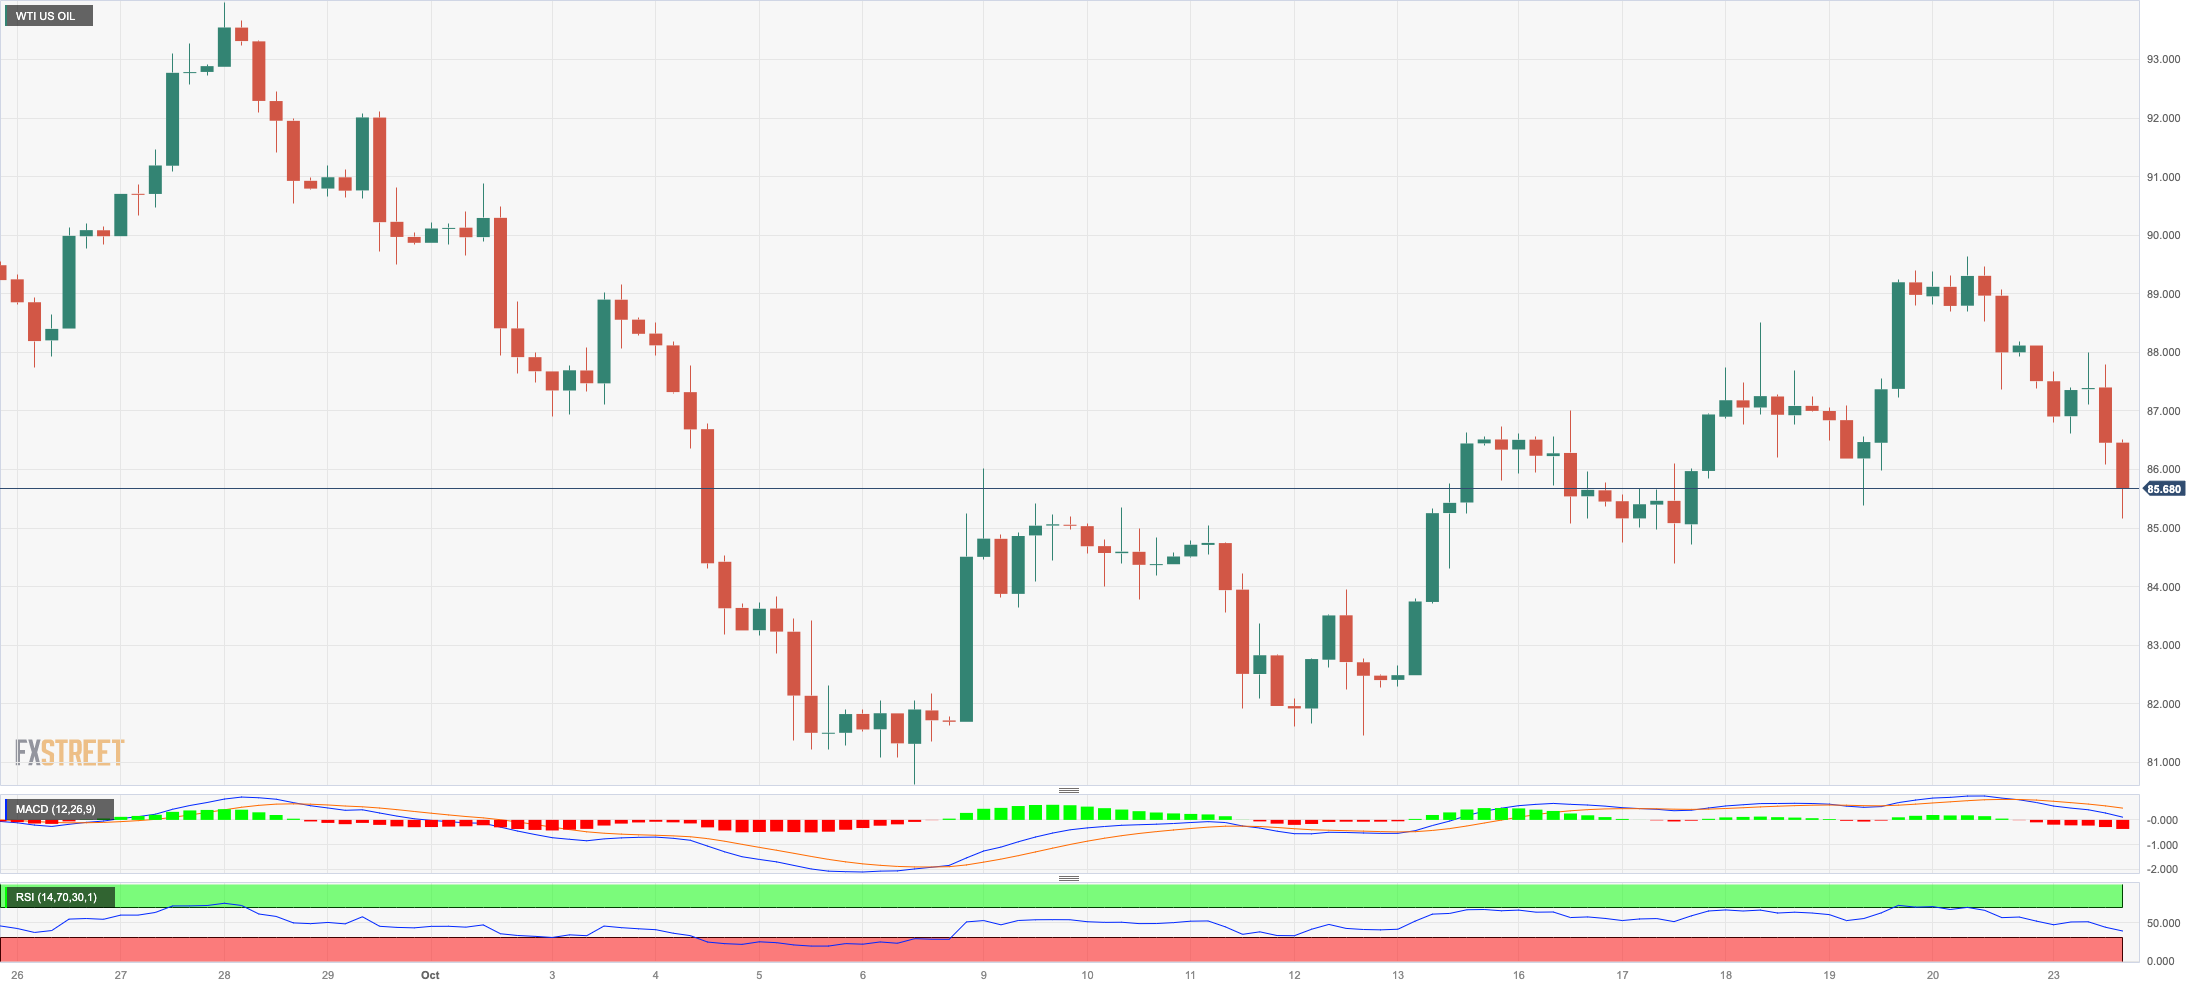
In line with the rest of the commodity complex and the precious metals’ galaxy, prices of WTI kicked off the new trading week well on the defensive on the back of rising hopes of a potential diplomatic solution to the crisis in the Middle East.
The daily decline in crude oil prices came despite the strong retracement in the dollar, at the time when traders continued to assess the recent suspension of US sanctions against Venezuelan crude oil, which could put around 200–300 kbpd back into the market.
As usual, the API (-4.383M barrels prev.) and the EIA (-4.491M barrels prev.) will report on US crude oil inventories for the week ended on October 20 on Tuesday and Wednesday, respectively.
The weekly high of $89.83 (October 18) is followed by the 2023 top of $94.99 (September 28) and the weekly peak of $97.65 (August 30, 2022), all ahead of the psychological $100.00 threshold per barrel. In contrast, a breakdown of the October low of $81.56 (October 6), could put the August low of $77.64 (August 24) to the test, that looks to be supported by the proximity of the key 200-SMA at $78.04, ahead of the weekly low of $73.89 (July 17), and the June low of $66.85 (June 12). Further down comes the 2023 low of $63.61 (May 4), before the key $60.00 per barrel.
Resistance levels: $88.21 $89.83 $91.84 (4H chart)
Support levels: $85.40 $82.27 $81.47 (4H chart)
GER40
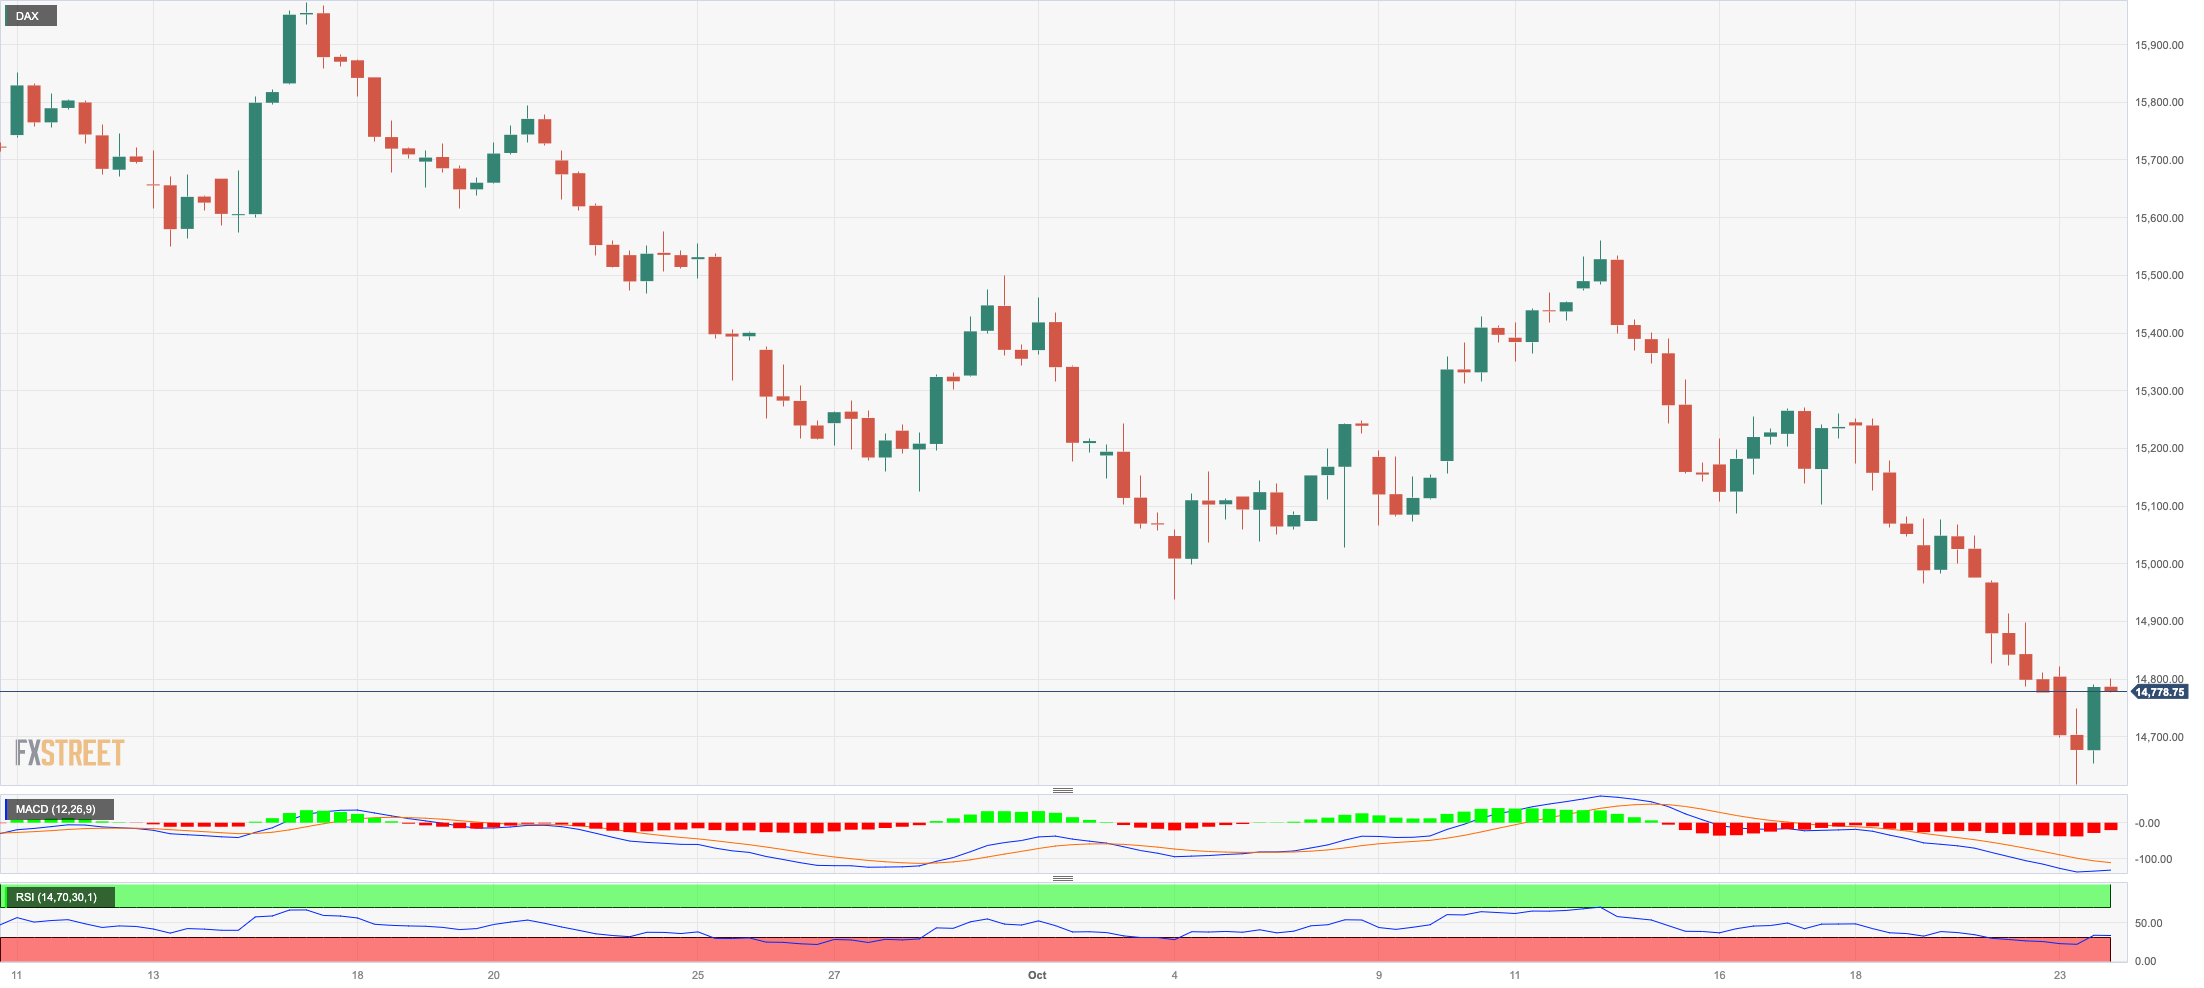
Following an earlier drop to new seven-month lows near the 14600 region, Germany’s reference DAX40 staged a marked comeback and ended the session around Friday’s closing levels near the 14800 zone.
The marginal uptick in the index came amidst the broad-based mixed performance of the rest of the European stock markets, all against the backdrop of easing geopolitical concerns, the resumption of the appetite for the risk complex, and rising expectations ahead of upcoming earnings reports and the ECB event (October 26).
If bears continue to press, the index may retest the March low of 14458 (March 20) before reaching the December 2022 lows of 13791 (December 20) and the 2022 low of 11862 (September 28). The initial barrier on the upward is found at the October high of 15575 (October 12), which comes just ahead of the key 200-day SMA of 15650. Further north, the September top of 15989 (September 15) may be observed, seconded by weekly peaks of 16042 (August 31) and 16060 (August 10). If the latter is broken, the index might return to its all-time high of 16528 (July 31). The daily RSI looked stable just below 32.
Best Performers: Covestro, Zalando SE, Heidelbergcement
Worst Performers: Merck, Sartorius AG VZO, Porsche
Resistance levels: 15187 15288 15575 (4H chart)
Support levels: 14630 14458 13791 (4H chart)
NASDAQ
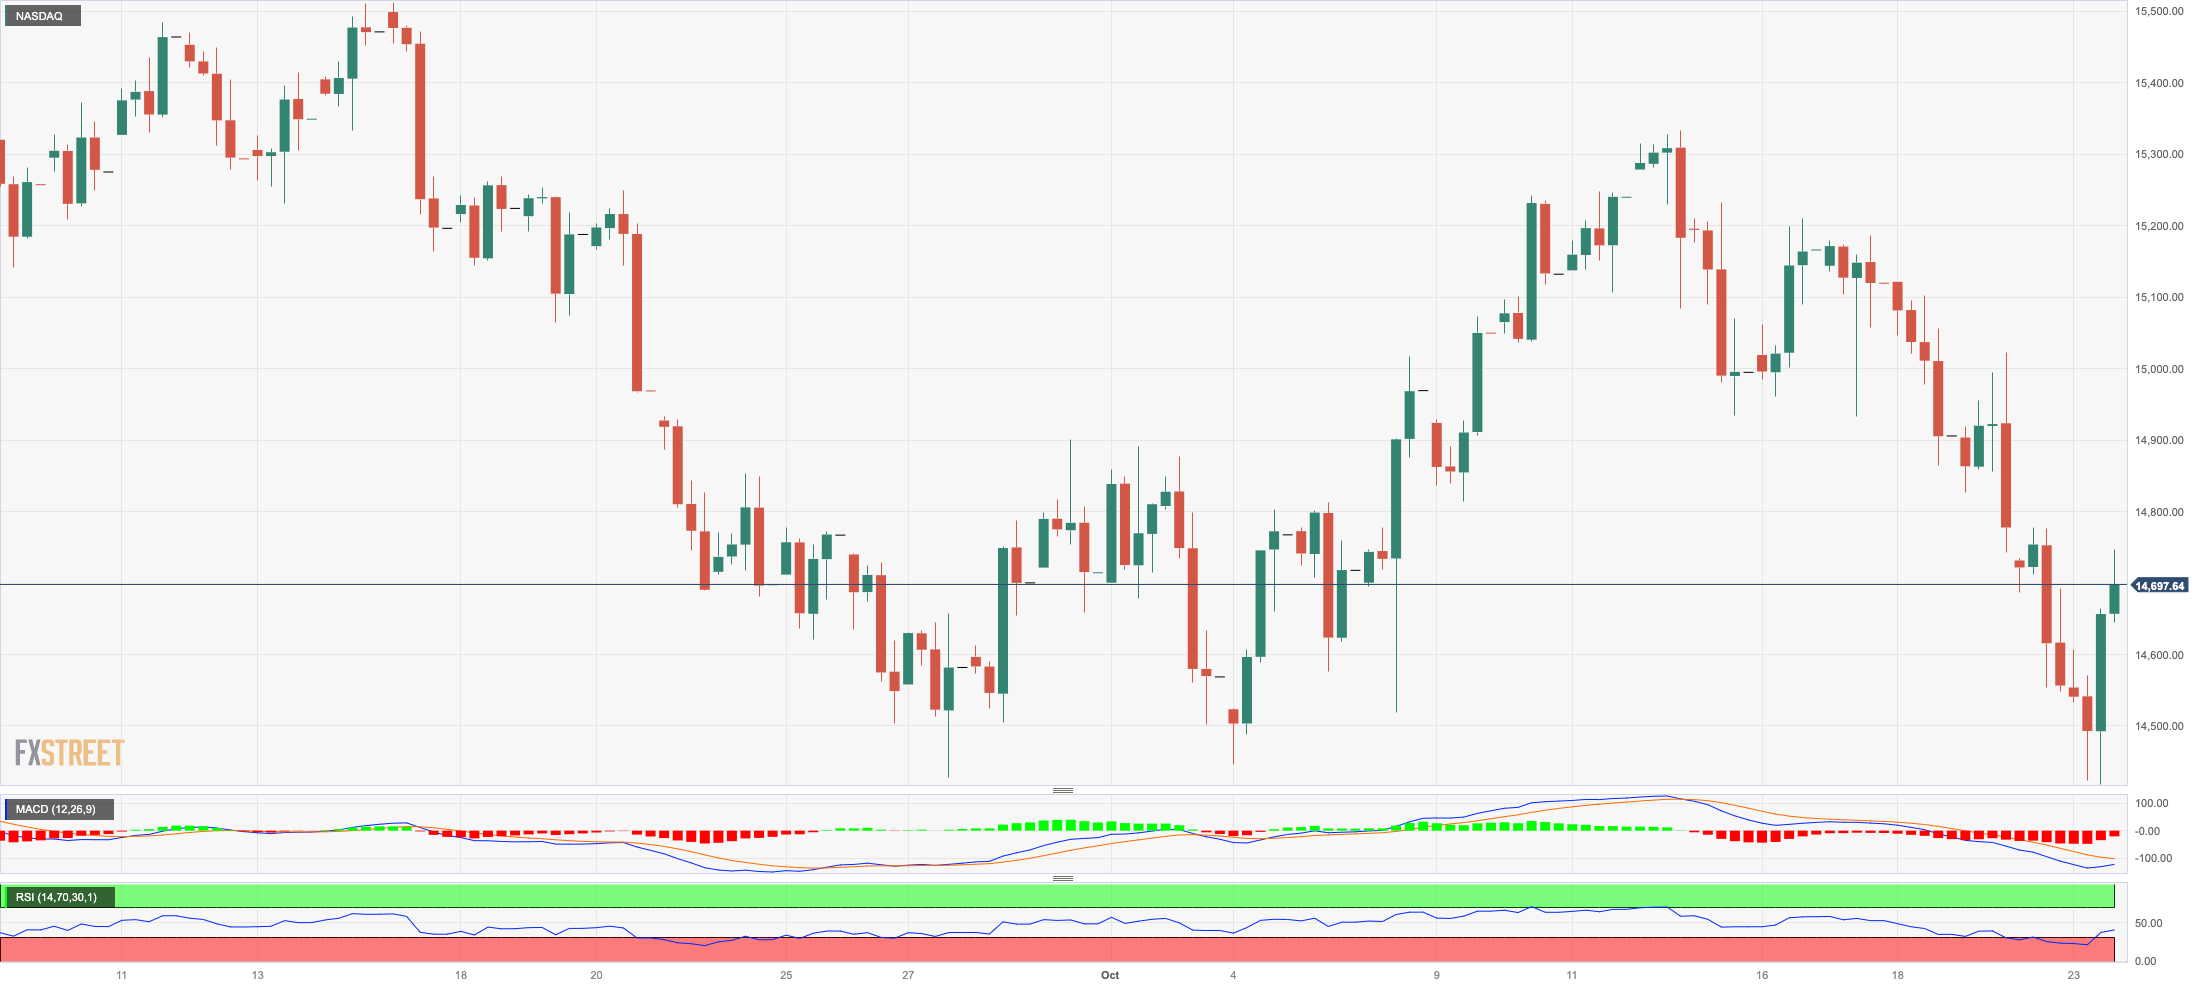
The performance of the US tech sector tracked by the Nasdaq 100 saw a noticeable rebound after hitting new monthly lows around 14400 at the beginning of the week.
Indeed, the index gathered extra pace in response to easing worries on the geopolitical front, while the knee-jerk in US yields in the 10-year/30-year segment and the sell-off in the greenback also added to the optimism on Monday.
In addition, investors’ hope of a positive corporate earnings report from key megacaps later in the week also added to the upside momentum in the index.
The Nasdaq 100 printed a new October low of 14419 on October 23. The loss of this level could spark a move to the weekly low of 14283 (June 7) followed by the 200-day SMA of 13864. Once this region is cleared, the market may return to the April low of 12724 (April 25), followed by the March bottom of 11695 (March 13), and finally the 2023 low of 10696 (January 6). On the flip side, the October top of 15333 (October 12) appears to be the next upward hurdle before the September peak of 15618 (September 1) and the weekly high of 15803 (July 31). A move beyond the latter exposes the 2023 top of 15932 (July 19), before reaching the round level of 16000. The daily RSI improved past 43.
Top Gainers: Walgreen Boots, Airbnb, NVIDIA
Top Losers: Moderna, O’Reilly Automotive, Biogen
Resistance levels: 15084 15333 15512 (4H chart)
Support levels: 14419 14283 13520 (4H chart)
DOW JONES
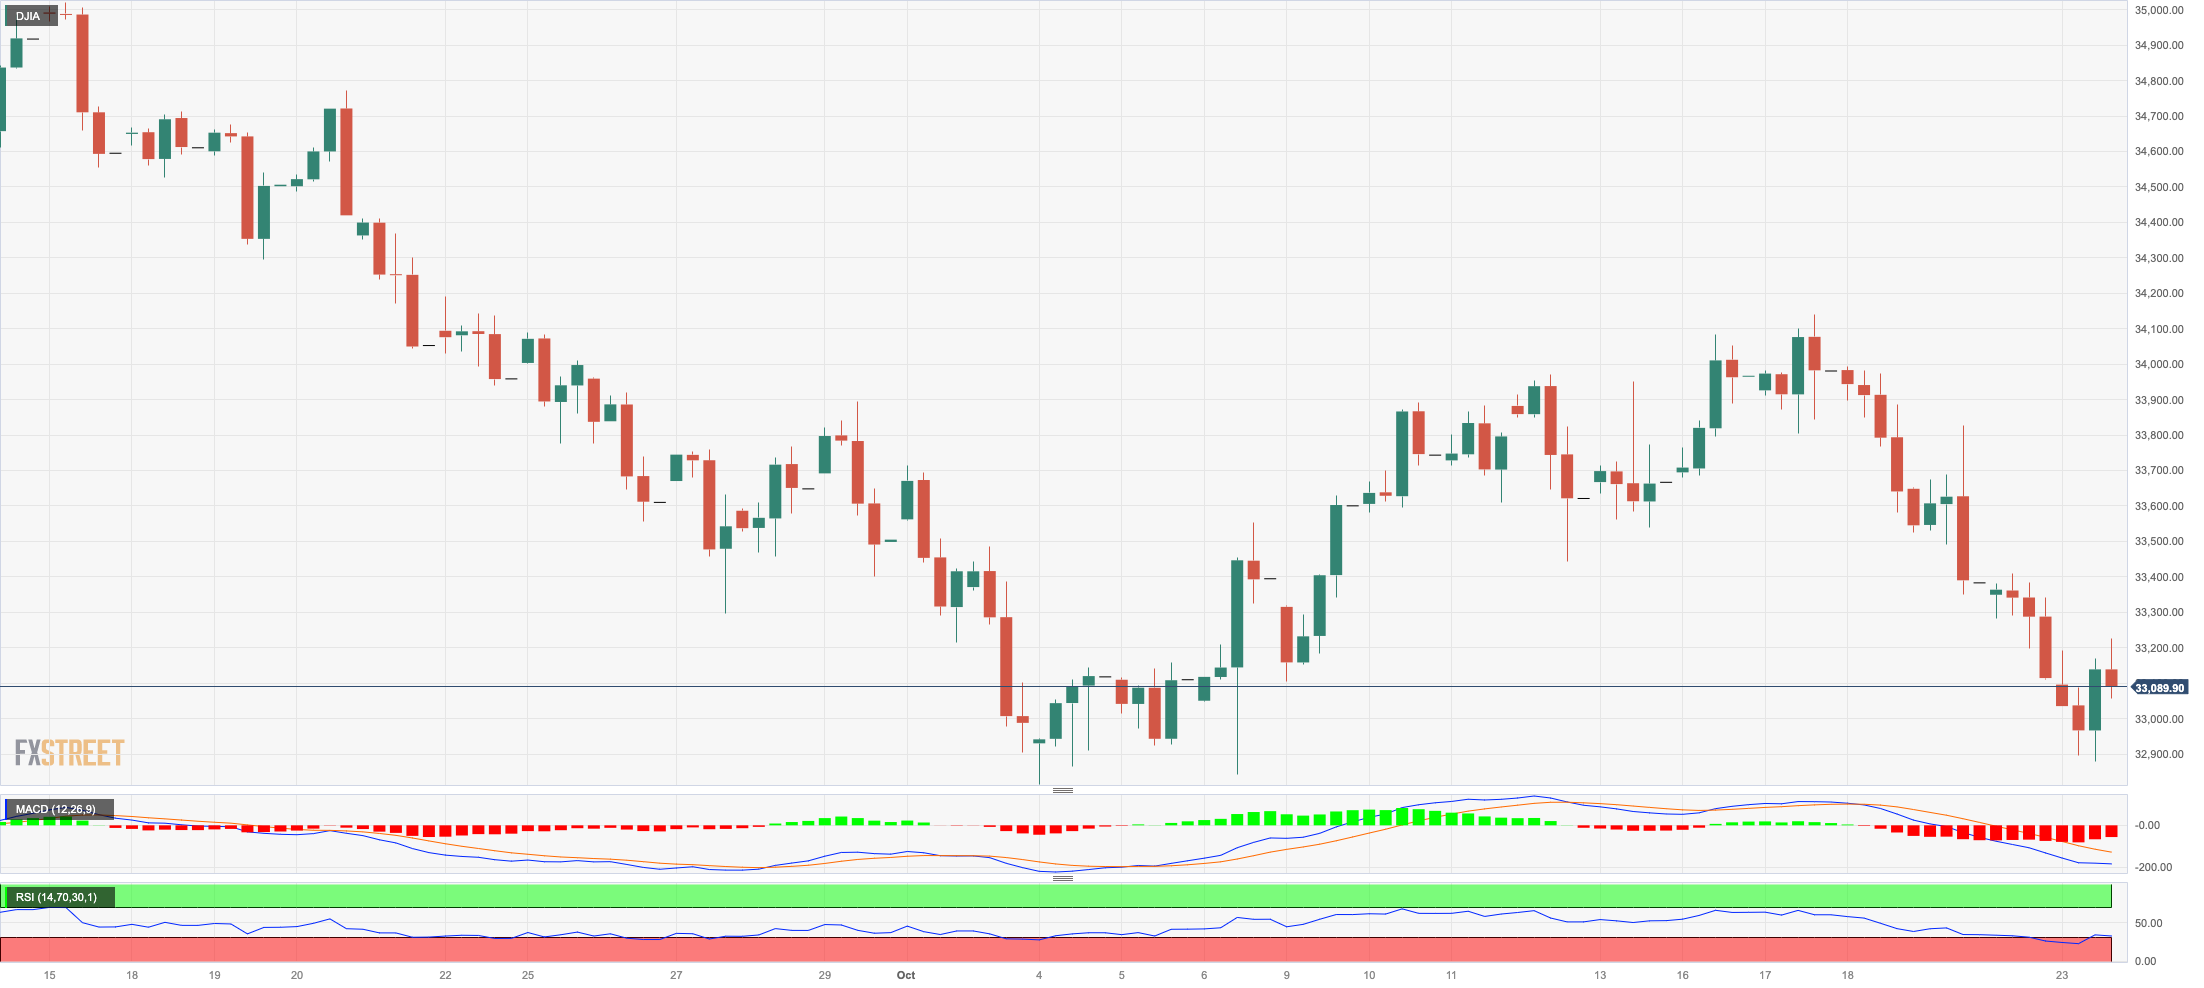
The key US benchmark Dow Jones started the week in an inconclusive fashion, briefly dropping to three-week lows in the sub-33000 region before reclaiming some ground lost.
In fact, market participants remained cautious in light of the events in the Middle East and ahead of the publication of the US inflation figures tracked by the PCE later in the week.
In addition, the knee-jerk in yields in the belly and the long end of the curve, plus the sell-off in the greenback, also seem to have limited the downside in the index on Monday.
All in all, the Dow Jones gained 0.03% to 33137, the S&P500 advanced 0.56% to 4247, and the tech-heavy Nasdaq Composite rose 1.01% to 13113.
Further weakening may cause the Dow Jones to revisit the October low of 32846 (October 6), which precedes the May low of 32586 (May 25) and the 2023 low of 31429 (March 15). However, the next up obstacle is the crucial 200-day SMA at 33830, and a break above here has the potential to trigger more gains to the October high of 34147 (October 17), which is just ahead of the intermediate 55-day and 100-day SMAs at 34242 and 34320, respectively. North of here is the September high of 34977 (September 14), followed by the weekly top of 35070 (August 31) and the 2023 peak of 35679 (August 1). If the latter is exceeded, the 2022 high of 35824 (February 9th) will be reached. The everyday RSI rose marginally to 36.
Top Performers: Walgreen Boots, American Express, Microsoft
Worst Performers: Chevron, Amgen, Travelers
Resistance levels: 34147 34323 34977 (4H chart)
Support levels: 32892 32846 32586 (4H chart)
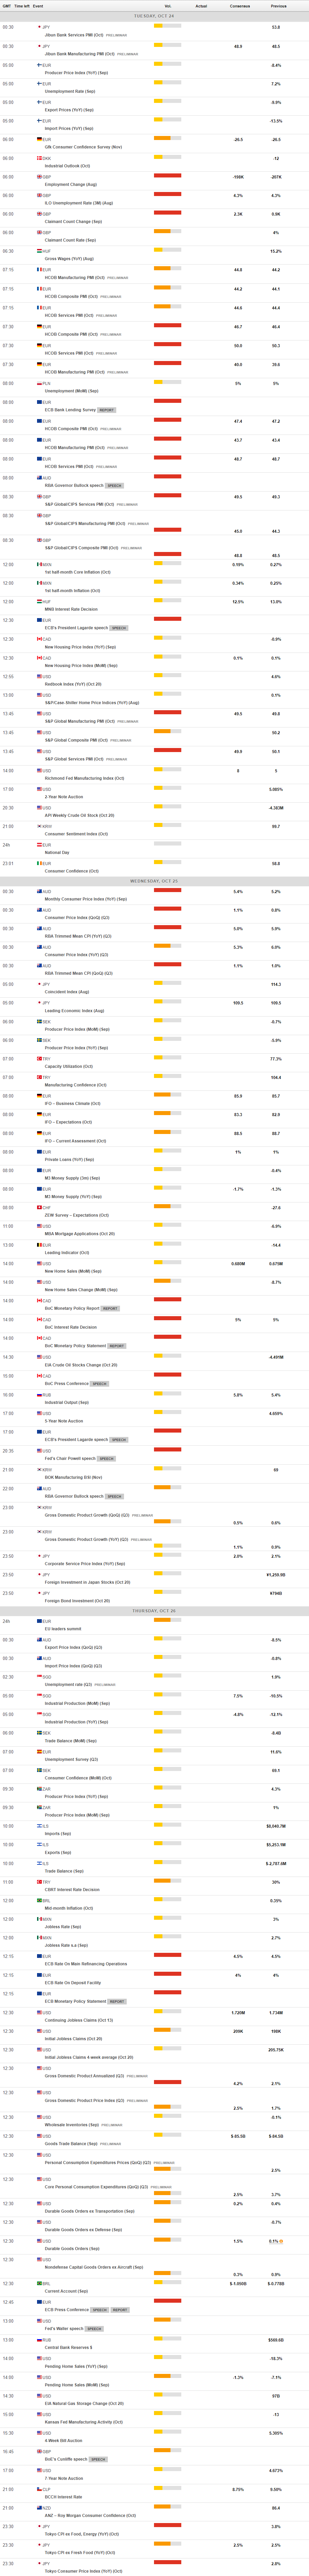
MACROECONOMIC EVENTS
All Information & Updates provided by:

All information relating to the financial markets available on this page has been prepared and issued by FXStreet (Forexstreet SL, Spain, Reg: B62498233) on the basis of publicly available information and all information believed to be reliable and does not conflict with Kuwaiti local laws, and all necessary care has been taken to before the company to ensure that the facts mentioned are correct from the source.
NCM Investment nor any of its directors or employees shall in any way be held responsible for the contents of this news, and the information contained on this page is intended only to provide clients with publicly available information and should not be construed as investment advice, report or analysis and/or constitute an offer or invitation to buy or sell financial instruments of any kind.
RISK WARNING: Forex and CFDs are highly risky leveraged products, as losses can exceed deposits. Please ensure you understand all the risks and take independent advice if necessary. NCM will segregate the clients based on the criteria of the regulator and its bylaws. NCM does not provide any advisory service; the material published does not constitute advice or a recommendation for a transaction in any financial instrument. NCM accepts no responsibility for any use of the content presented and any consequences of that use. Anyone acting on the information provided does so at their own risk.