
- Contact Us:
-

-

-

-


Daily Market Updates
25 Oct 2023
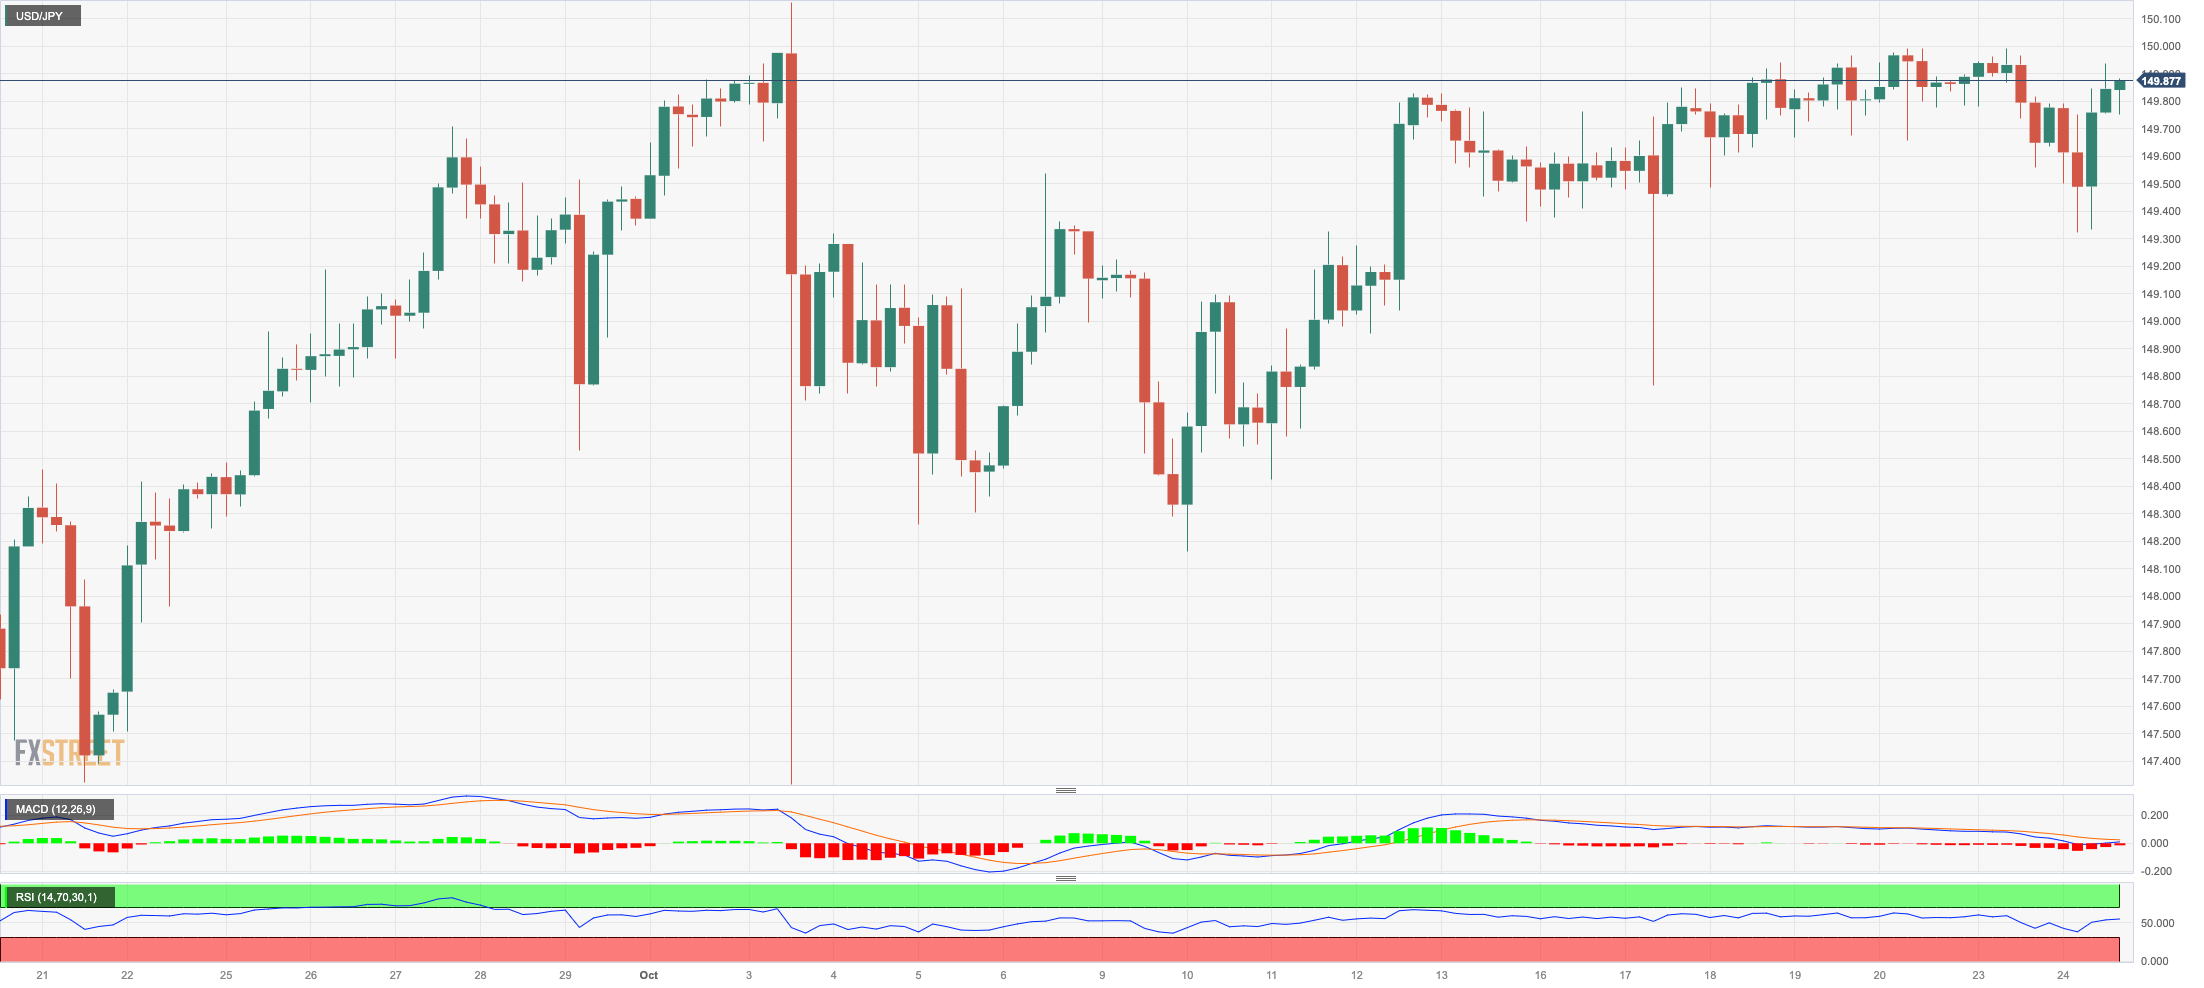
USDJPY
USD/JPY extended the consolidative phase in the upper end of the range and was always at shouting distance from the critical hurdle at 150.00 the figure on Tuesday.
The marginal uptick in the pair was accompanied by a sharp pick-up in the buying interest around the greenback, while US yields lost momentum in the belly and the long end of the curve vs. a marginal drop in the Japanese JGB 10-year yields.
Regarding the BoJ and its upcoming meeting, investors contemplate the possibility that the central bank might tweak its YCC programme.
In Japan, the preliminary Jibun Bank Manufacturing PMI held steady at 48.5 in October and eased to 51.1 when it came to the Services PMI.
Further USD/JPY advances aim for the 2023 high of 150.16 (October 3), followed by the 2022 top of 151.94 (October 21). In contrast, the October low of 148.16 (October 10) emerges as the immediate contention ahead of the transitory 55-day SMA at 147.64, and the weekly low at 145.89 (September 11). The intermediate 100-day SMA at 144.91 is south of here, before the September low of 144.43 (September 1) and the August low of 141.50 (August 7). Once passed, the pair may test the 200-day SMA at 139.54, ahead of the July low of 137.23 (July 14). The daily RSI gyrated around 60.
Resistance levels: 149.99 150.16 151.94 (4H chart)
Support levels: 149.32 148.73 148.16 (4H chart)
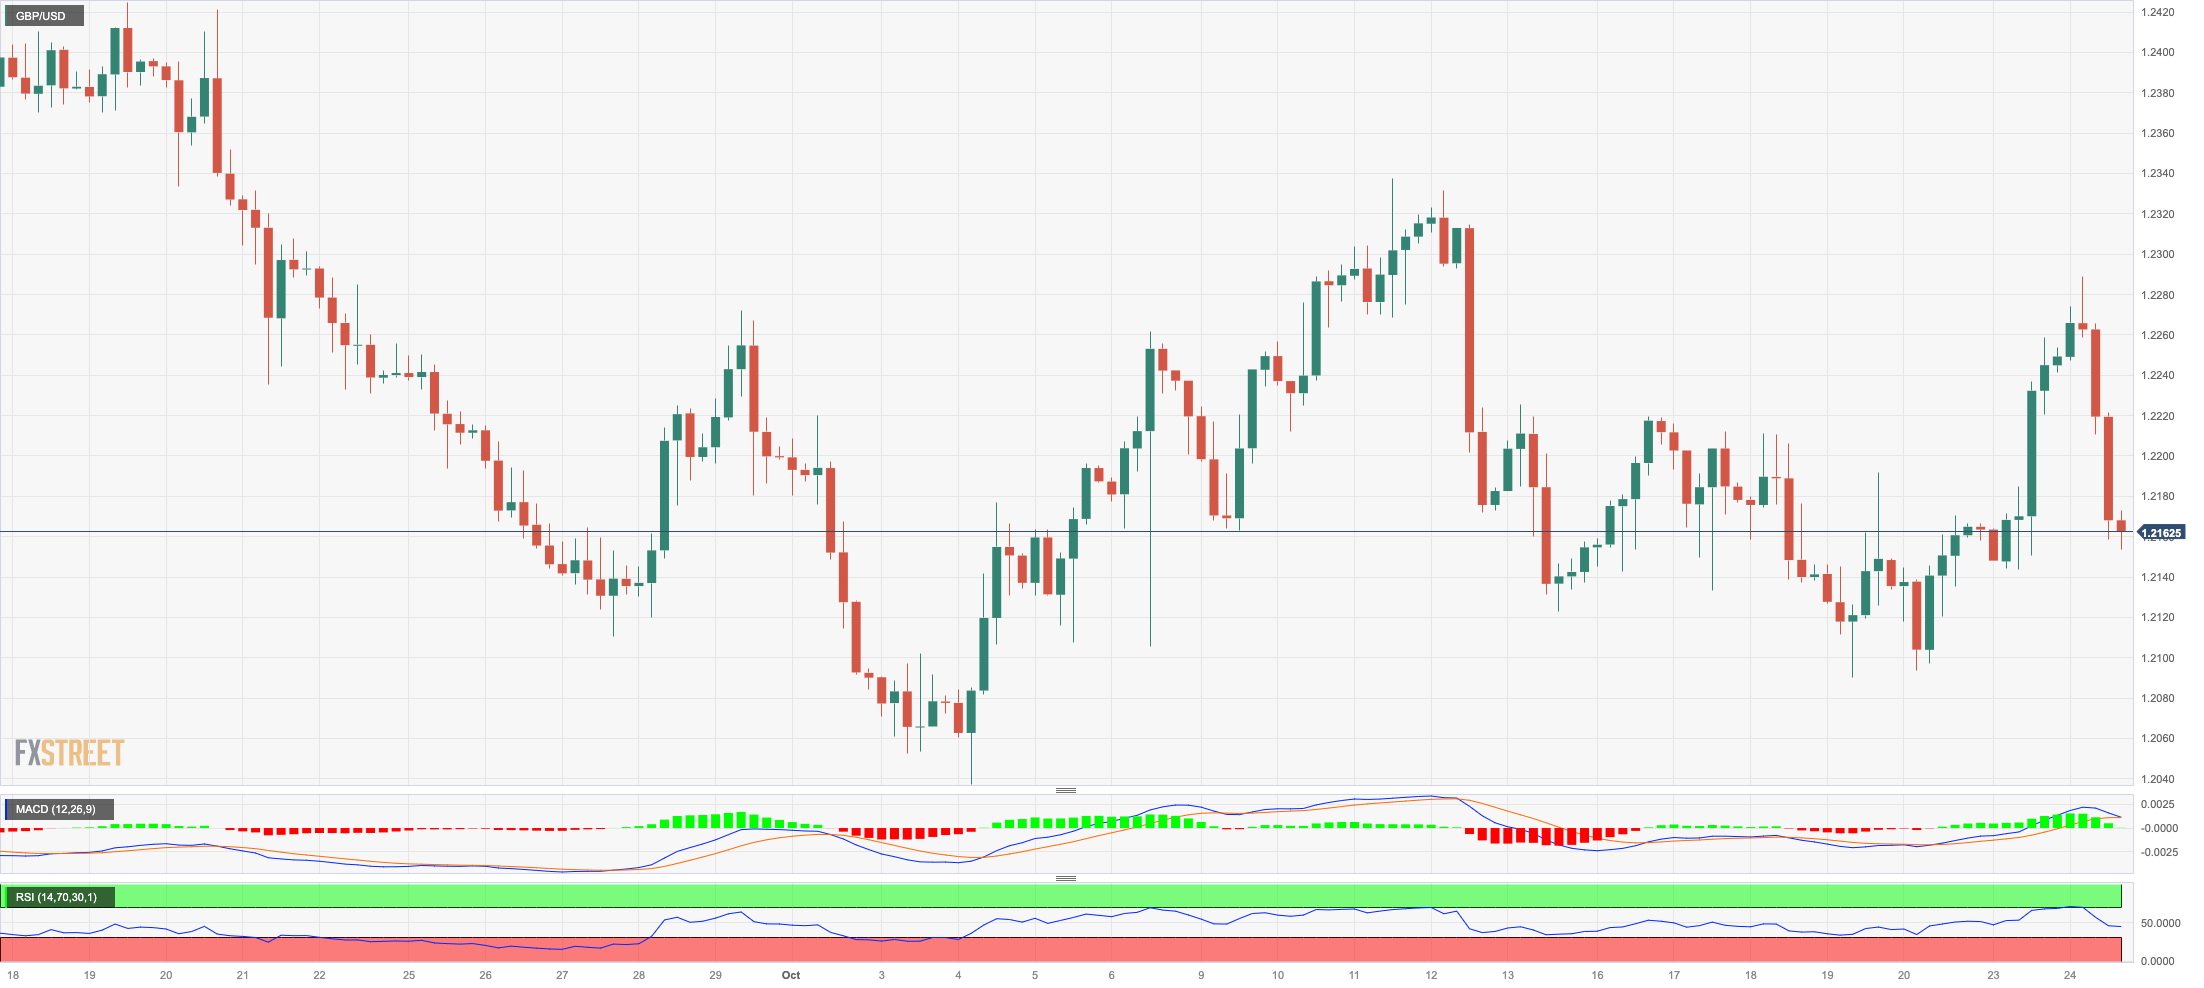
GBPUSD
After hitting multi-day highs just below the 1.2300 hurdle, GBP/USD sparked a pronounced corrective pullback to the mid-1.2100s in response to an equally robust rebound in the greenback on Tuesday.
In fact, the demand for the US dollar accelerated in the wake of poor prints from the manufacturing and services PMIs in the euro area, which in turn forced the rest of the risk-associated assets to give away most of the early advance.
In the UK, advanced PMI prints did not help the British pound either, after the Manufacturing reading is expected at 45.2 in October and 49.2 when it comes to the Services gauge.
The resumption of the selling bias could force GBP/USD to revisit the weekly low of 1.2089 (October 19) ahead of the October low of 1.2037 (October 3). The breakdown of the latter could pave the way for a move to the psychologically crucial 1.2000 level prior to the 2023 low at 1.1802 (March 8). On the flip side, the October high of 1.2337 (October 11) is the immediate resistance level for Cable, seconded by the 200-day SMA at 1.2441. Beyond this level, the weekly top of 1.2548 (September 11) appears, ahead of the transitory 100-day SMA at 1.2581. The weekly peaks of 1.2746 (August 30) comes next before 1.2818 (August 10) and 1.2995 (July 27), all of which anticipate the crucial mark of 1.3000. The daily RSI slipped back to the 43 area.
Resistance levels: 1.2288 1.2337 1.2421 (4H chart)
Support levels: 1.2089 1.2037 1.1802 (4H chart)
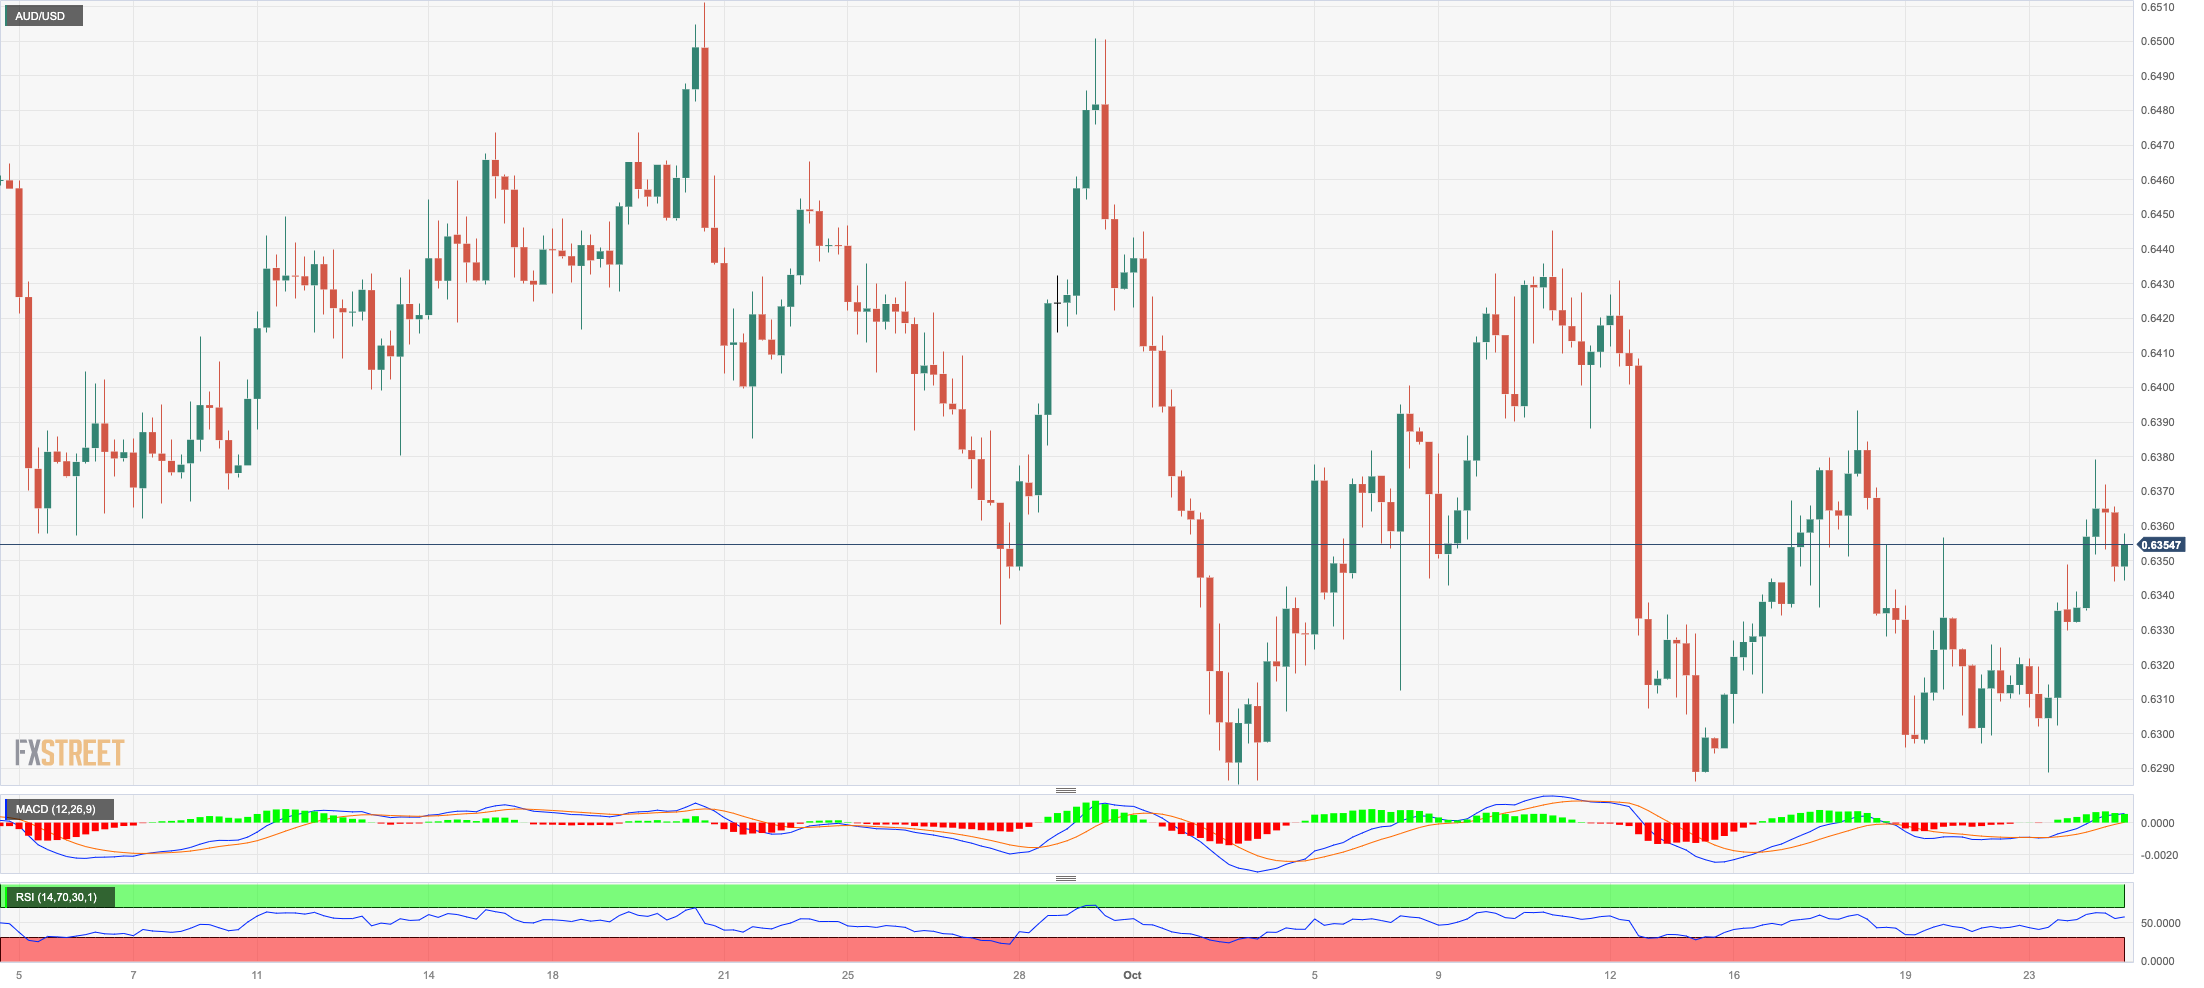
AUDUSD
Despite the sharp rebound in the greenback, AUD/USD managed to clinch its second consecutive session of gains on Tuesday, extending the optimism seen at the beginning of the week.
The decent advance in the Aussie dollar also came in spite of the mixed performance of the commodity complex, while the hawkish tone from RBA’s Governor M. Bullock seems to have lent support to the currency instead.
On the latter, Bullock reiterated that the bank remains ready to tighten its policy further in case the outlook for inflation is revised up. She also added that inflation could return to the bank’s goal at a slower pace than anticipated.
In Oz, the flash Judo Bank Manufacturing PMI came in at 48.0, and the Services PMI is seen at 47.6 in October; both prints are weaker than the previous month’s readings.
If the selling pressure returns, the AUD/USD may reach the 2023 low of 0.6285 (October 3) before testing the November 2022 bottom of 0.6272 (November 7) and the 2022 low of 0.6179 (October 13). On the upside, the immediate resistance is the weekly high of 0.6445 (October 11), followed by another weekly top of 0.6522 (August 30) and the temporary 100-day SMA at 0.6545. A breakout of the latter might reintroduce a challenge of the weekly peak of 0.6616 (August 10) prior to the 200-day SMA at 0.6646. Further gains may push the pair to its July high of 0.6894 (July 14), then to the June top of 0.6899 (June 16), and eventually to the critical 0.7000 threshold. The daily RSI increased past the 66 yardstick.
Resistance levels: 0.6379 0.6388 0.6445 (4H chart)
Support levels: 0.6288 0.6285 0.6272 (4H chart)
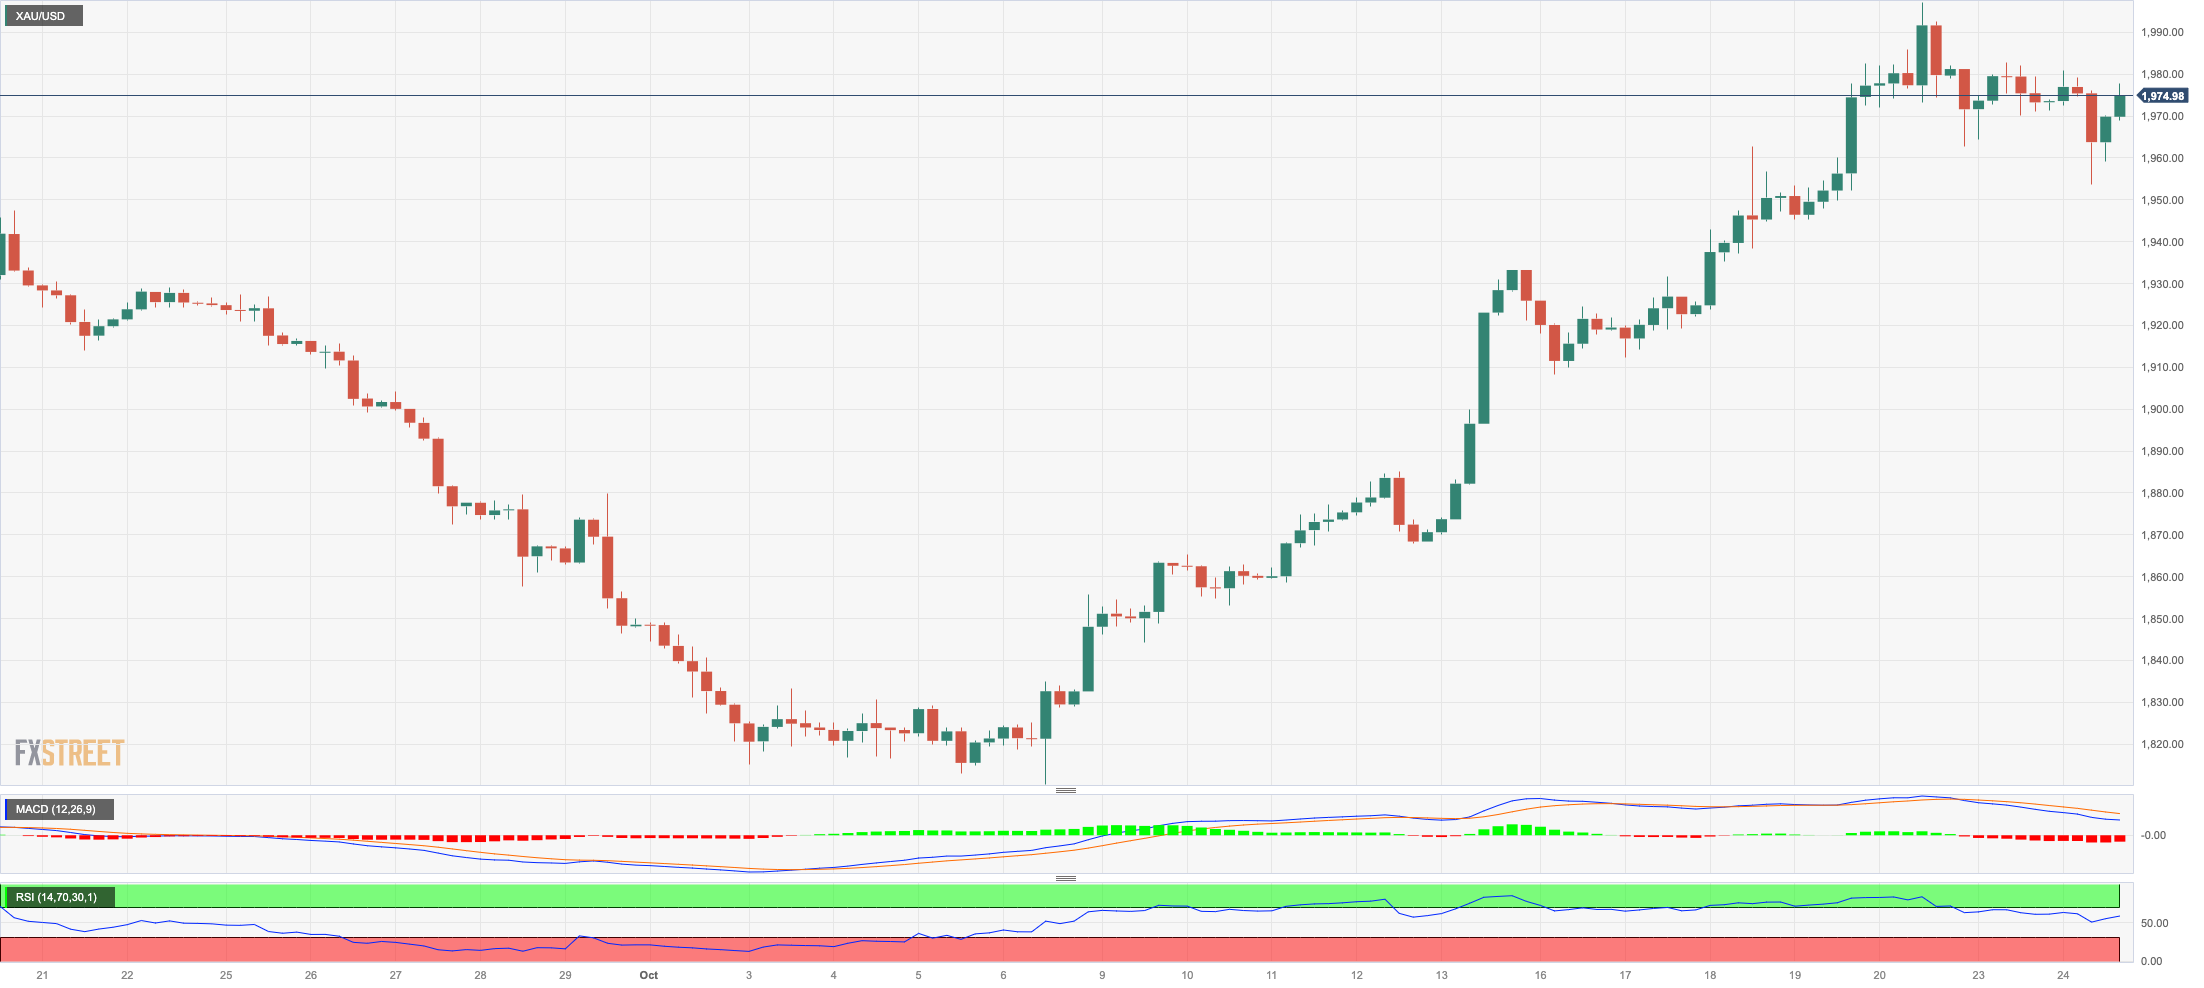
GOLD
Prices of the troy ounce of the yellow metal managed to leave behind an initial drop to the $1950 region, regaining the $1970 zone towards the end of the NA session on Tuesday.
The irresolute performance of the precious metal came amidst an intense move higher in the greenback and declining yields in the belly and the long end of the curve, while traders kept assessing news coming from the Middle East crisis.
Gold prices should now strive for the important $2000 mark. From here, the 2023 peak of $2067 (May 4) might be challenged, followed by the 2022 high of $2070 (March 8) and the all-time top of $2075 (August 7, 2020). Just the opposite, the 200-day SMA at $1931 provides immediate support, seconded by the intermediate 55-day SMA at $1907 and the October low of $1810 (October 6). If the latter fails, the 2023 low of $1804 (February 28) may be tested before the key support zone of $1800 is reached.
Resistance levels: $1997 $2022 $2048 (4H chart)
Support levels: $1953 $1908 $1867 (4H chart)
CRUDE WTI
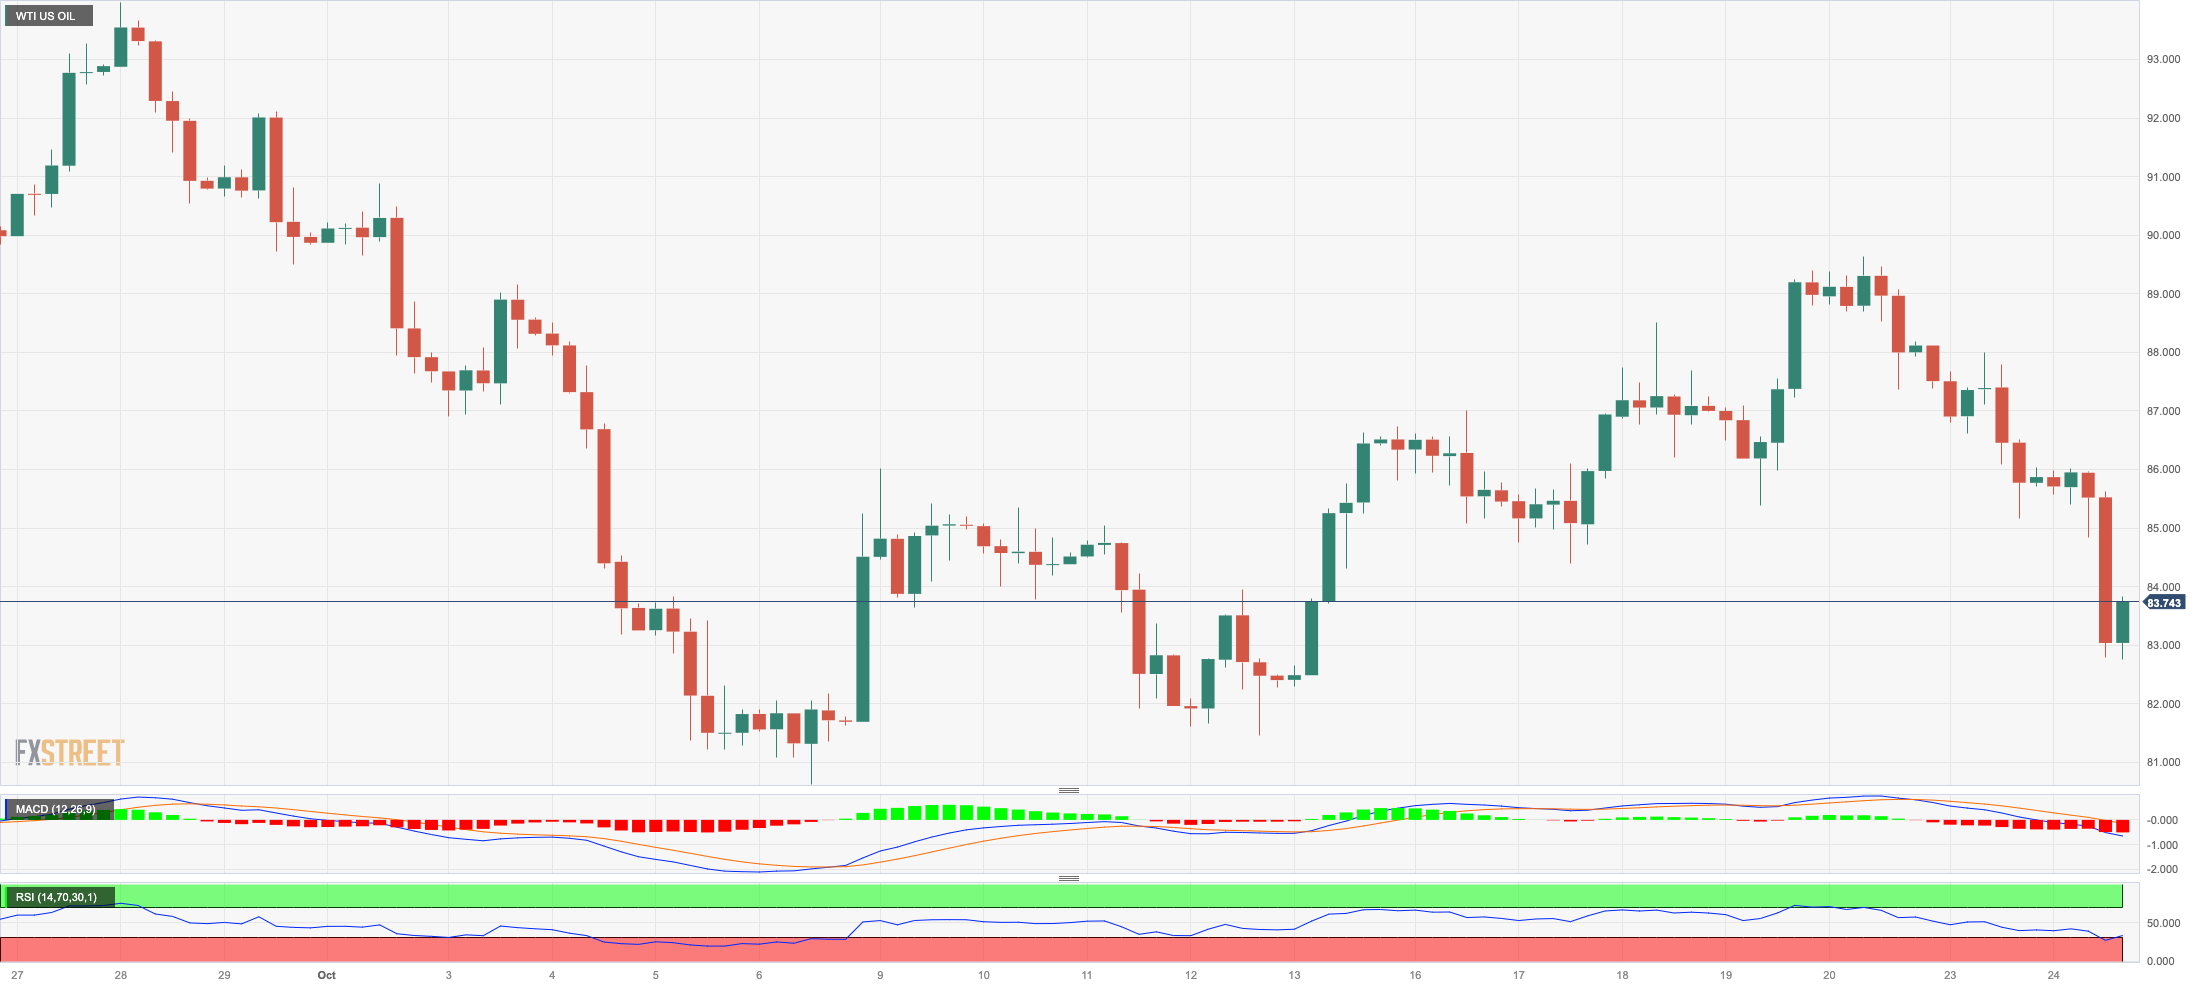
WTI prices dropped for the third session in a row, printing new two-week lows in the $83.00 region per barrel on turnaround Tuesday.
In fact, the bearish tone prevailed for yet another session among traders in response to another set of disheartening data releases in the euro area that did nothing but reinforce the perception that the region is headed towards a recession.
In addition, further news suggesting the likelihood that an extension of the Middle East crisis could be averted also added to the ongoing weakness around the commodity.
Later in the session, the API will publish its weekly report on US crude oil inventories for the week ended on October 20 (-4.383M barrels prev.), ahead of the EIA’s report on Wednesday (-4.491M barrels prev.).
A deeper pullback in WTI could see the October low of $81.56 (October 6) revisited ahead of the critical 200-day SMA at $78.06 and the August low of $77.64 (August 24). The collapse of this zone might put the weekly low of $73.89 (July 17) to the test prior to the key $70.00 mark per barrel. The loss of this key level exposes the June low of $66.85 (June 12) ahead of the 2023 low of $63.61 (May 4) and the critical $60.00 mark per barrel. On the flip side, the weekly high of $89.83 (October 18) is followed by the 2023 top of $94.99 (September 28). Further north emerges another weekly peak of $97.65 (August 30, 2022), just before the psychological $100.00 mark per barrel.
Resistance levels: $88.15 $89.83 $91.84 (4H chart)
Support levels: $82.99 $82.27 $81.47 (4H chart)
GER40
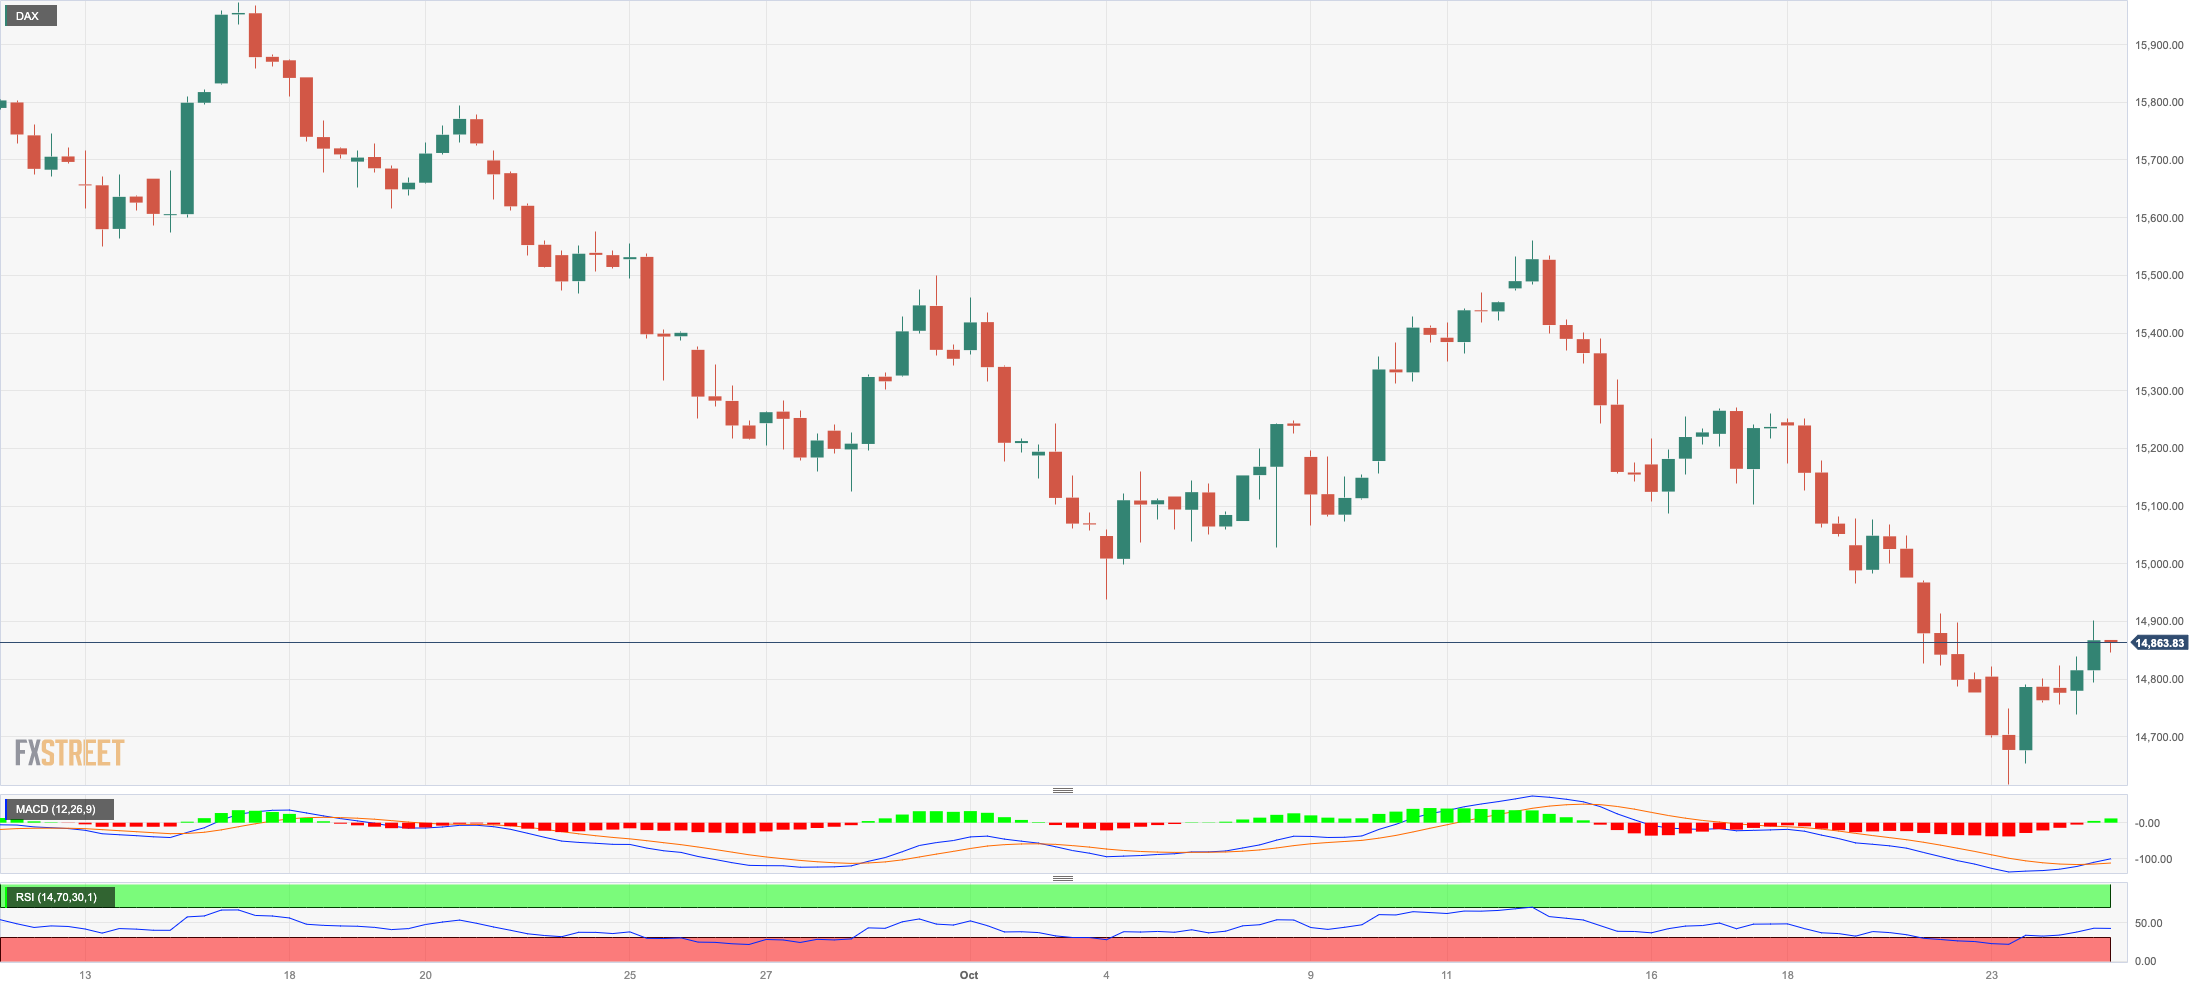
Germany’s reference index DAX40 added to Monday’s decent advance and approached the key 15000 region on Tuesday.
Equities managed to extend the rebound from seven-month lows recorded at the beginning of the week despite poor readings from advanced PMIs in the region and somewhat alleviated concerns around the Middle East conflict.
Moving forward, investors are expected to closely follow the release of corporate earnings reports, while some cautiousness is predicted to kick in ahead of the ECB gathering on October 26.
If bears keep pushing, the index may retest the March low of 14458 (March 20) before approaching the December 2022 low of 13791 (December 20) and the 2022 low of 11862 (September 28). The first upward obstacle is located at the October high of 15575 (October 12), which is just ahead of the important 200-day SMA of 15650. Further north, the September peak of 15989 (September 15) may be seen, followed by the weekly tops of 16042 (August 31) and 16060 (August 10). If this barrier is cleared, the index might recover to its all-time high of 16528 (July 31). The daily RSI improved past the 35 yardstick.
Best Performers: MTU Aero, RWE AG ST, Rheinmetall AG
Worst Performers: Commerzbank, Dr Ing hc F Porsche Prf, Deutsche Bank AG
Resistance levels: 15167 15288 15575 (4H chart)
Support levels: 14630 14458 13791 (4H chart)
NASDAQ
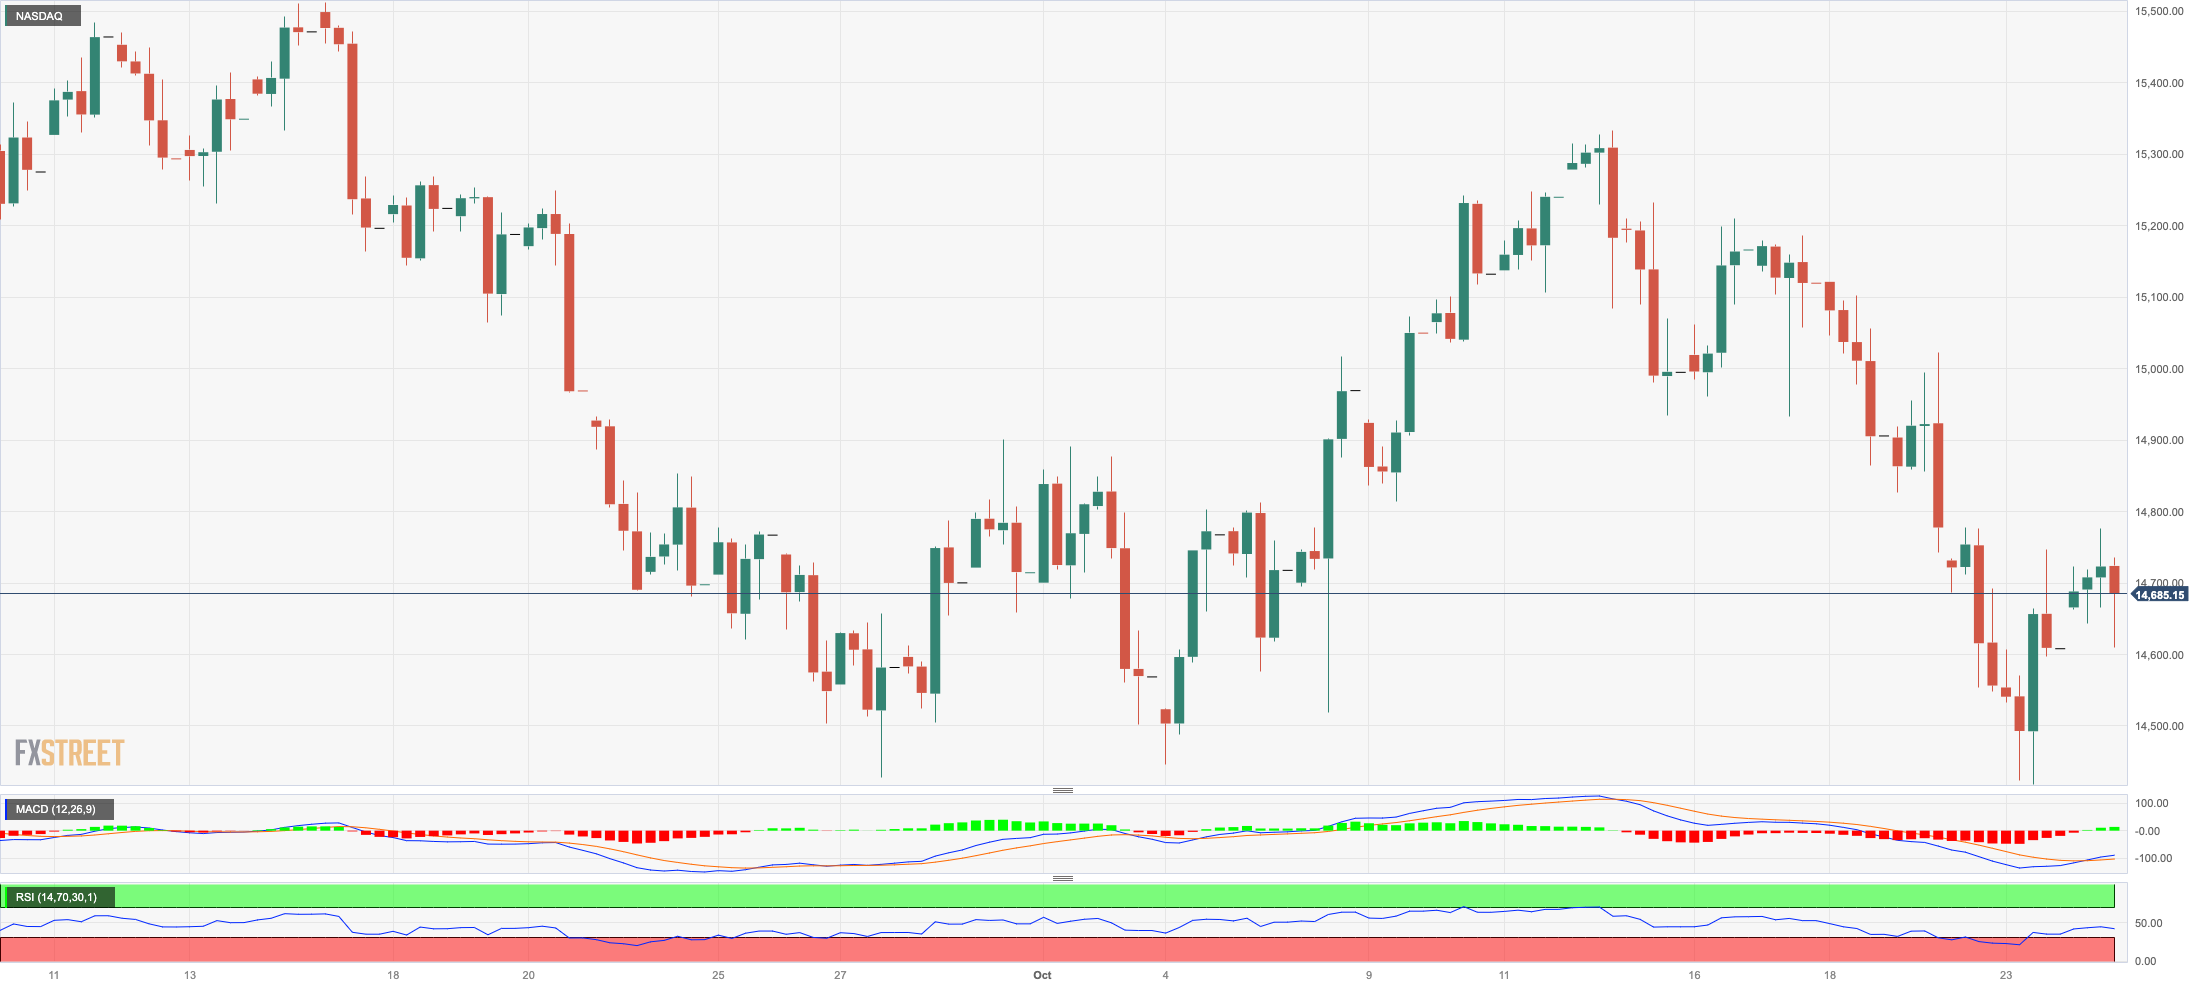
The key tech benchmark Nasdaq 100 added to Monday’s decent advance and flirted with the 14800 region, or three-day highs, on Tuesday.
The recovery in US bonds put yields in the 10-year/30-year tranche to the test on Tuesday, lending support to tech equities, which were also helped by easing geopolitical jitters.
In addition, investors remained optimistic ahead of the release of earnings reports from Microsoft and Alphabet in a week where corporate earnings reports are expected to take centre stage.
If sellers regain the initiative, the October low 14419 (October 23) should emerge as the immediate support for the Nasdaq 100. If this level is breached, the market may go to the weekly low of 14283 (June 7), followed by the 200-day SMA of 13881. Once this zone has been cleared, the market may return to the April low of 12724 (April 25), then to the March low of 11695 (March 13), and lastly to the 2023 low of 10696 (January 6). Having said that, the October peak of 15333 (October 12) looks to be the next upward resistance before the September top of 15618 (September 1) and the weekly high of 15803 (July 31). The trespass of the latter reveals the 2023 peak of 15932 (July 19), before reaching the round level of 16000. The RSI on the daily chart advanced to the 43 region.
Top Gainers: PDD Holdings DRC, MercadoLibre, PACCAR
Top Losers: Cadence Design, Illumina, Walgreen Boots
Resistance levels: 15088 15333 15512 (4H chart)
Support levels: 14419 14283 13520 (4H chart)
DOW JONES
US stock markets left behind part of the multi-session pullback on Tuesday, managing to advance modestly on the back of the sharp bounce in the greenback, mixed US yields, and mitigating geopolitical fears.
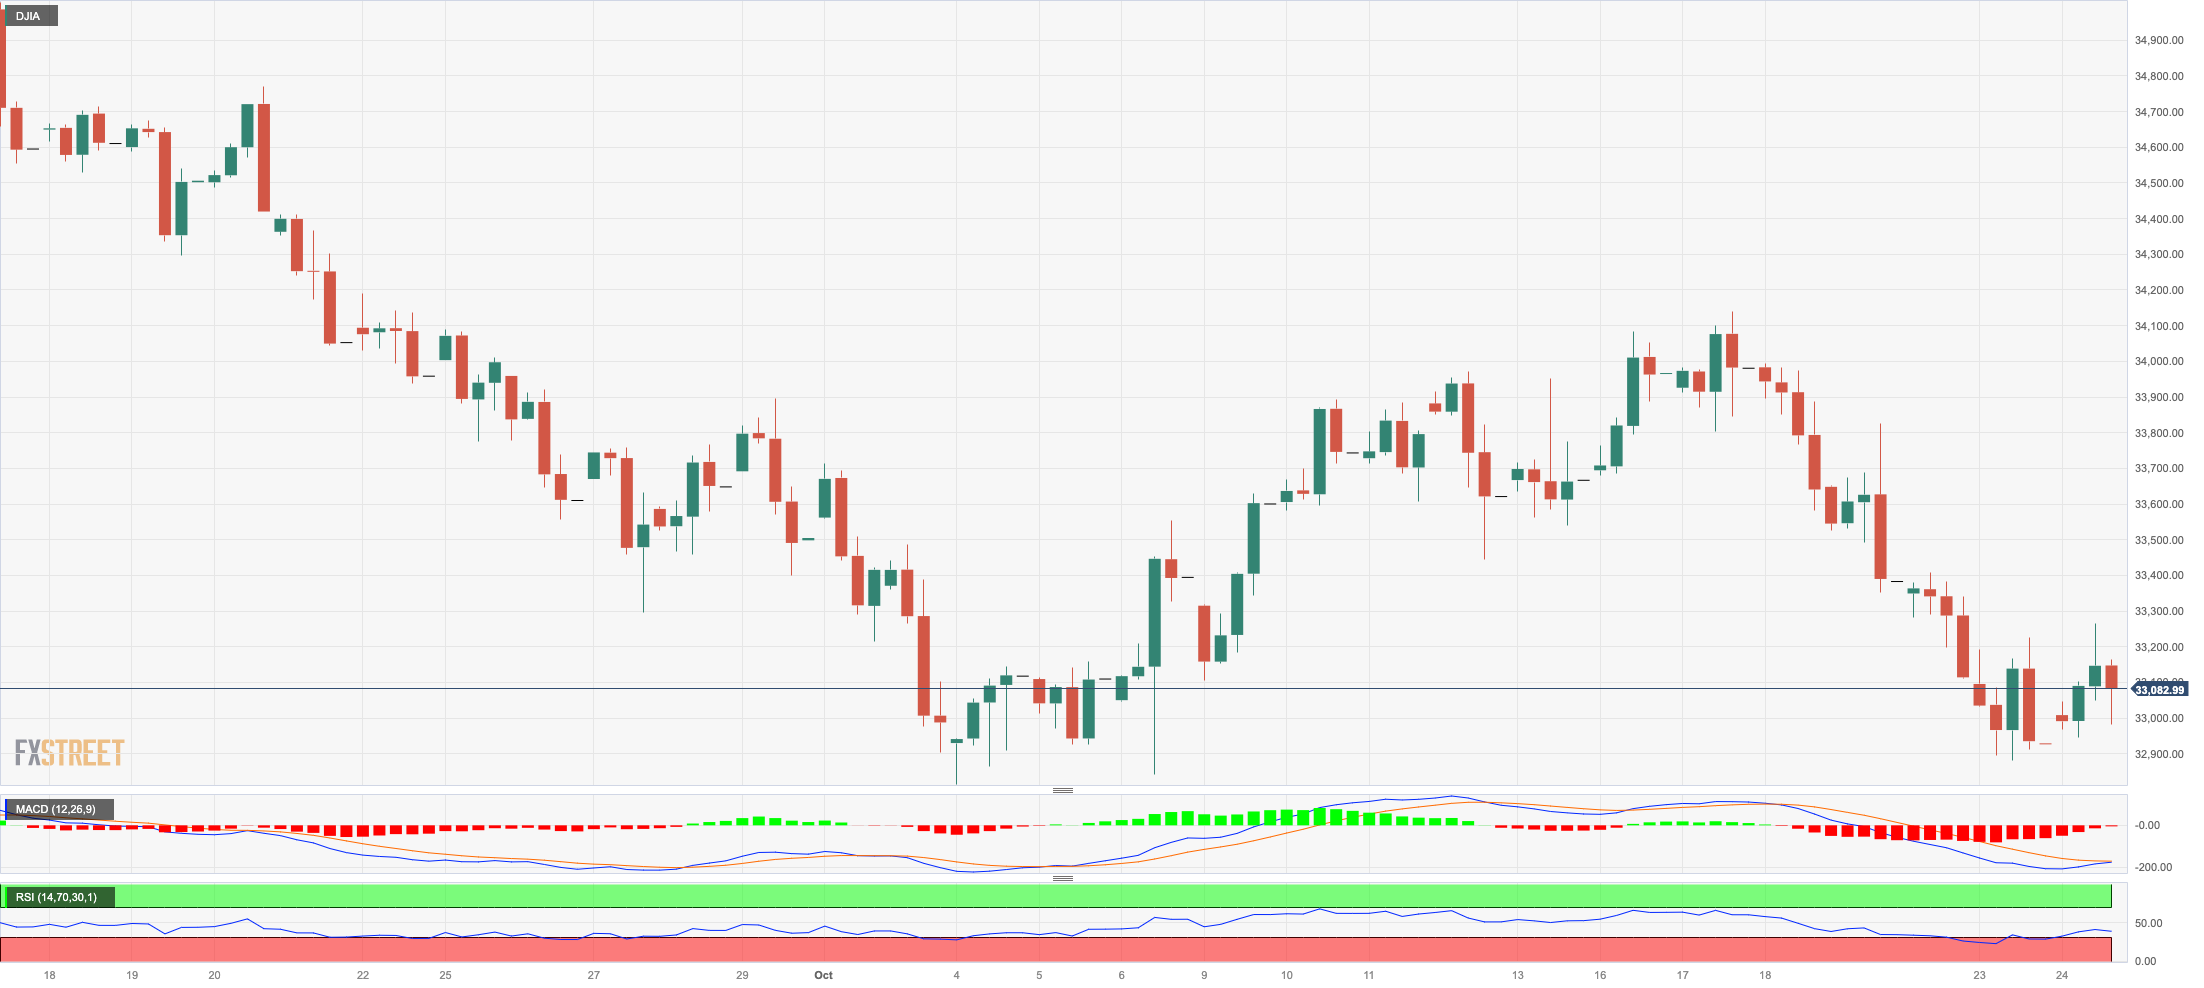
Against that backdrop, the Dow Jones reclaimed the area above the 33000 yardstick, pushed by auspicious results from the US manufacturing and services sectors as well as the hope of positive earnings reports from megacaps due shortly.
Overall, the Dow Jones rose 0.45% to 33085, the S&P500 gained 0.37% to 4232, and the tech-focused Nasdaq Composite advanced 0.46% to 13079.
Further weakness may send the Dow Jones down to the October low of 32846 (October 6), which precedes the May low of 32586 (May 25) and the 2023 low of 31429 (March 15). Instead, the critical 200-day SMA at 33826 stands in the way of further advances to the October high of 34147 (October 17), which is just ahead of the intermediate 55-day and 100-day SMAs at 34194 and 34318, respectively. Extra gains could revisit the September top of 34977 (September 14), ahead of the weekly peak of 35070 (August 31) and the 2023 high of 35679 (August 1). The everyday RSI ticked higher to the vicinity of 37.
Top Performers: Verizon, 3M, Coca-Cola
Worst Performers: Chevron, Walgreen Boots, Walt Disney
Resistance levels: 34147 34323 34977 (4H chart)
Support levels: 32892 32846 32586 (4H chart)
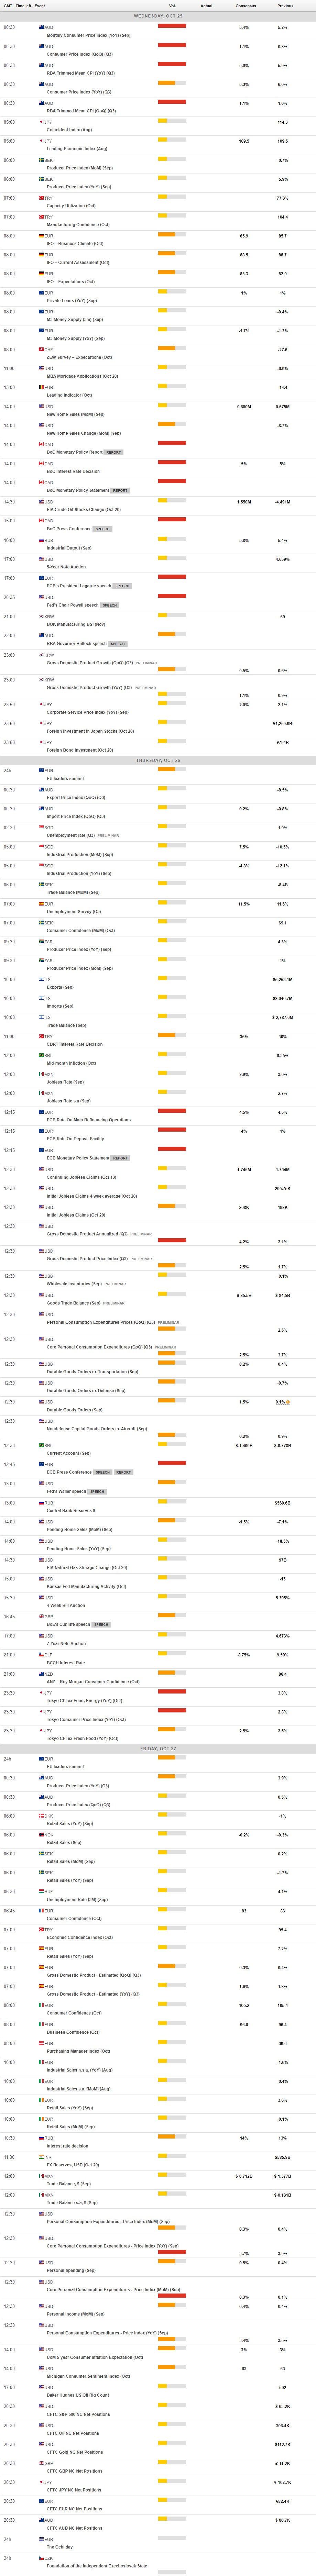
MACROECONOMIC EVENTS
All Information & Updates provided by:

All information relating to the financial markets available on this page has been prepared and issued by FXStreet (Forexstreet SL, Spain, Reg: B62498233) on the basis of publicly available information and all information believed to be reliable and does not conflict with Kuwaiti local laws, and all necessary care has been taken to before the company to ensure that the facts mentioned are correct from the source.
NCM Investment nor any of its directors or employees shall in any way be held responsible for the contents of this news, and the information contained on this page is intended only to provide clients with publicly available information and should not be construed as investment advice, report or analysis and/or constitute an offer or invitation to buy or sell financial instruments of any kind.
RISK WARNING: Forex and CFDs are highly risky leveraged products, as losses can exceed deposits. Please ensure you understand all the risks and take independent advice if necessary. NCM will segregate the clients based on the criteria of the regulator and its bylaws. NCM does not provide any advisory service; the material published does not constitute advice or a recommendation for a transaction in any financial instrument. NCM accepts no responsibility for any use of the content presented and any consequences of that use. Anyone acting on the information provided does so at their own risk.