
- Contact Us:
-

-

-

-


Daily Market Updates
26 Oct 2023
USDJPY
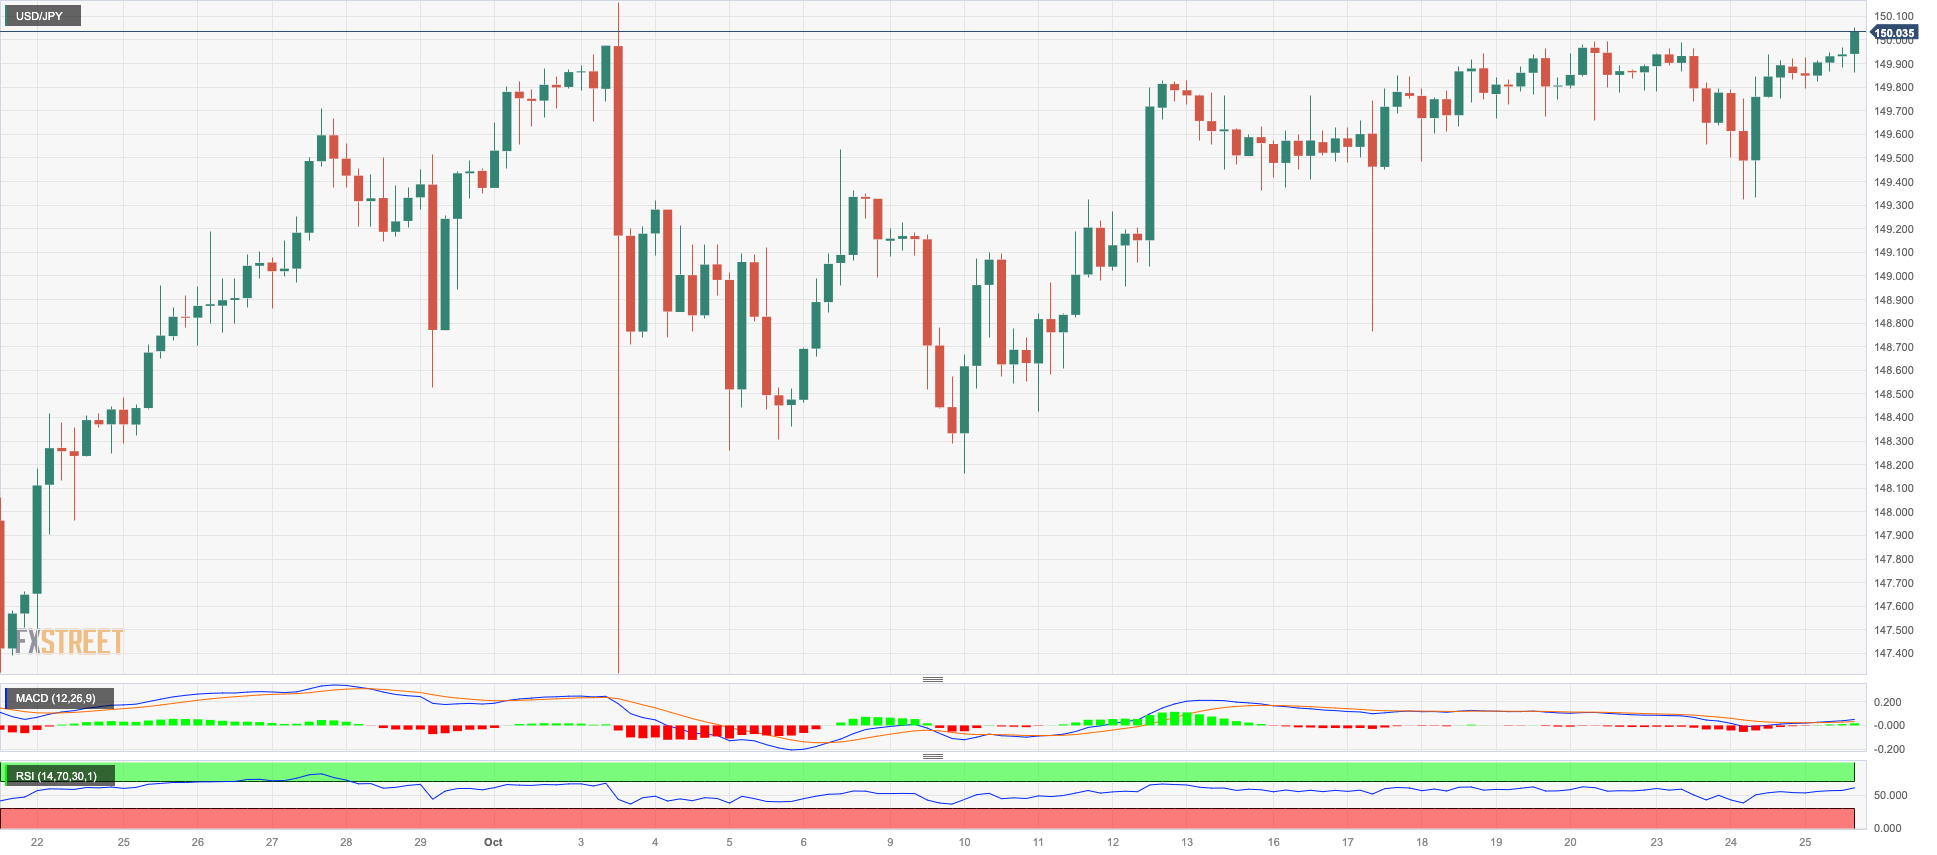
No changes to the consolidative theme around USD/JPY so far on Wednesday, as the pair extended further its multi-session side-lined trade around the key 150.00 barrier.
The small increase in the spot was in tandem with further recovery in the greenback, while US yields regained impulse across the curve and the Japanese JGB 10-year yields advanced marginally to 0.86%.
On the monetary policy front, market participants appear to favour some tweaking of the BoJ’s YCC programme at the bank’s next meeting.
In the Japanese docket, final figures saw the Coincident Index at 114.6 in August and the Leading Economic Index at 109.2 for the same period.
Further USD/JPY gains aim for the 2023 peak of 150.16 (October 3), seconded by the 2022 top of 151.94 (October 21). In contrast, the weekly low of 148.16 (October 10) appears to be the most recent contender, ahead of the transitory 55-day SMA at 147.76 and the October low of 147.27 (October 3). Down from here emerges the weekly low at 145.89 (September 11) before the September low of 144.43 (September 1). Once the latter is cleared, there are no support levels of note until the August low of 141.50 ahead of the 200-day SMA at 139.64, and the July low of 137.23 (July 14). The daily RSI improved past the 61 level.
Resistance levels: 150.04 150.16 151.94 (4H chart)
Support levels: 149.32 148.73 148.16 (4H chart)
GBPUSD
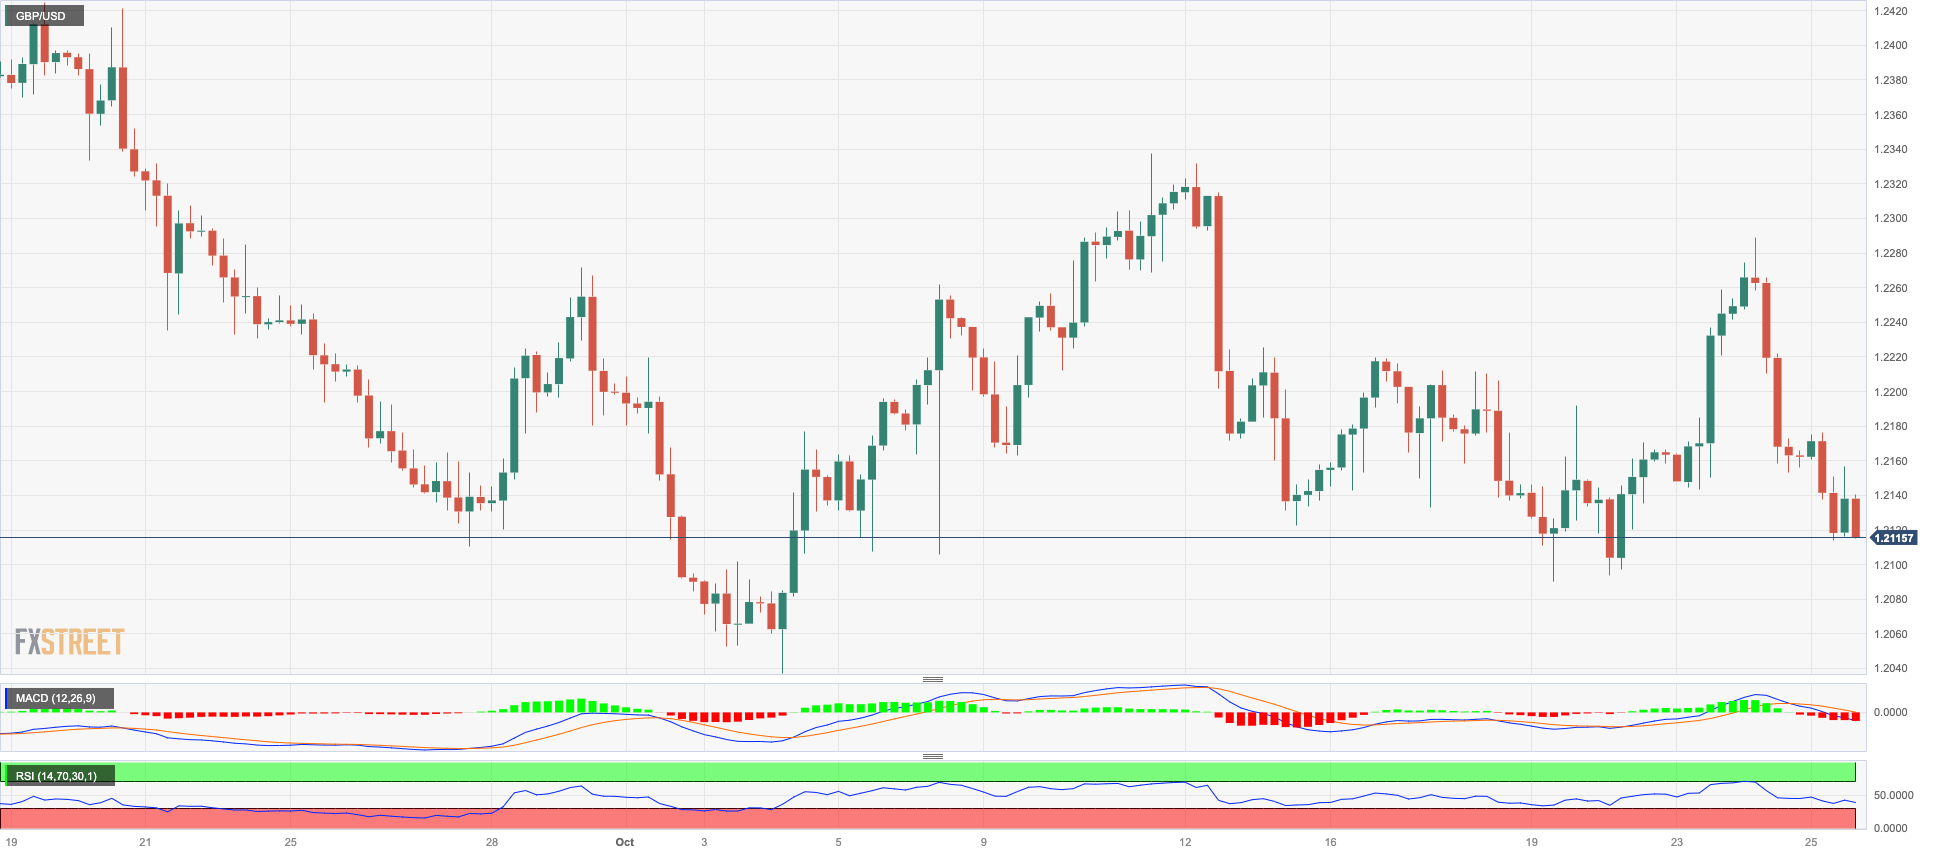
In line with the rest of its risk-associated peers, the British pound traded well on the defensive vs. the greenback on Wednesday, this time dragging GBP/USD back to the vicinity of the 1.2100 neighbourhood, or multi-session lows.
The marked retracement in Cable also came amidst the rebound in UK 10-year gilts, which advanced past 4.60% following three consecutive daily retracements.
On the monetary policy front, consensus among investors remained tilted towards a pause by the BoE at its upcoming meeting.
There were no data releases across the Channel on Wednesday.
The continuation of the selling tendency might lead the GBP/USD to retest the weekly low of 1.2089 (October 19), which is just ahead of the October low of 1.2037 (October 3). The latter's breakdown might open the way for a move to the psychologically important 1.2000 level before the 2023 low at 1.1802 (March 8). On the other hand, the immediate resistance level for Cable is the October high of 1.2337 (October 11), followed by the 200-day SMA at 1.2440. Above this level, the weekly top of 1.2548 (September 11) looms, followed by the transitory 100-day SMA at 1.2577. The loss of this level could open the door to weekly peaks at 1.2746 (August 30), 1.2818 (August 10) and 1.2995 (July 27), all of which precede the critical level of 1.3000. The RSI in the daily chart receded to the 40 zone.
Resistance levels: 1.2288 1.2337 1.2421 (4H chart)
Support levels: 1.2089 1.2037 1.1802 (4H chart)
AUDUSD
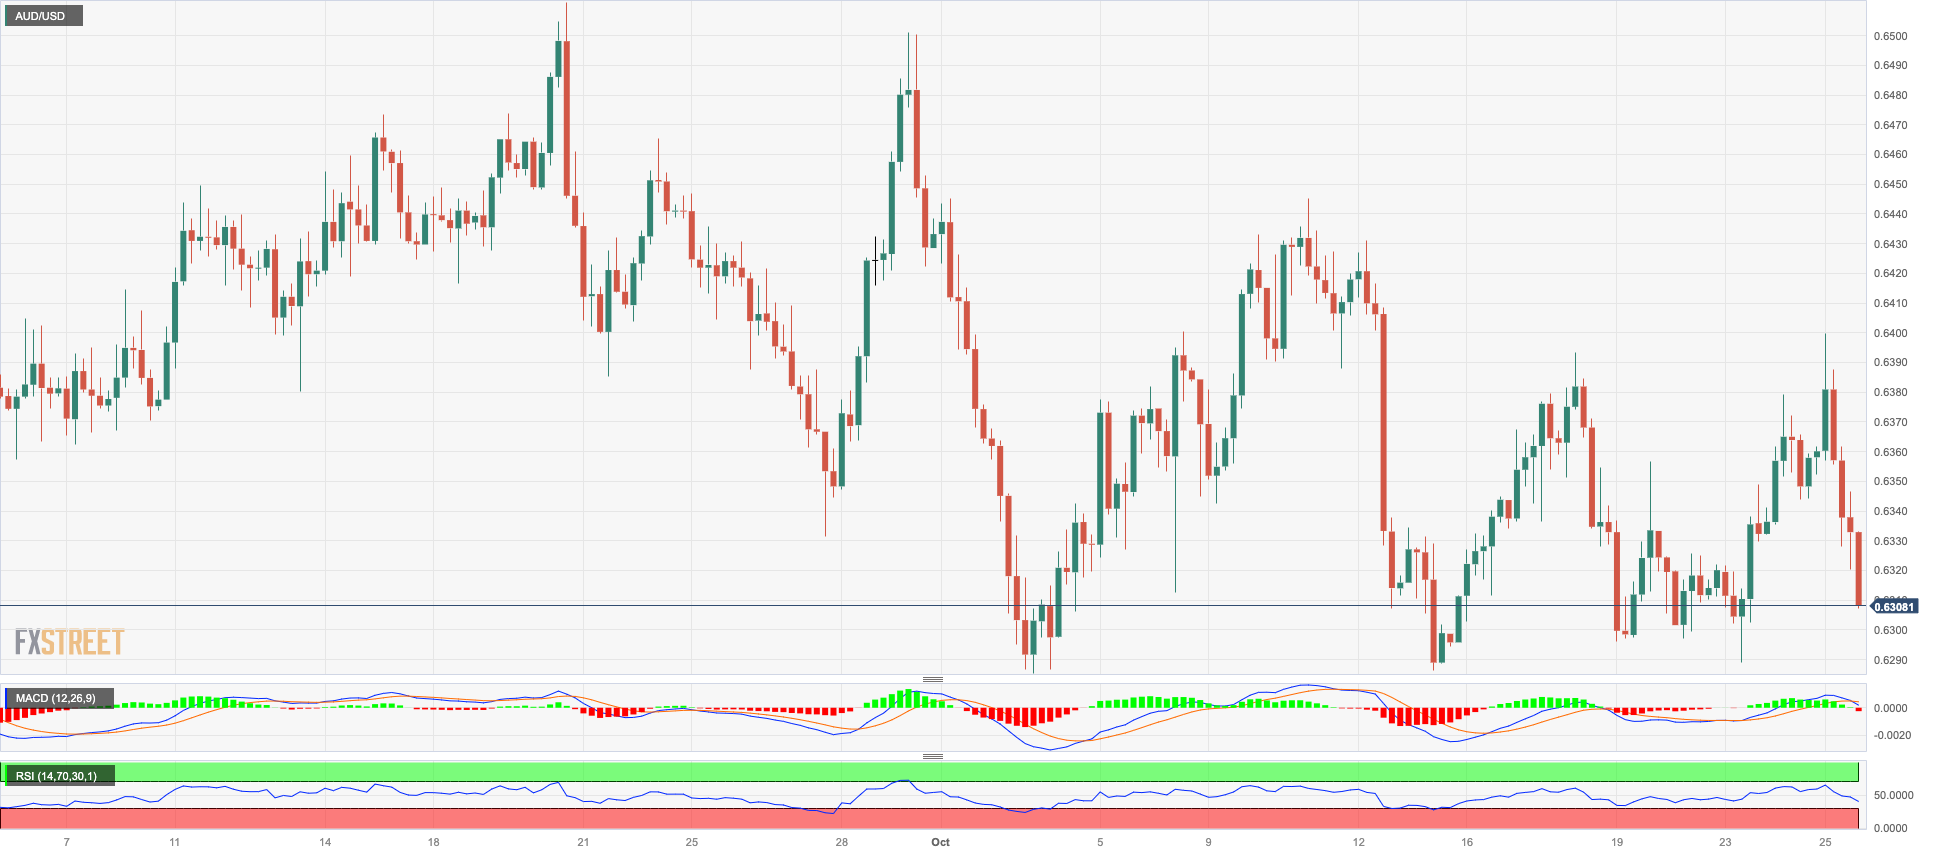
The continuation of the upside momentum in the greenback weighed on the risk complex and prompted AUD/USD to recede from earlier multi-day tops around 0.6400 the figure and end Wednesday’s session near 0.6300, reversing two consecutive daily advances.
In fact, the daily retracement in the pair followed the broad-based weakness in the risk-associated universe and the generalized bearish performance in the commodity space.
That said, the Aussie dollar could not hold on to early gains after higher-than-expected inflation figures in Australia fuelled speculation of a rate hike by the RBA at its November event.
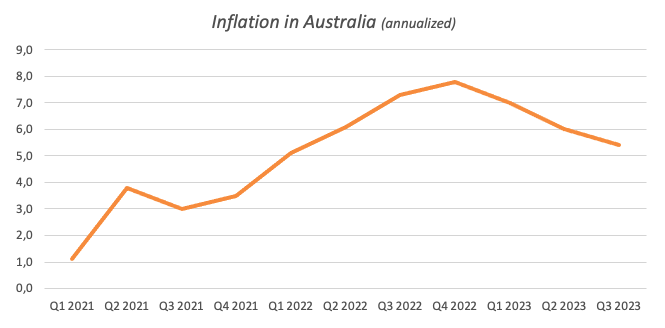
On the latter, Australia’s Monthly CPI Indicator rose to 5.6% in September, while the Inflation Rate rose 5.4% YoY in the July–September period and 1.2% QoQ.
In case bears regain control, AUD/USD may hit the 2023 low of 0.6285 (October 3) before the November 2022 bottom of 0.6272 (November 7) and the 2022 low of 0.6179 (October 13). On the upside, the October top of 0.6445 (October 11) is the immediate resistance, followed by the weekly peak of 0.6501 (September 29) and the September high at 0.6521 (September 1). Extra gains from here target the temporary 100-day SMA at 0.6542 prior to the weekly high of 0.6616 (August 10) ahead of the 200-day SMA at 0.6643. Further increases may propel the pair to its July top of 0.6894 (July 14), then to the June peak of 0.6899 (June 16), and finally to the key 0.7000 threshold. The daily RSI slipped back to the 42 region.
Resistance levels: 0.6399 0.6445 0.6501 (4H chart)
Support levels: 0.6306 0.6288 0.6272 (4H chart)
GOLD
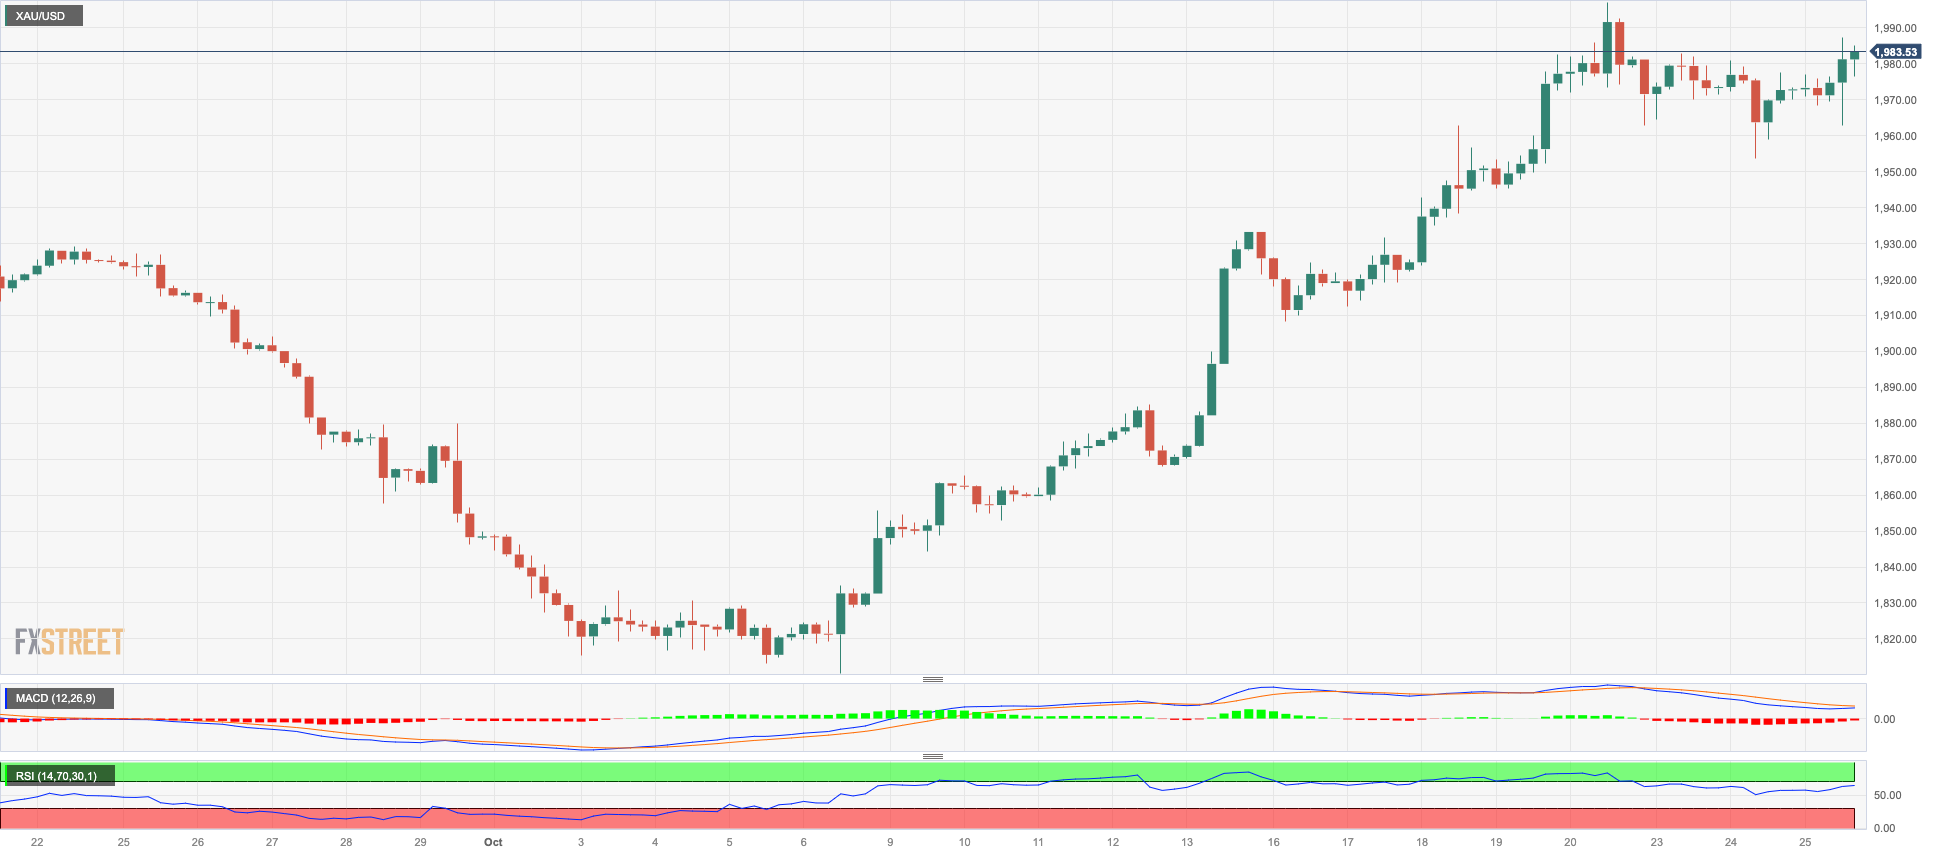
Following two consecutive daily retracements, gold prices managed to regain the smile and advance to the boundaries of the $1990 region per troy ounce on Wednesday.
The move higher in the precious metal came against the backdrop of extra upside momentum in the greenback and further gains in US yields across different maturities, while persistent geopolitical concerns seem to have also bolstered the upside in the yellow metal.
Gold prices should meet the next up-barrier at the October peak of $1997 (October 20) ahead of the crucial $2000 milestone. The 2023 high of $2067 (May 4) may be challenged from here, followed by the 2022 top of $2070 (March 8) and the all-time peak of $2075. (August 7, 2020). On the contrary, the 200-day SMA at $1931 offers immediate support, which is backed up by the intermediate 55-day SMA at $1908 ahead of the October low of $1810 (October 6). If the latter fails, the 2023 low of $1804 (February 28) may be challenged before reaching the critical support zone of $1800.
Resistance levels: $1997 $2022 $2048 (4H chart)
Support levels: $1953 $1908 $1867 (4H chart)
CRUDE WTI
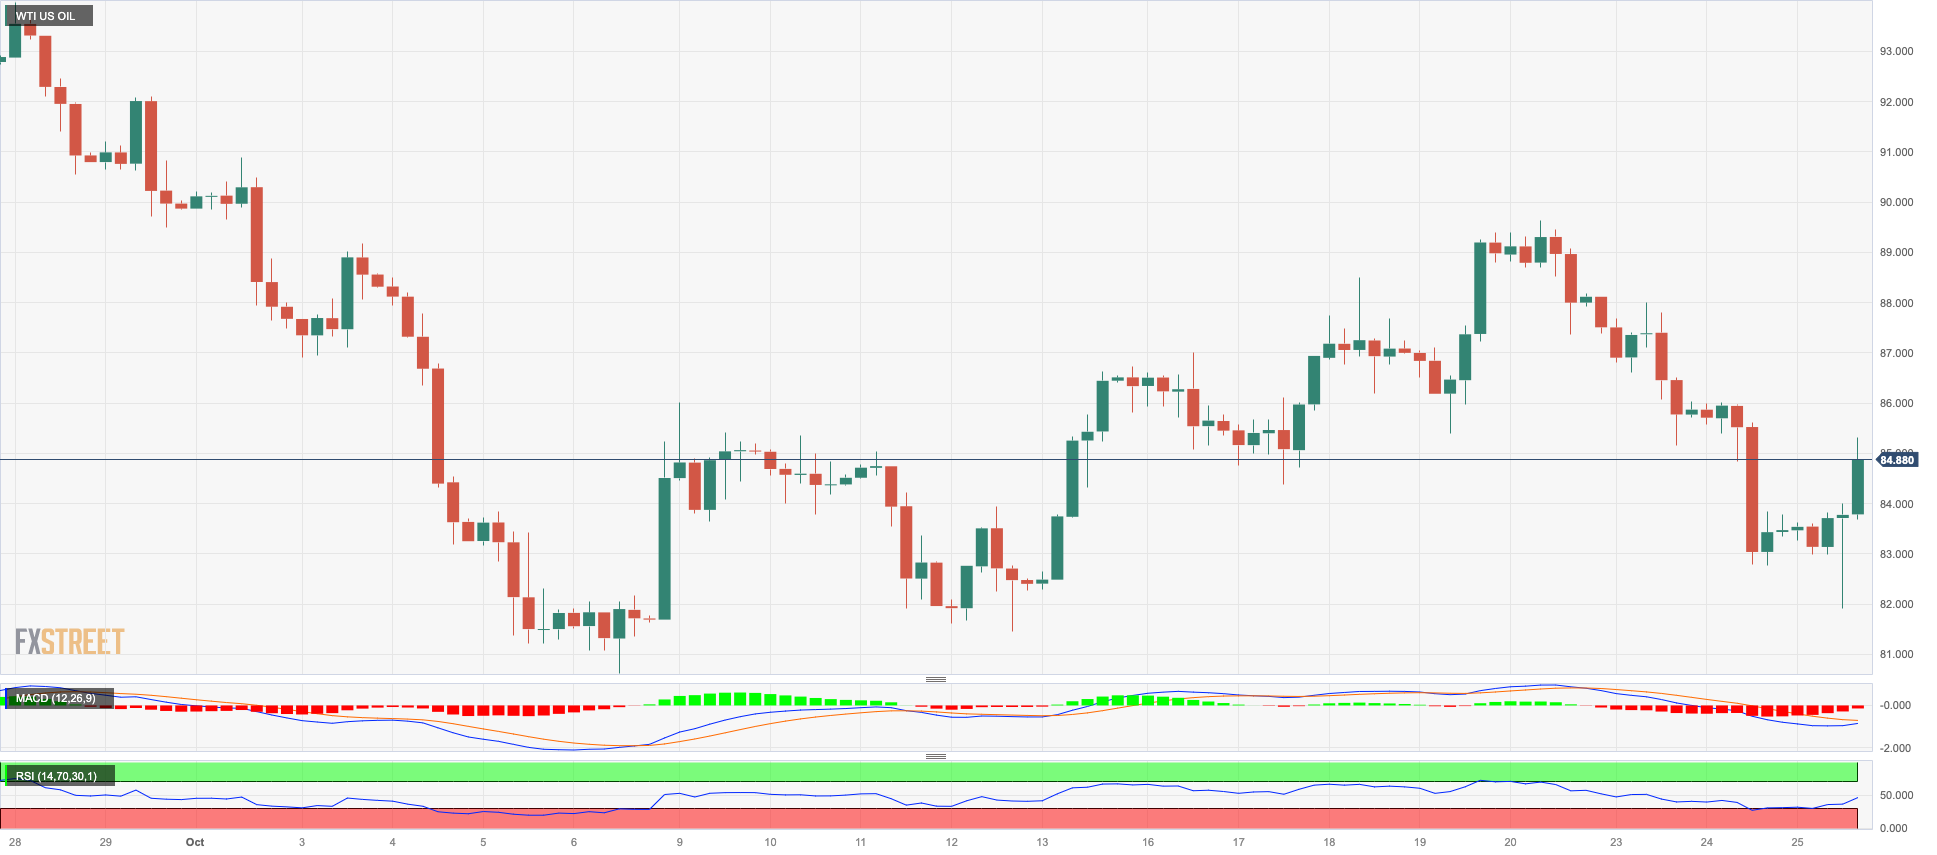
Prices of the American benchmark for sweet light crude oil managed to reverse an early drop to the $82.00 region per barrel, reclaiming the $84.00 yardstick and beyond towards the end of the NA session on Wednesday.
In fact, price action around crude oil navigated amidst persistent geopolitical concerns in the Middle East, while the bearish note came from the unexpected weekly build in US crude oil inventories, as reported by the EIA, in combination with the persevering deterioration of fundamentals in Europe.
Back to the EIA’s report, US crude oil inventories increased by 1.371M barrels in the week to October 20, while supplies at Cushing went up by 0.213M barrels, Weekly Distillate Stocks shrank by 1.686M barrels, and gasoline stockpiles rose by 0.156M barrels.
If WTI falls further, the October bottom of $81.56 (October 6) might be revisited, ahead of the crucial 200-day SMA at $78.09 and the August low of $77.64 (August 24). The breakdown of this zone might put the weekly low of $73.89 (July 17) to the test before the critical $70.00 milestone per barrel. If this important level is breached, the June low of $66.85 (June 12) will be revealed, followed by the 2023 low of $63.61 (May 4) and the vital $60.00 mark per barrel. On the flip side, the weekly top of $89.83 (October 18) comes ahead of the 2023 peak of $94.99 (September 28). Another weekly high emerges at $97.65 (August 30, 2022), just under the psychological $100.00 threshold per barrel.
Resistance levels: $88.06 $89.83 $91.84 (4H chart)
Support levels: $82.06 $81.47 $79.31 (4H chart)
GER40
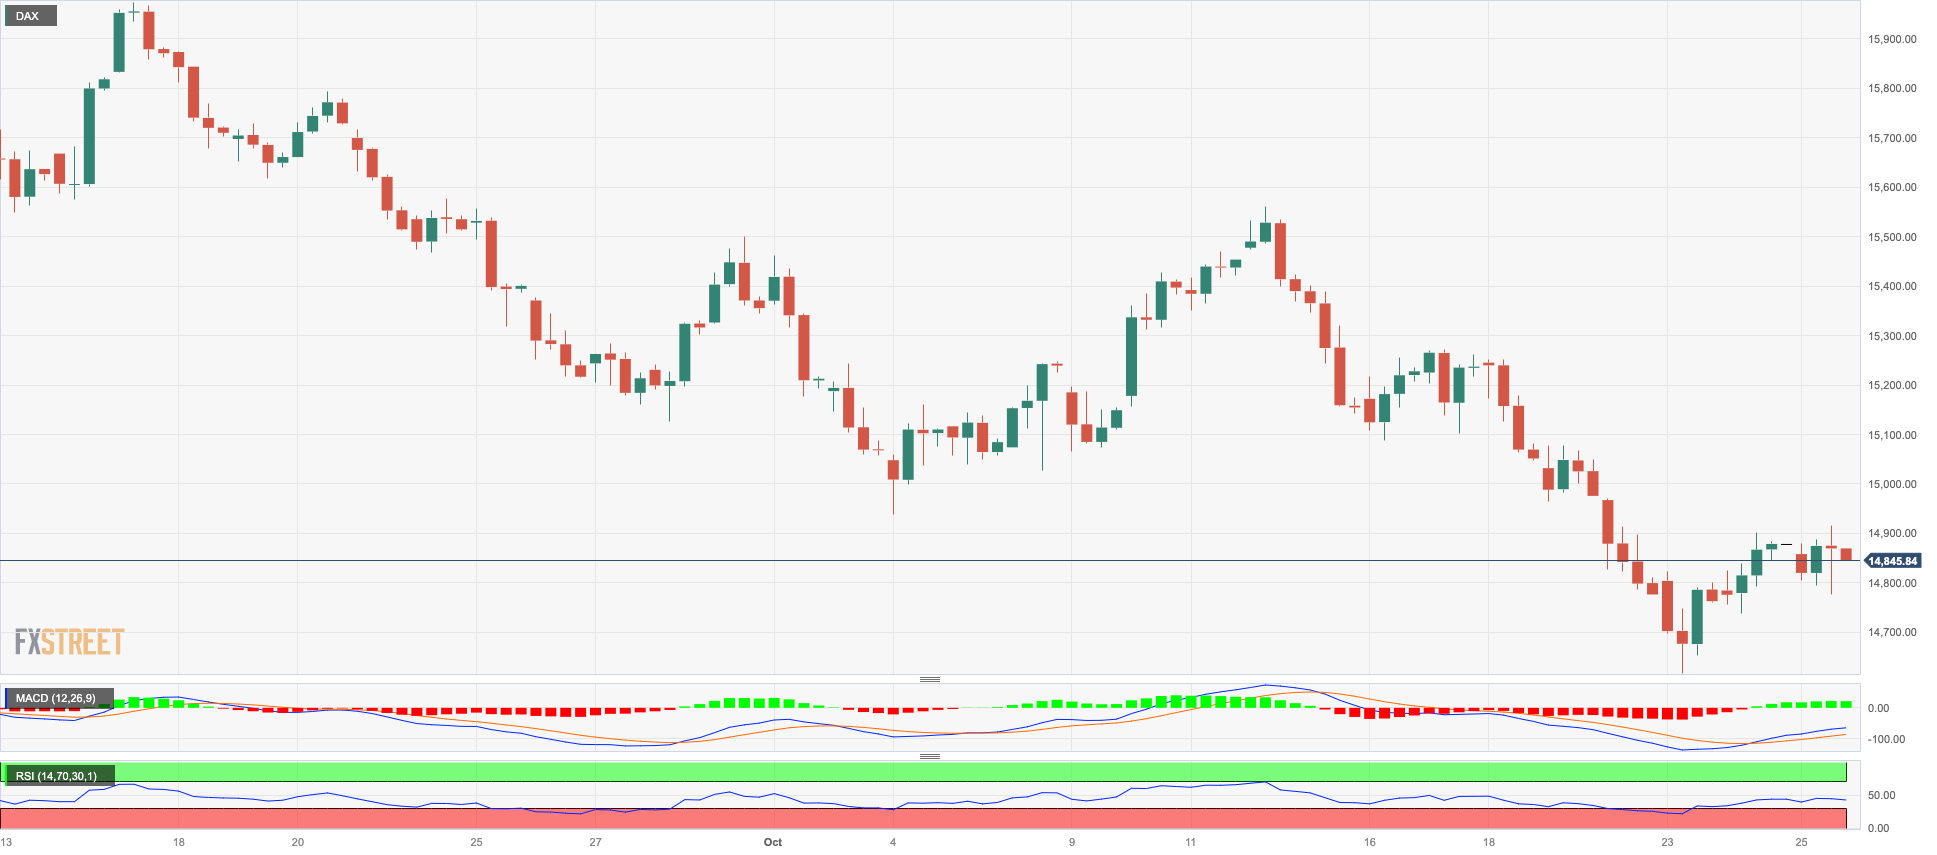
The German DAX40 advanced for the third consecutive session on Wednesday, keeping the positive streak well in place so far this week.
European equities, in the meantime, continued to look forward to the publication of corporate earnings reports, while geopolitical jitters remained unabated and prudence grew bigger ahead of the ECB interest rate decision on Thursday.
In addition, the release of advanced US Q3 GDP figures on the same day also prompted some cautiousness among market participants.
On the positive side, markets on the old continent seem to have welcomed news of further stimulus in China as the government increased its attempts to boost the economy in the post-pandemic era.
The resumption of the bearish trend could put the DAX40 en route to another test of the October low of 14630 (October 23). The breakdown of this region could expose the March low of 14458 (March 20) before the December 2022 low of 13791 (December 20) and the 2022 low of 11862 (September 28). Having said that, initial upward barrier comes at the October high of 15575 (October 12), which is just ahead of the critical 200-day SMA of 15649. Further north, the September peak of 15989 (September 15) is seen, prior to weekly tops of 16042 (August 31) and 16060 (August 10). If this barrier is overcome, the index might dispute its all-time high of 16528 (July 31). The daily RSI advanced marginally past the 36 level.
Best Performers: Deutsche Bank AG, Symrise AG, Hannover Rueck SE
Worst Performers: Zalando SE, Sartorius AG VZO, Deutsche Post
Resistance levels: 15139 15288 15575 (4H chart)
Support levels: 14630 14458 13791 (4H chart)
NASDAQ
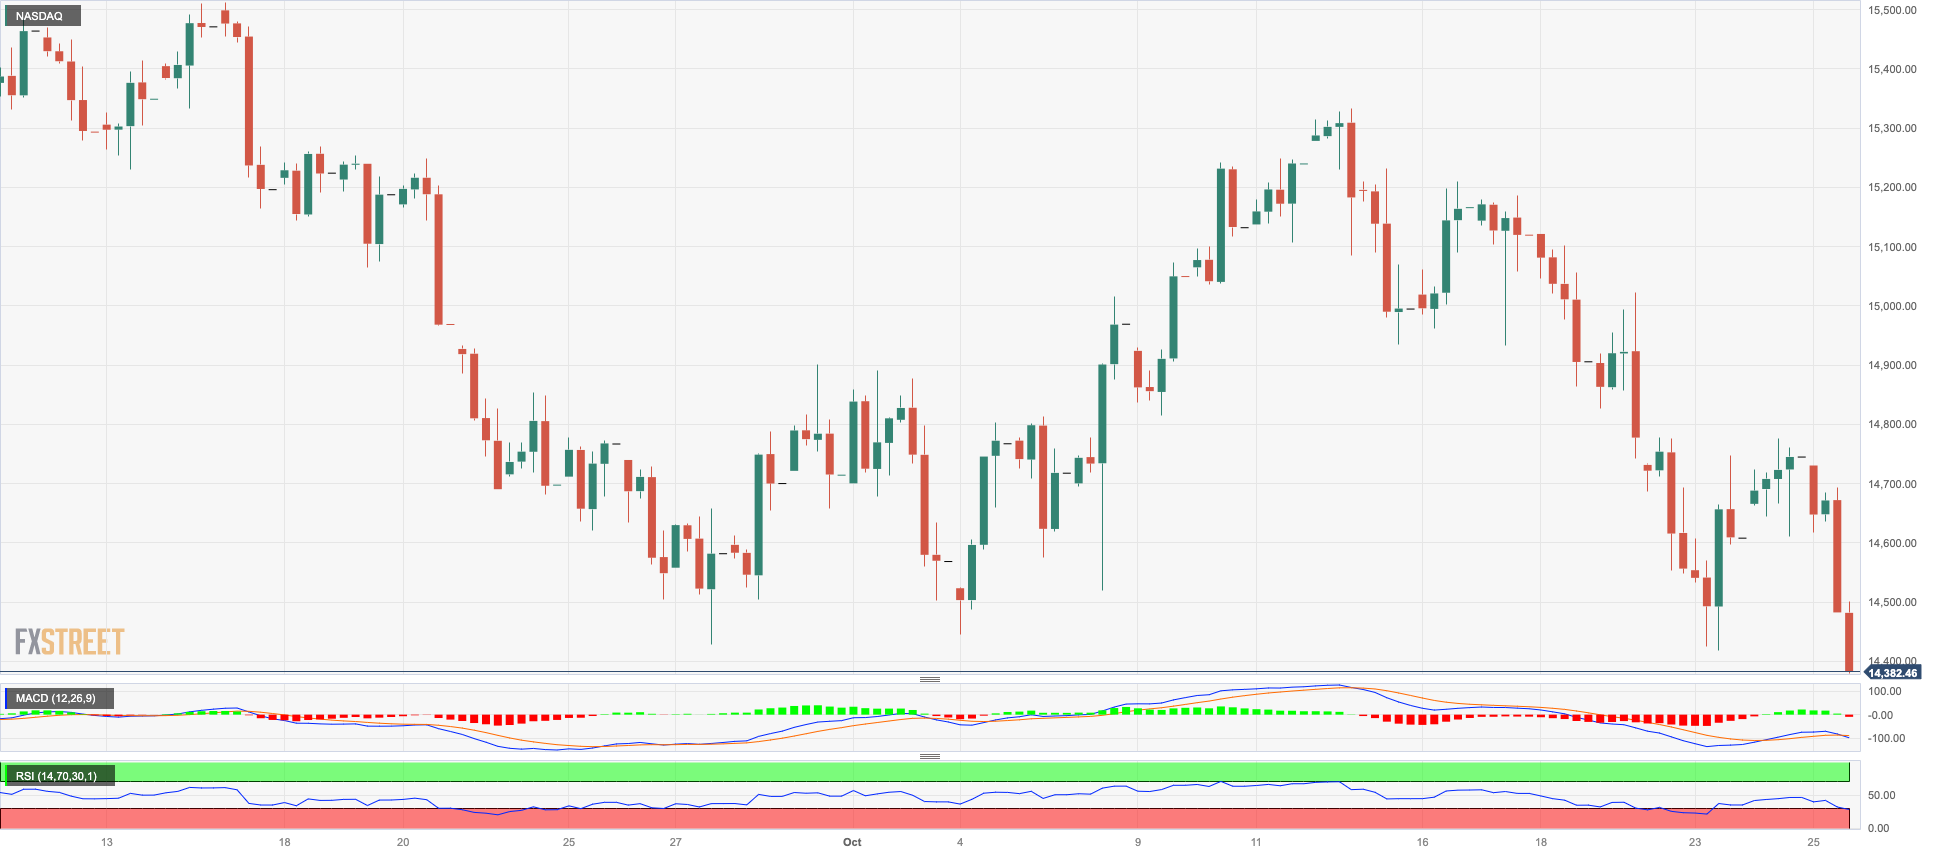
Higher US yields and the poor performance of Alphabet weighed heavily on the key tech reference Nasdaq 100 on Wednesday, dragging it to shouting distance from the monthly lows around the 14400 zone.
In addition, the stronger dollar and the broad-based risk-off environment contributed to the marked selling pressure hitting the US tech sector midweek.
If sellers seize control, the Nasdaq 100 should find immediate support at the October low of 14419 (October 23). If this level is breached, the market may fall to the weekly low of 14283 (June 7), prior to the 200-day SMA of 13898. After the market clears this zone, it may return to the April bottom of 12724 (April 25), then to the March low of 11695 (March 13), and lastly to the 2023 low of 10696 (January 6). By contrast, there is immediate resistance at the October top of 15333 (October 12) followed by the September peak of 15618 (September 1) and the weekly high of 15803 (July 31). The break above this level could prompt the index to challenge the 2023 peak of 15932 (July 19) just before the round level of 16000.
Top Gainers: Microsoft, American Electric Power, Xcel Energy
Top Losers: ADP, Alphabet C, Alphabet A
Resistance levels: 15089 15333 15512 (4H chart)
Support levels: 14419 14283 13520 (4H chart)
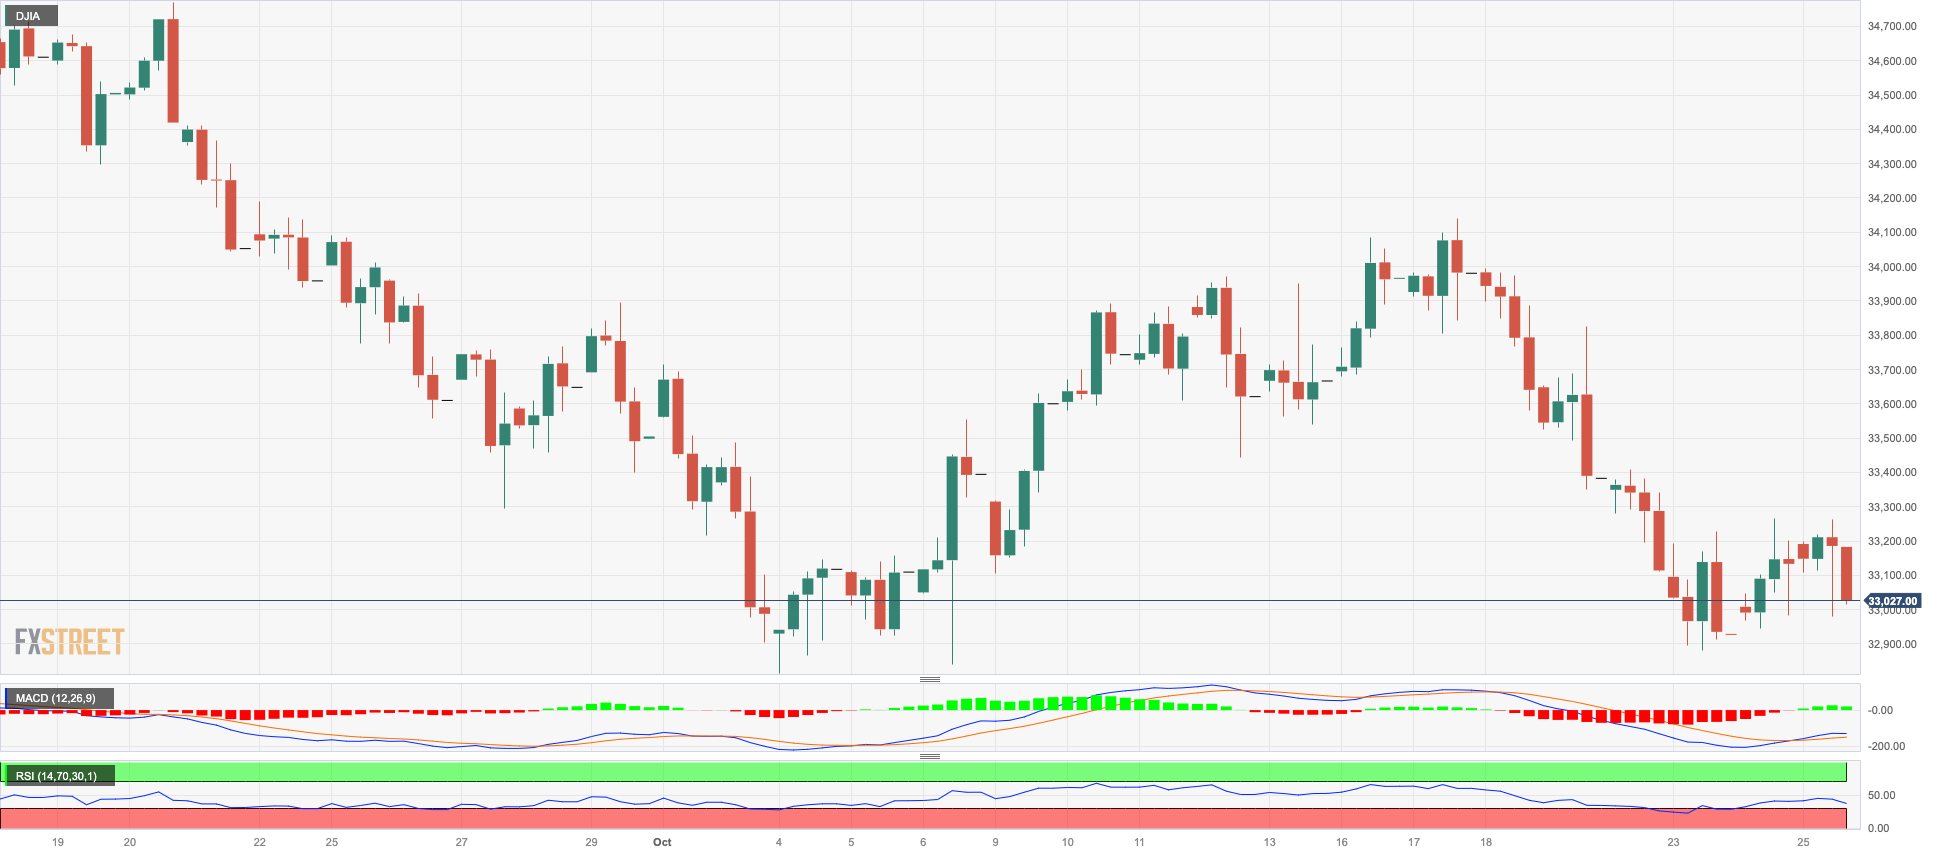
DOW JONES
US equities gauged by the key Dow Jones edged marginally lower and hovered around the 33000 threshold on Wednesday.
The negative price action around the index came in response to the resumption of the march north in US yields, particularly in the belly of the curve, while the Fed’s tighter-for-longer narrative also seems to have hurt sentiment among investors.
All in all, the Dow Jones dropped 0.16% to 33088, the S&P500 retreated 1.18% to 4197, and the tech-reference Nasdaq Composite deflated 2.00% to 12876.
Further deterioration may take the Dow Jones to its October low of 32846 (October 6), which precedes the May low of 32586 (May 25) and the 2023 low of 31429 (March 15). Instead, the initial up-barrier is seen at the crucial 200-day SMA at 33825 ahead of the October high of 34147 (October 17). A move higher should test the intermediate 55-day and 100-day SMAs at 34155 and 34312, respectively before the September top of 34977 (September 14), and the weekly high of 35070 (August 31). North from here aligns the 2023 peak of 35679 (August 1). The day-to-day RSI receded to the sub-38 area.
Top Performers: Travelers, Microsoft, UnitedHealth
Worst Performers: Intel, Salesforce Inc, Dow
Resistance levels: 34147 34323 34977 (4H chart)
Support levels: 32892 32846 32586 (4H chart)
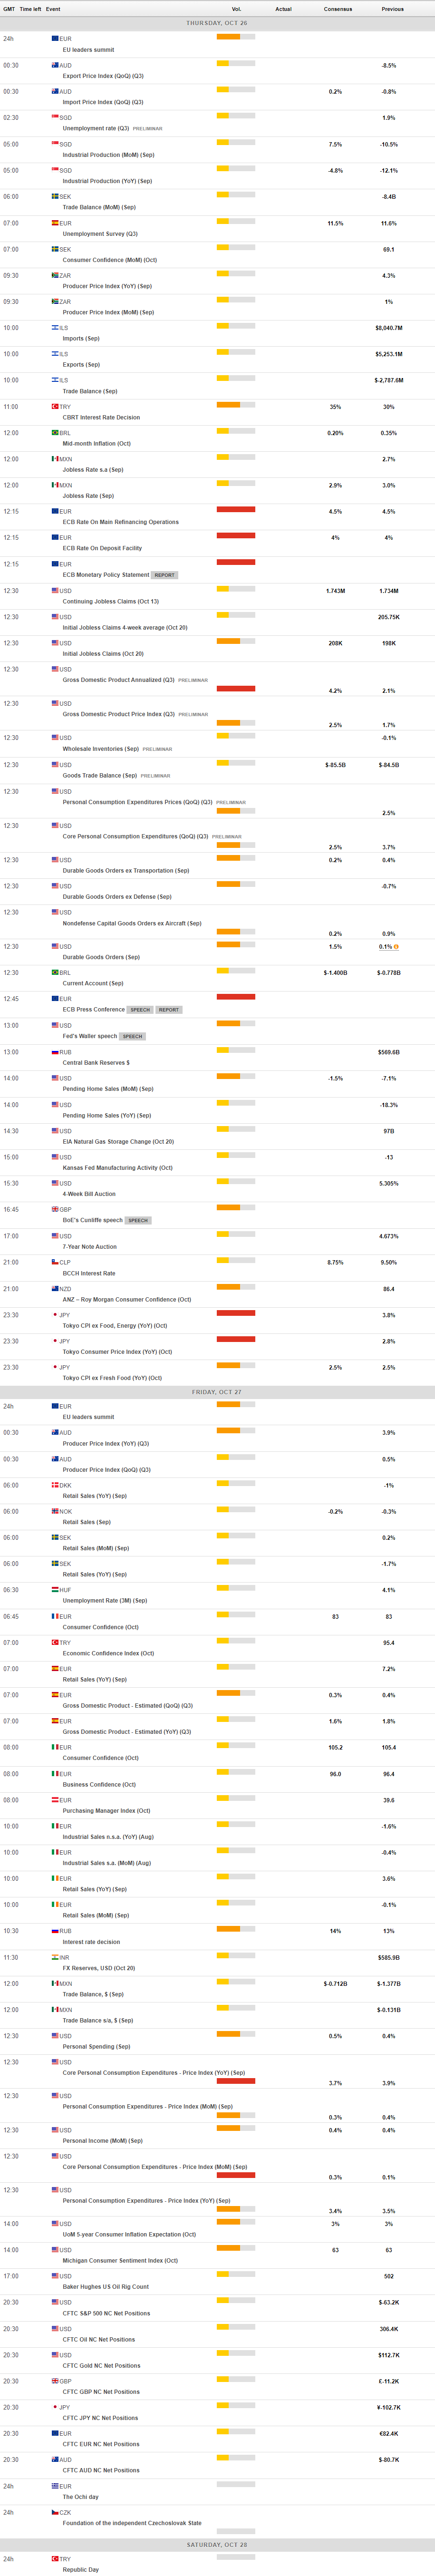
MACROECONOMIC EVENTS
All Information & Updates provided by:

All information relating to the financial markets available on this page has been prepared and issued by FXStreet (Forexstreet SL, Spain, Reg: B62498233) on the basis of publicly available information and all information believed to be reliable and does not conflict with Kuwaiti local laws, and all necessary care has been taken to before the company to ensure that the facts mentioned are correct from the source.
NCM Investment nor any of its directors or employees shall in any way be held responsible for the contents of this news, and the information contained on this page is intended only to provide clients with publicly available information and should not be construed as investment advice, report or analysis and/or constitute an offer or invitation to buy or sell financial instruments of any kind.
RISK WARNING: Forex and CFDs are highly risky leveraged products, as losses can exceed deposits. Please ensure you understand all the risks and take independent advice if necessary. NCM will segregate the clients based on the criteria of the regulator and its bylaws. NCM does not provide any advisory service; the material published does not constitute advice or a recommendation for a transaction in any financial instrument. NCM accepts no responsibility for any use of the content presented and any consequences of that use. Anyone acting on the information provided does so at their own risk.