
- Contact Us:
-

-

-

-


Daily Market Updates
27 Oct 2023
USDJPY
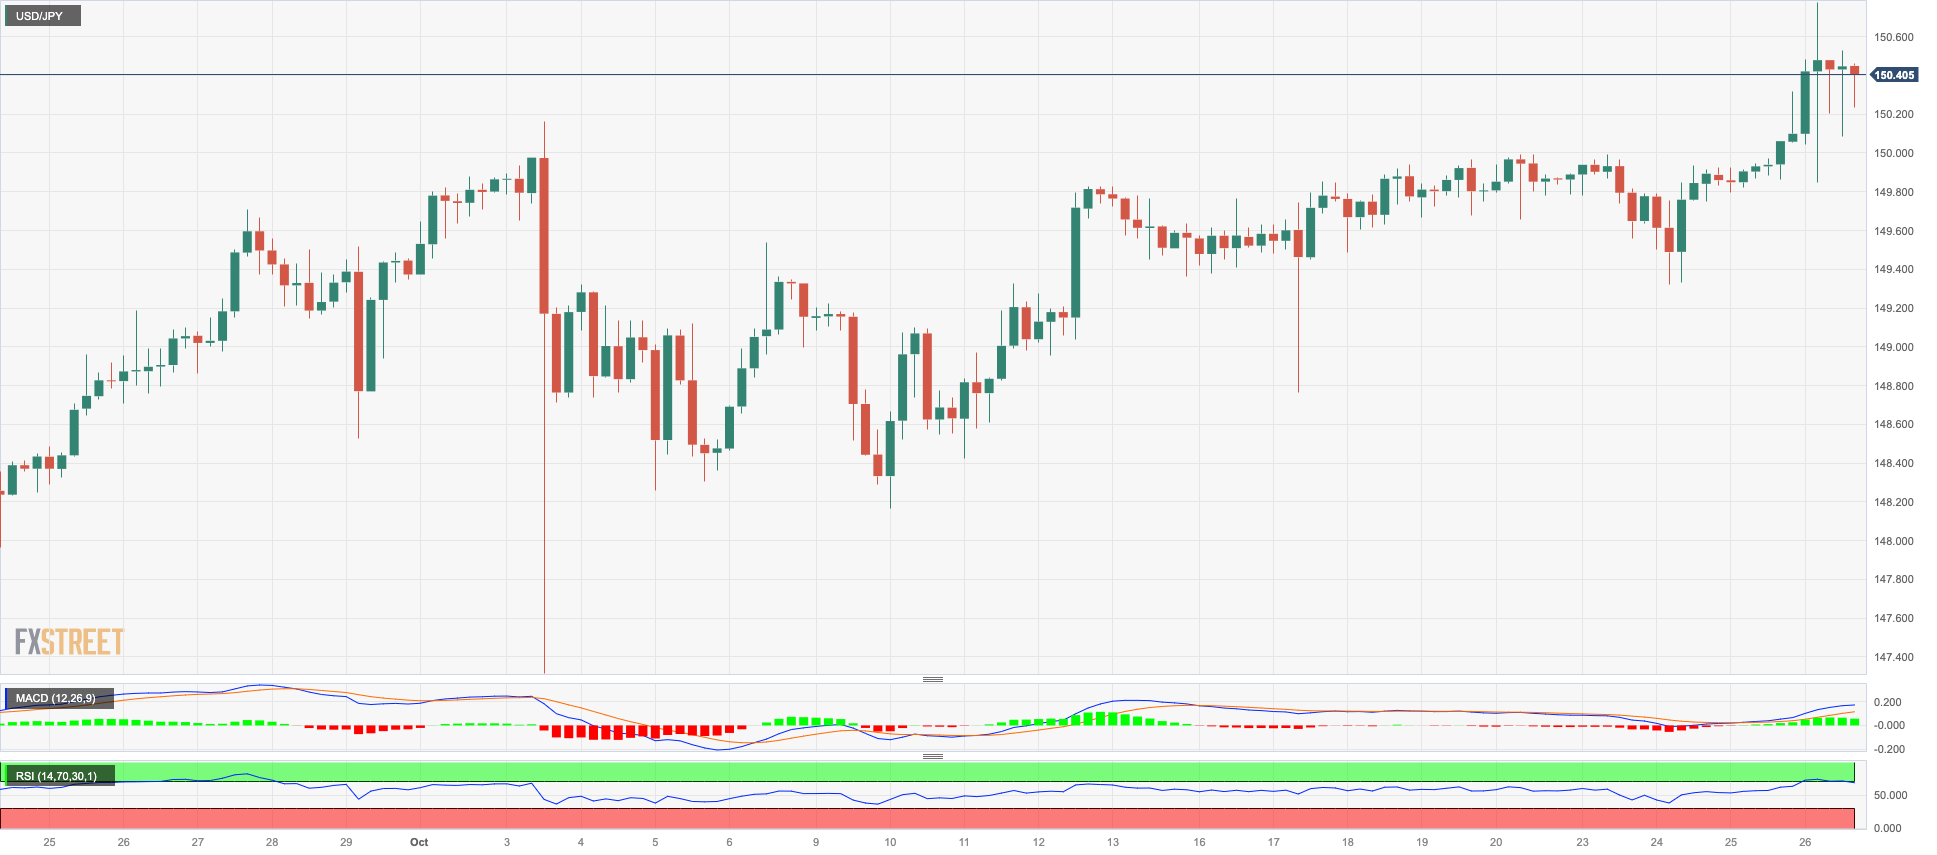
USD/JPY extended its march north and trespassed the critical 150.00 barrier for the first time since October 2022 on Thursday.
The move higher in spot also came against the backdrop of rising FX intervention chatter, further strength in the greenback, and a generalized corrective decline in US yields, while the JGB 10-year yields crept higher to the vicinity of 0.90%.
In terms of monetary policy, market players tend to favour some tinkering with the BoJ’s YCC programme at the bank's next meeting.
In Japan, Foreign Bond Investment shrank by ¥151.7B in the week to October 21.
Further USD/JPY advances aim for the 2023 peak of 150.77 (October 26), followed by the 2022 high of 151.94 (October 21) and the round level of 152.00. In contrast, the most recent challenger looks to be the weekly low of 148.16 (October 10), ahead of the transitory 55-day SMA at 147.86 and the October low of 147.27 (October 3). Further down aligns the weekly low of 145.89 (September 11), ahead of the September low of 144.43. (September 1). After that, there are no notable support levels until the August low of 141.50 (August 7), which is ahead of the 200-day SMA at 139.75 and the July low of 137.23. (July 14). The daily RSI rose past the 64 level.
Resistance levels: 150.77 151.94 152.00 (4H chart)
Support levels: 149.32 148.73 148.16 (4H chart)
GBPUSD
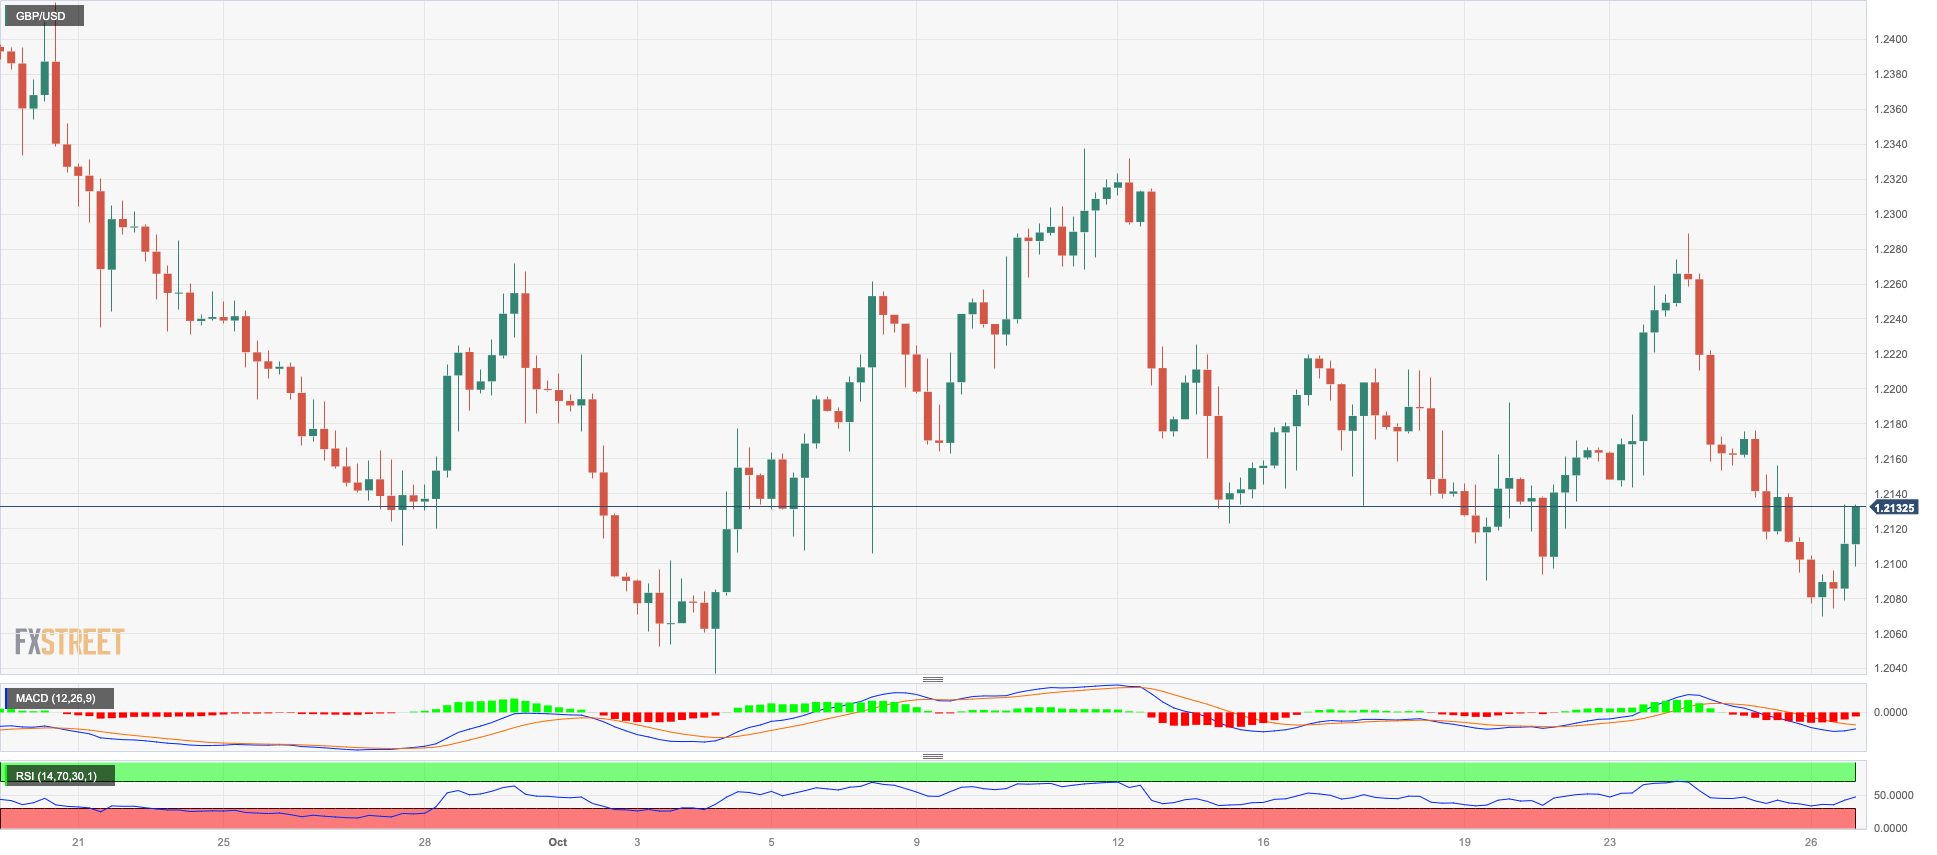
The firm bias towards the greenback did not prevent the British pound from edging higher on Thursday.
Against that backdrop, GBP/USD reversed two daily pullbacks in a row after it rebounded from multi-day lows near 1.2070.
On the monetary policy front, investors are still expecting the BoE to pause at its forthcoming meeting.
In the UK, Car Production expanded 39.8% in the year to September, and CBI Distributive Trades worsened to -16 for the current month.
If the selling trend continues, the GBP/USD might retest the October low of 1.2037 (October 3) prior to the psychologically significant 1.2000 level and the 2023 low at 1.1802 (March 8). On the opposite side, the initial resistance level for Cable is the October high of 1.2337 (October 11), seconded by the 200-day SMA at 1.2438. Above this level, the weekly top of 1.2548 (September 11) looms, ahead of the transitory 100-day SMA at 1.2572. If this level is trespassed, weekly peaks at 1.2746 (August 30), 1.2818 (August 10), and 1.2995 (July 27) are possible, all ahead of the psychological 1.3000 threshold. The daily RSI advanced beyond 41.
Resistance levels: 1.2175 1.2246 1.2288 (4H chart)
Support levels: 1.2069 1.2037 1.1802 (4H chart)
 ç
ç
AUDUSD
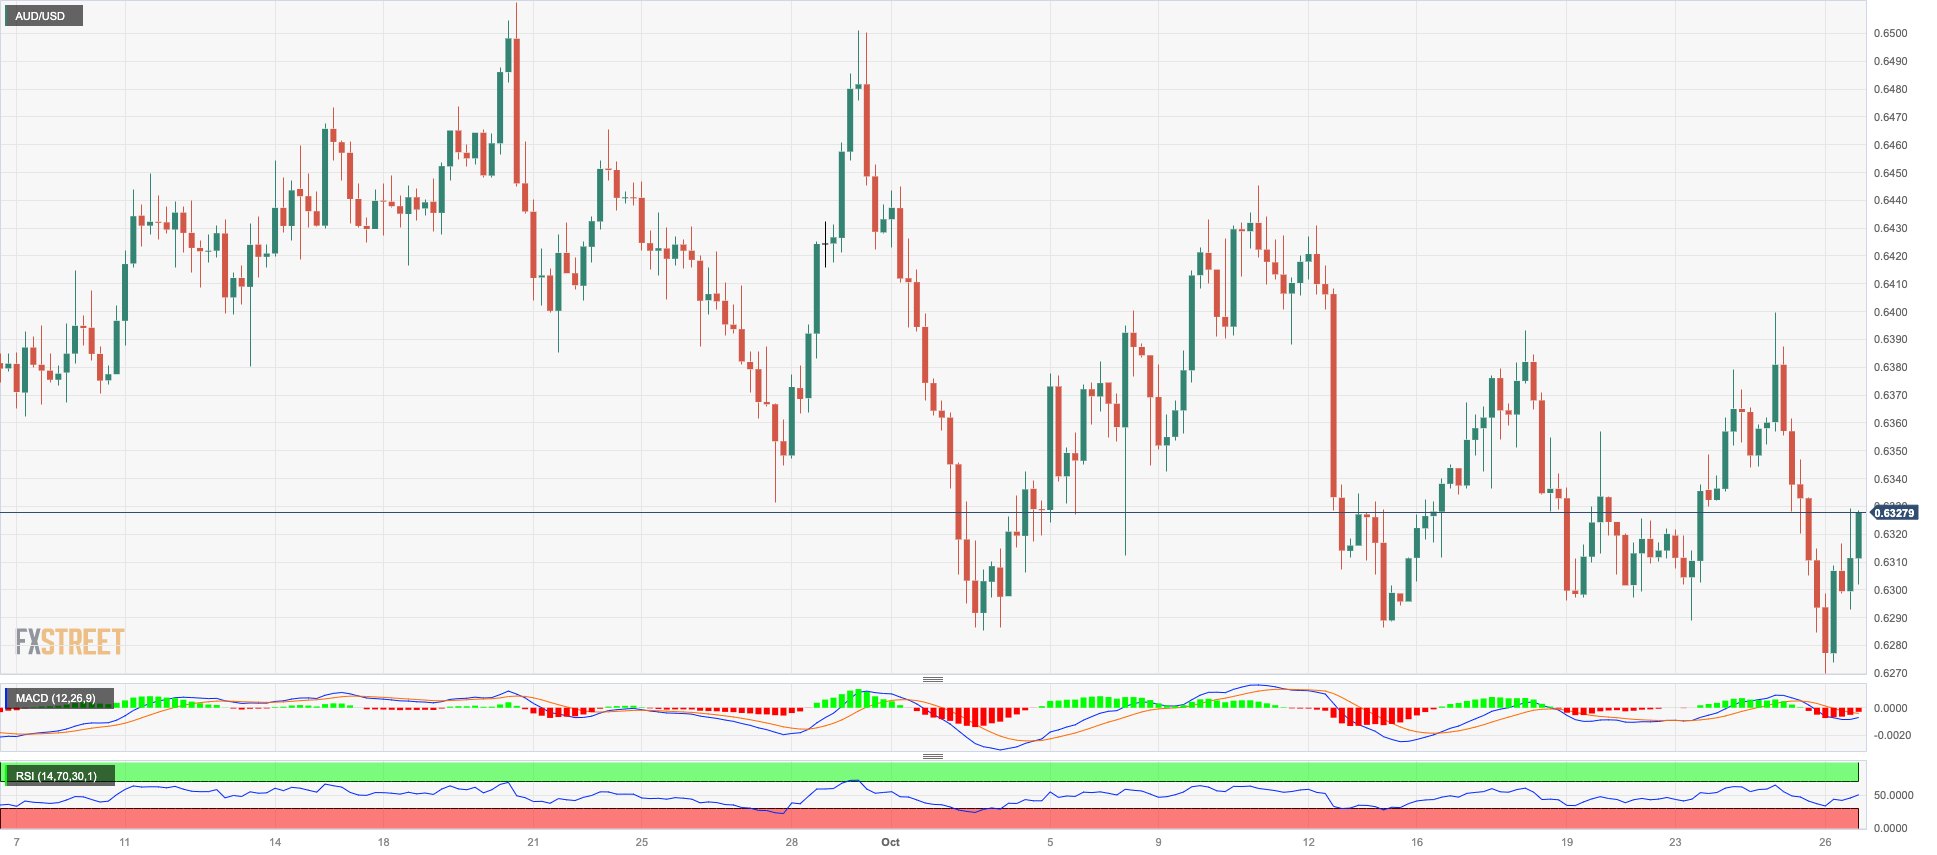
Following an earlier drop to the new 2023 low at 0.6270, AUD/USD managed to regain some composure and reclaim the 0.6300 barrier and above afterwards.
The price action around the Aussie dollar came against the backdrop of the continuation of the upside momentum in the greenback, while small improvements in both copper prices and iron ore seem to have helped the recovery in the high-beta currency.
There were no data releases scheduled for Oz on Thursday.
If bears take control, the AUD/USD may reach the 2023 low of 0.6270 (October 26) before putting the round level of 0.6200 to the test and testing the 2022 low of 0.6179 (October 13). On the upside, the immediate resistance is the October top of 0.6445 (October 11), seconded by the weekly peak of 0.6501 (September 29) and the September high of 0.6521 (September 1). Extra gains from here should aim for the temporary 100-day SMA at 0.6538, before the weekly high of 0.6616 (August 10) and the 200-day SMA at 0.6640. Further gains may take the pair to its July high of 0.6894 (July 14), then to the June high of 0.6899 (June 16), and eventually to the critical 0.7000 level. The daily RSI ticked higher past 44.
Resistance levels: 0.6399 0.6445 0.6501 (4H chart)
Support levels: 0.6277 0.6210 0.6169 (4H chart)
GOLD
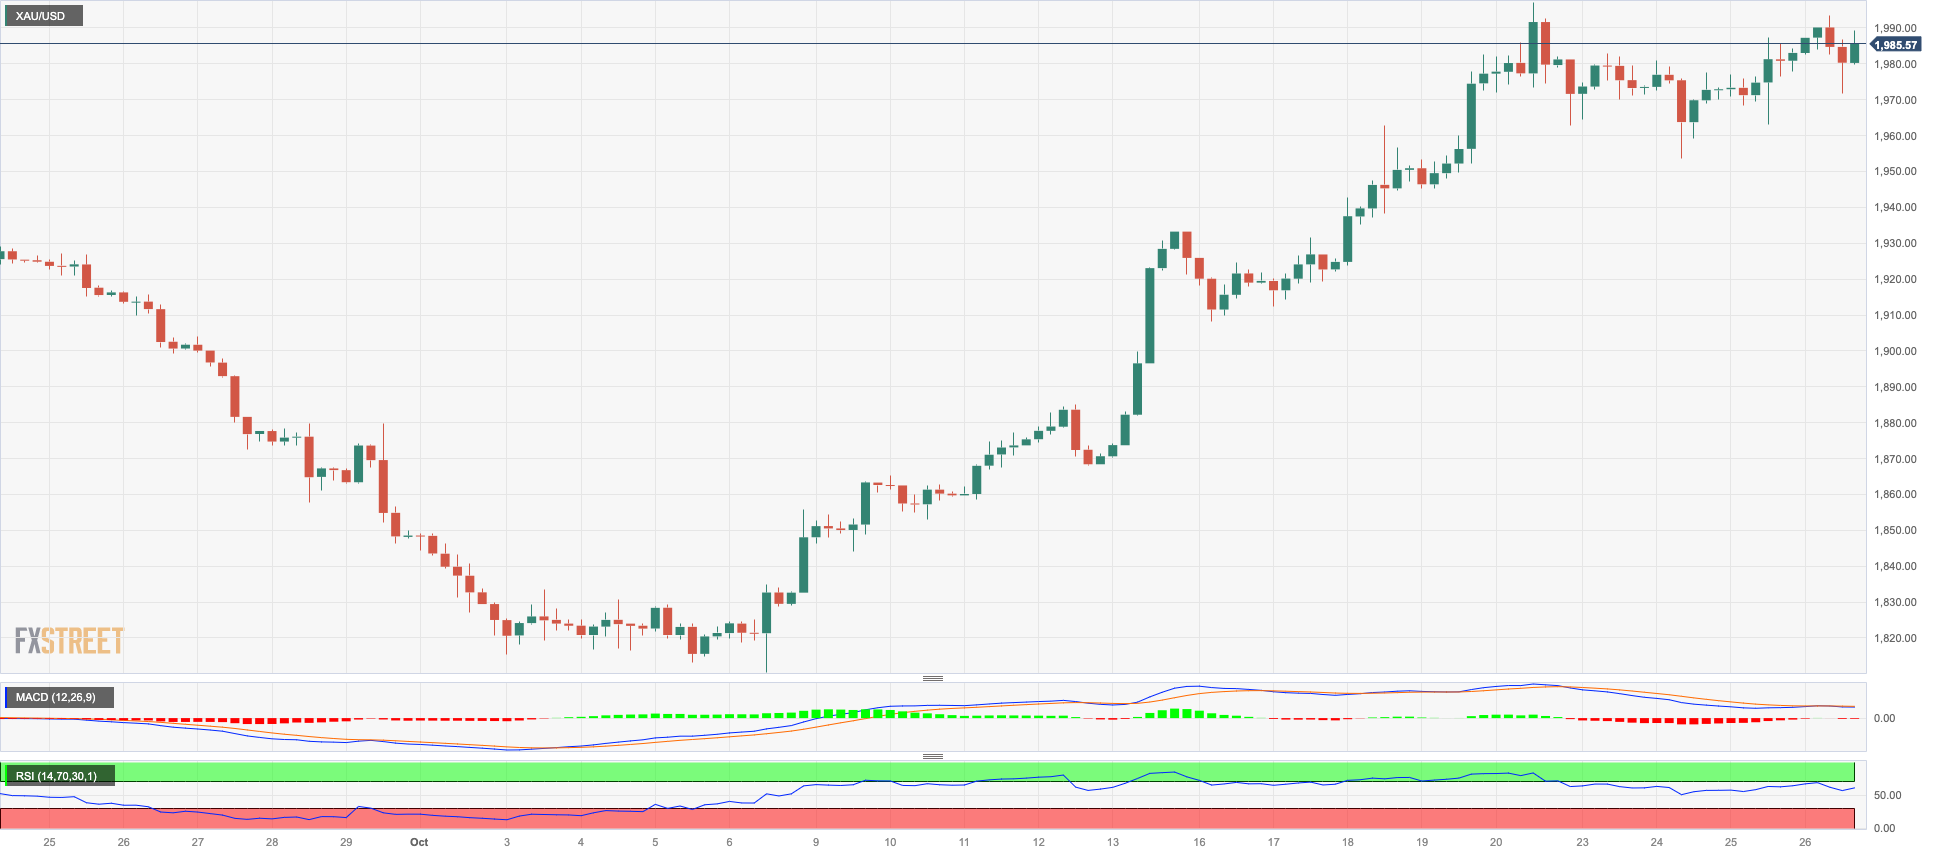
Gold prices added to Wednesday’s positive performance and maintained the trade above the $1980 region per troy ounce on Thursday.
Prices of the yellow metal rose further, underpinned by escalating concerns around the crisis in the Middle East, while it managed well to overcome further gains in the greenback and another daily advance in US yields across the curve.
Moving forward, bullion is expected to find extra support on the back of geopolitical fears, while the tighter-for-longer stance from the Fed could limit its upside potential somewhat.
Gold prices could break through the next upward barrier at the October top of $1997 (October 20), just ahead of the critical $2000 mark. From here, the 2023 top of $2067 (May 4) might be challenged, followed by the 2022 peak of $2070 (March 8) and the all-time high of $2075 (August 7, 2020). On the other hand, the 200-day SMA at $1932 provides immediate support, which is reinforced by the intermediate 55-day SMA at $1909 and comes ahead of the October low of $1810 (October 6). If the latter fails, the 2023 low of $1804 (February 28) may be revisited before the key contention zone of $1800 is reached.
Resistance levels: $1997 $2022 $2048 (4H chart)
Support levels: $1953 $1908 $1867 (4H chart)
CRUDE WTI
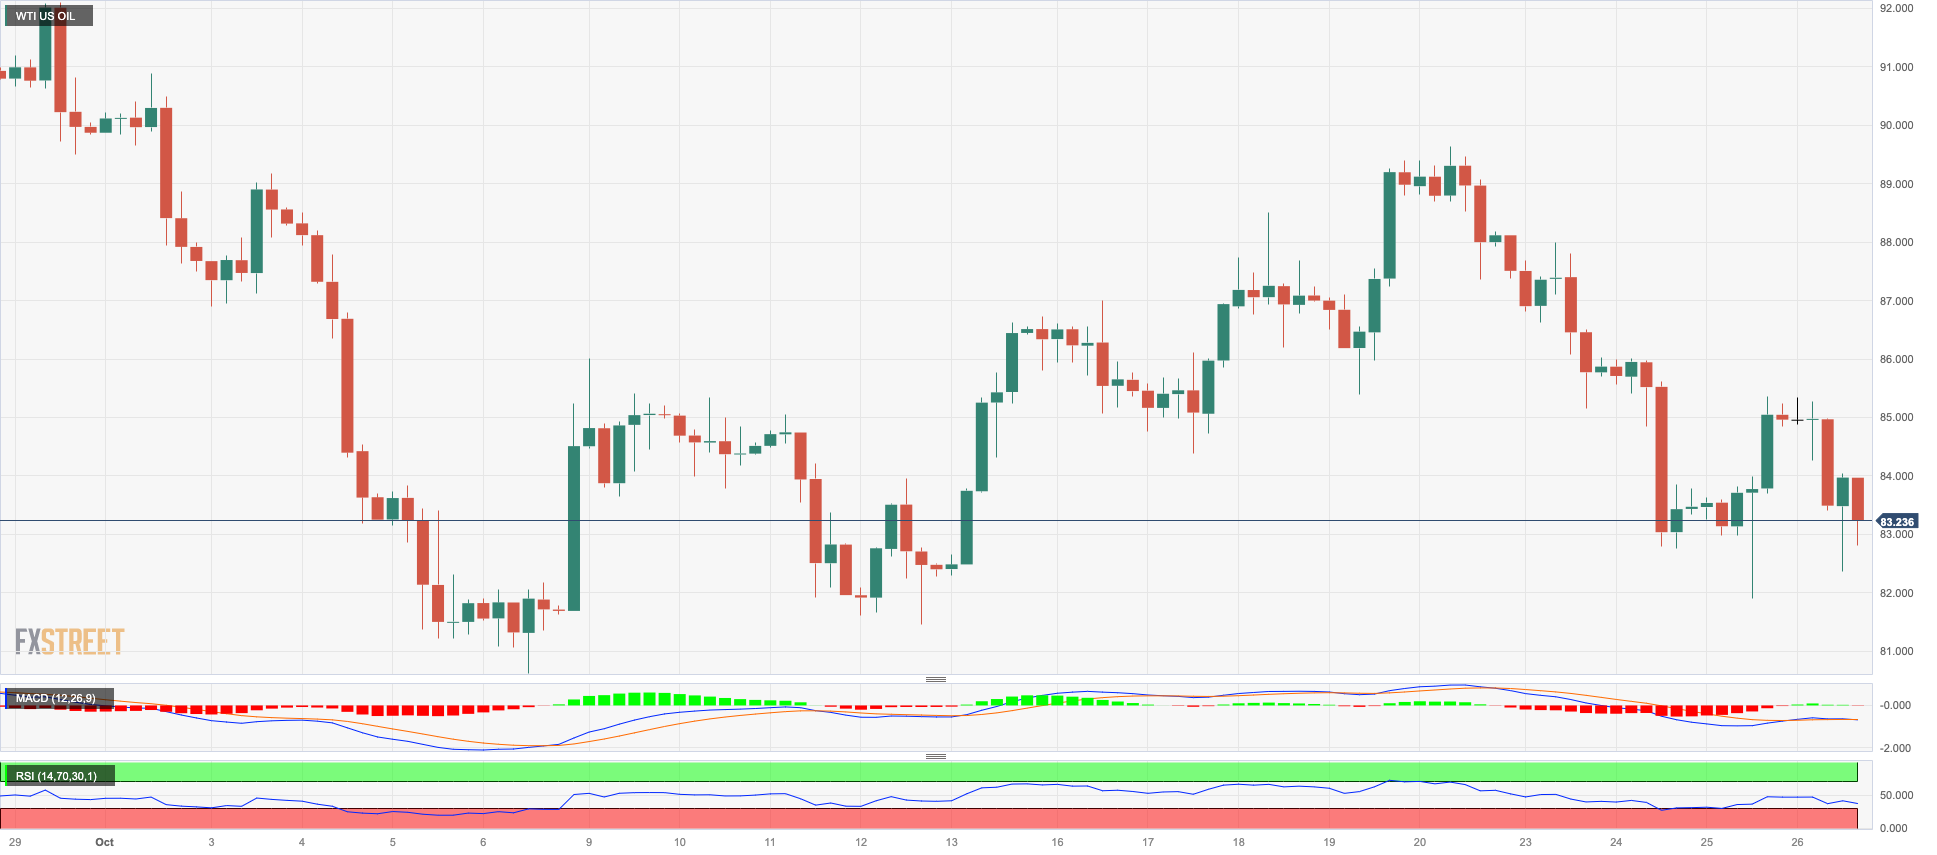
Prices of WTI resumed the decline on Thursday on the back of increasing concerns over the global economic outlook, while stronger-than-expected US Q3 GDP figures seem to have reinforced the view of the Fed’s tighter-for-longer stance.
Somewhat limiting the downside in the commodity emerged escalating geopolitical concerns in the Middle East and the potential implications for crude oil supply in case the crisis spread to other regions.
In addition, the persistently stronger dollar also contributed to the sour mood among traders on Thursday.
Further decline in WTI could revisit the October low of $81.56 (October 6) ahead of the key $80.00 mark and the critical 200-day SMA at $78.11. The breach of this region could prompt a test of the August low of $77.64 (August 24) to re-emerge on the horizon prior to the weekly low of $73.89 (July 17) and the key $70.00 mark per barrel. If this round level is broken, the June low of $66.85 (June 12) will be disclosed, followed by the 2023 low of $63.61 (May 4) and the crucial $60.00 per barrel. On the other hand, the weekly high of $89.83 (October 18) comes next before the 2023 peak of $94.99 (September 28). Another weekly high appears at $97.65 (August 30, 2022), barely under the psychological $100.00 threshold.
Resistance levels: $85.55 $88.00 $89.82 (4H chart)
Support levels: $82.06 $81.47 $79.31 (4H chart)
GER40
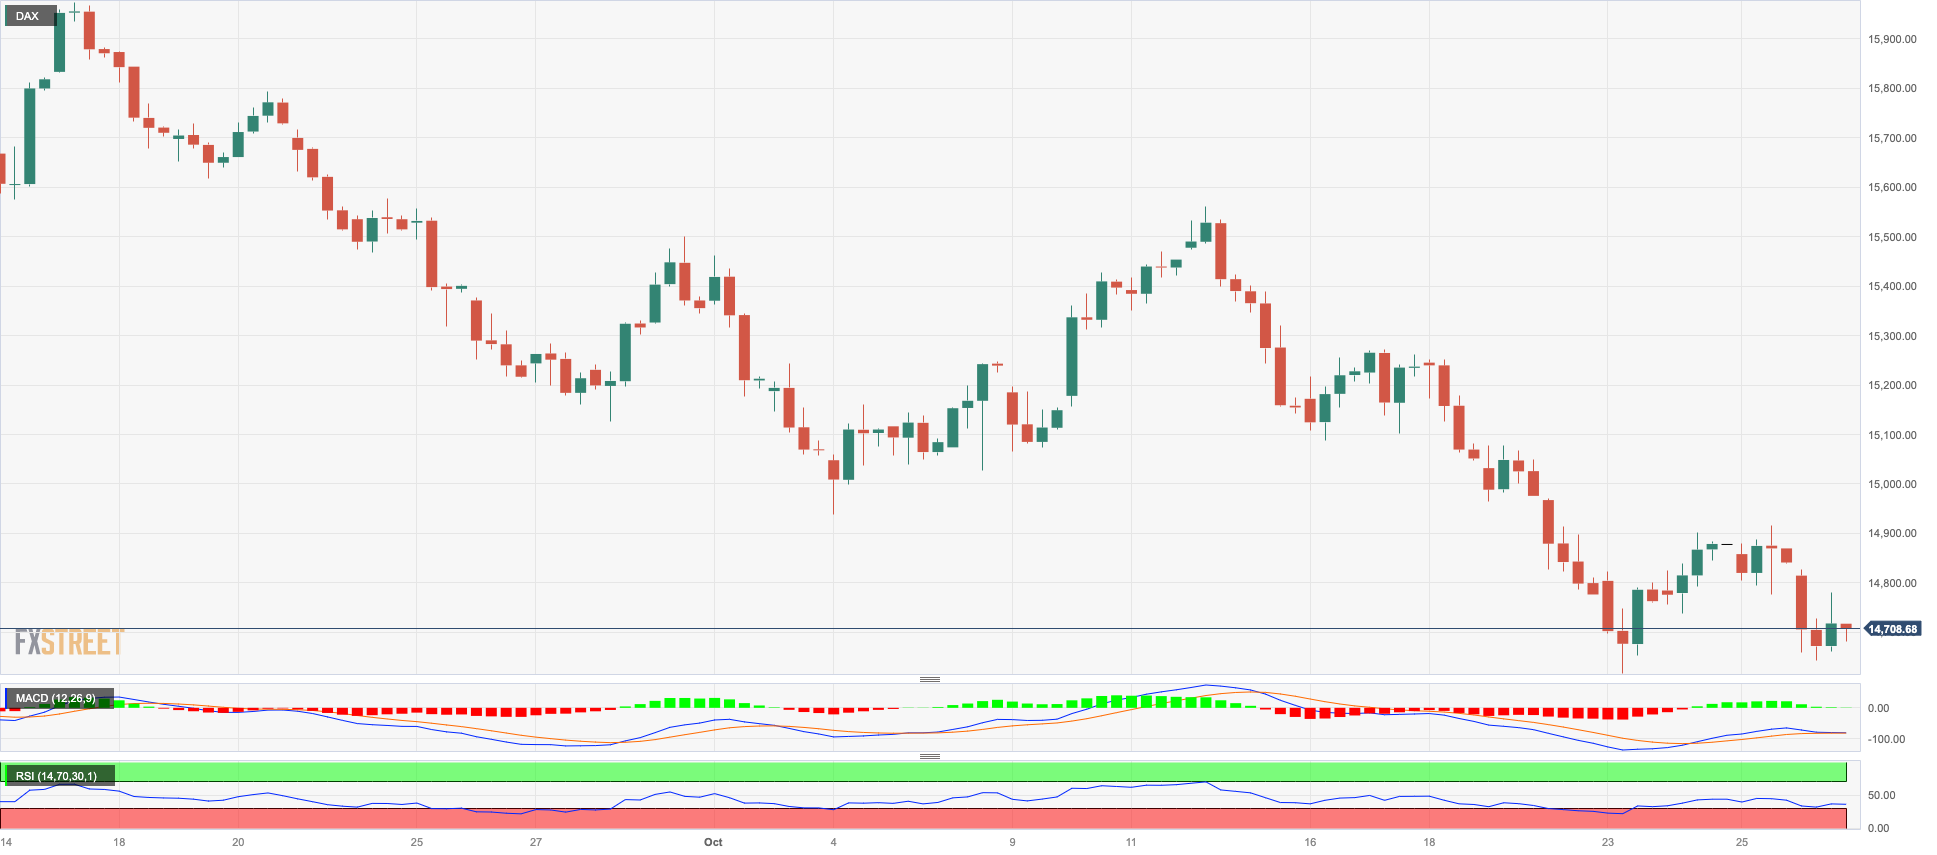
European stock markets closed within a “sea of red” on Thursday.
Against that gloomy backdrop, the German DAX40 retreated to three-day lows near the 14600 zone on the back of the prevailing risk-off sentiment in the global markets, as the conflict in the Middle East appears to get worse before it gets better.
In addition, disheartening results from corporate earnings reports did not help the sentiment either, while the ECB showed increasing worries over the economic outlook in the region after the central bank kept its interest rates unchanged on Thursday.
The marked pullback in the index came in tandem with a decline in 10-year bund yields to the 2.85% zone.
The return of the negative trend might send the DAX40 down to the October low of 14630 (October 23). The breakdown of this area might disclose the March bottom of 14458 (March 20) before the December 2022 low of 13791 (December 20) and the 2022 low of 11862 (September 28). Instead, the first upward obstacle is the October high of 15575 (October 12), which is just ahead of the crucial 200-day SMA of 15647. Further north, the September peak of 15989 (September 15) may be seen, followed by weekly peaks of 16042 (August 31) and 16060 (August 10). If this barrier is breached, the index may challenge its all-time top of 16528 (July 31). The daily RSI retreated to the boundaries of 32.
Best Performers: Infineon, Rheinmetall AG, BASF
Worst Performers: Siemens Energy AG, Mercedes Benz Group, Siemens AG
Resistance levels: 14933 15288 15575 (4H chart)
Support levels: 14630 14458 13791 (4H chart)
NASDAQ
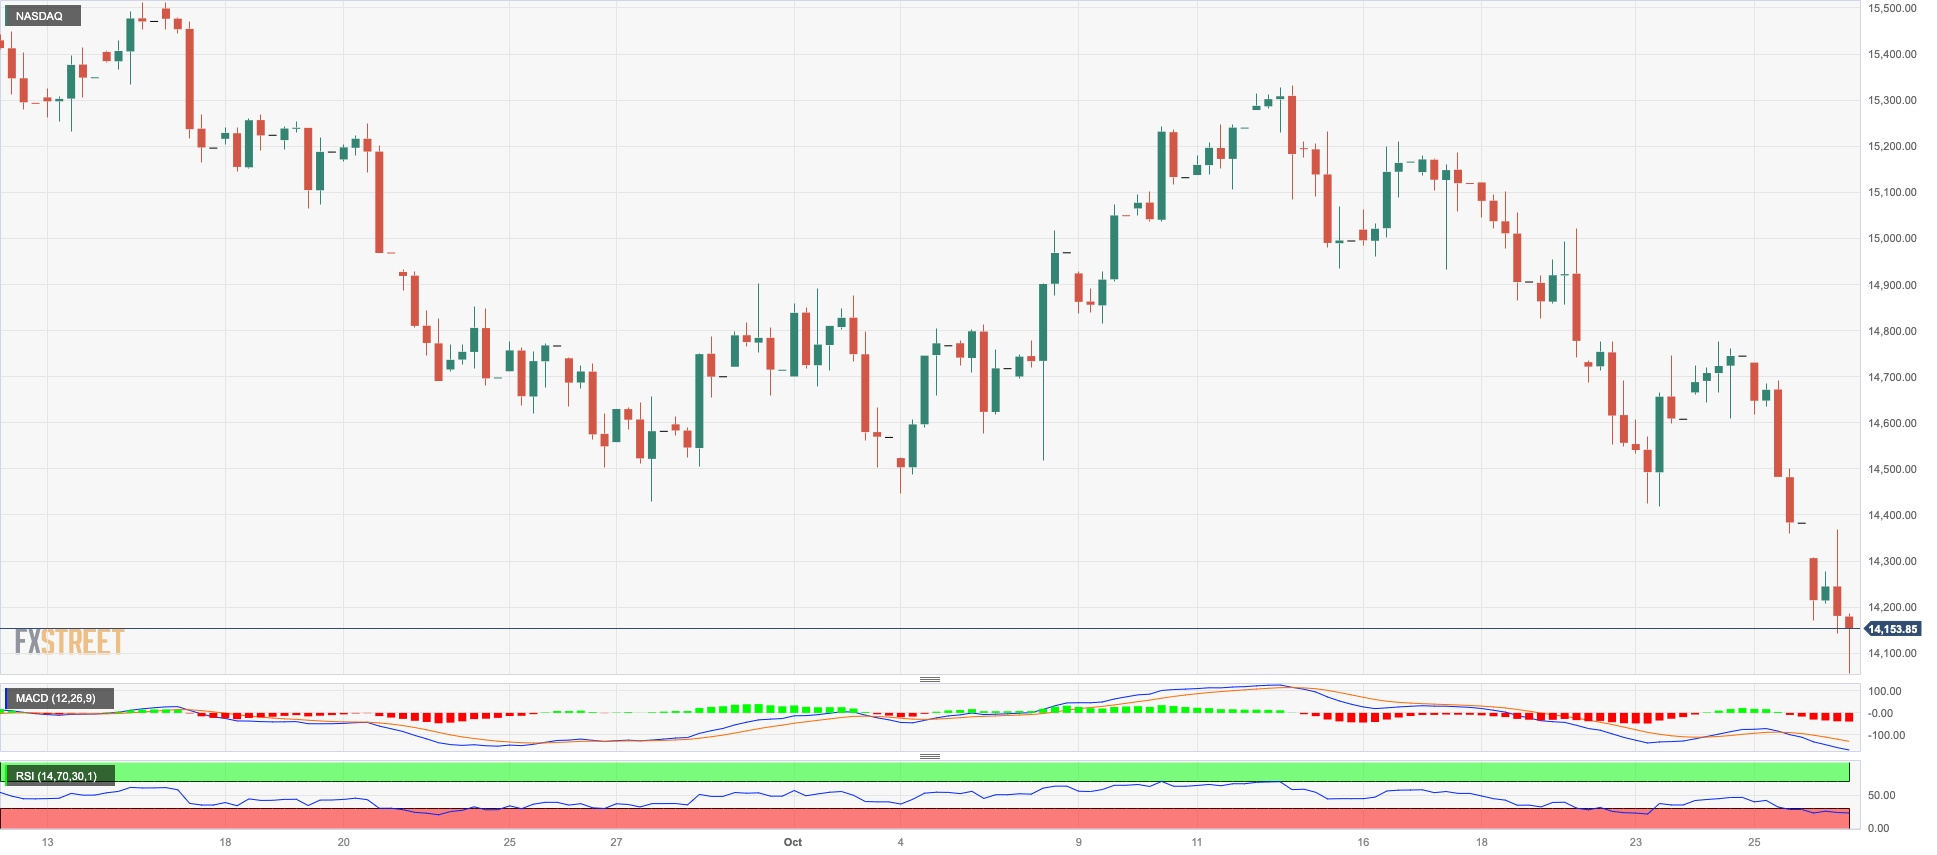
In line with the rest of the US markets, tech stocks gauged by the Nasdaq 100 collapsed to levels last traded in late May, just above the 14000 threshold on Thursday.
The stronger dollar, disappointing news from corporate earnings reports, and the perception that the Fed’s tighter-for-longer stance could extend for a longer period all weighed on the tech sector on Thursday.
If sellers remain in control, the Nasdaq 100 should find quick support at the key 200-day SMA of 13912. After clearing this zone, the market may return to the April low of 12724 (April 25), then to the March low of 11695 (March 13), and finally to the 2023 low of 10696 (January 6). In contrast, there is immediate resistance at the October high of 15333 (October 12), which is followed by the September top of 15618 (September 1) and the weekly peak of 15803. (July 31). If the index breaks above this level, it might challenge the 2023 top of 15932 (July 19). The daily RSI grinded lower to the sub-32 zone.
Top Gainers: O’Reilly Automotive, JD.com Inc Adr, Baker Hughes
Top Losers: Align, The Trade Desk, Comcast
Resistance levels: 14774 15086 15333 (4H chart)
Support levels: 14063 13520 12724 (4H chart)
DOW JONES
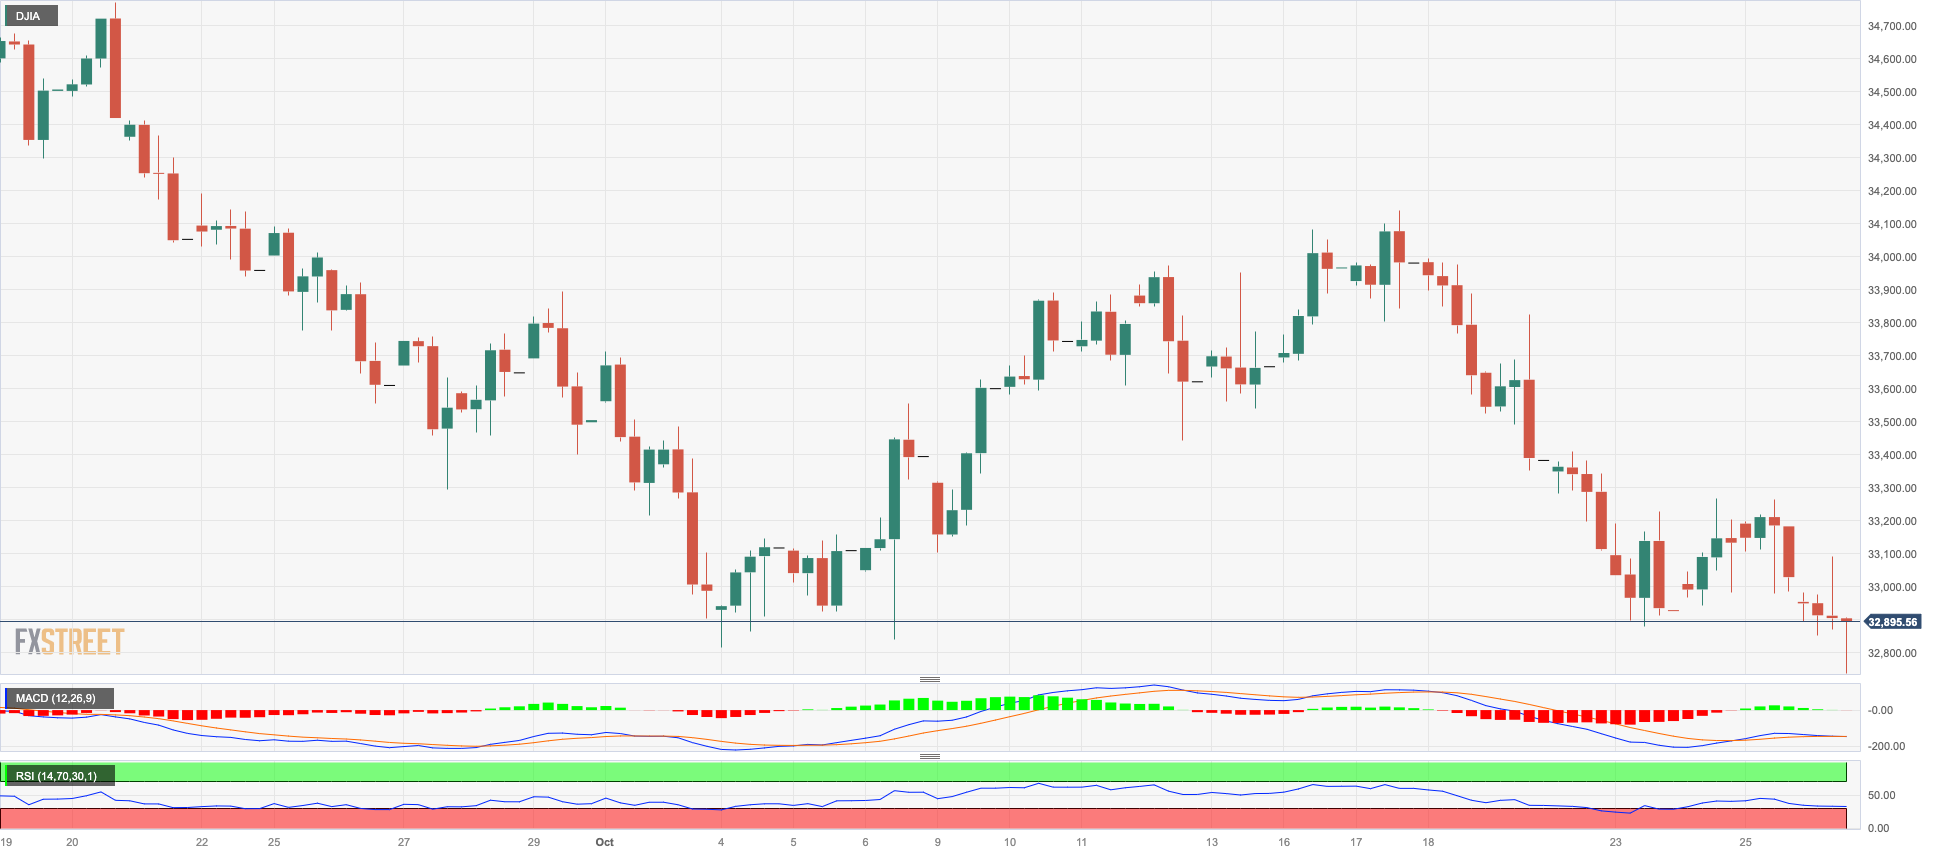
US stocks measured by the Dow Jones dropped markedly and revisited the 32800 region for the first time since late May.
The second consecutive daily drop in the index came on the back of reignited concerns that the Federal Reserve might keep its restrictive stance for longer than previously anticipated.
In fact, those fears were exacerbated on Thursday after auspicious flash prints from US Q3 GDP, which showed that the economy is nowhere near a recession.
Overall, the Dow Jones deflated 0.76% to 32784, the S&P500 dropped 1.28% to 4133, and the tech-heavy Nasdaq Composite retreated 2.05% to 12558.
Further decline may send the Dow Jones to its May low of 32586 (May 25) prior to the 2023 low of 31429 (March 15). Instead, the first upward obstacle is identified at the critical 200-day SMA of 33820,ahead of the October high of 34147 (October 17). A move higher should challenge the 100-day SMA at 34304, before the September top of 34977 (September 14) and the weekly peak of 35070 (August 31), all preceding the 2023 high of 35679 (August 1). The day-to-day RSI sank below the 33 level.
Top Performers: IBM, Merck&Co, Verizon
Worst Performers: Microsoft, Nike, Apple
Resistance levels: 34147 34304 34977 (4H chart)
Support levels: 32781 32586 31429 (4H chart)
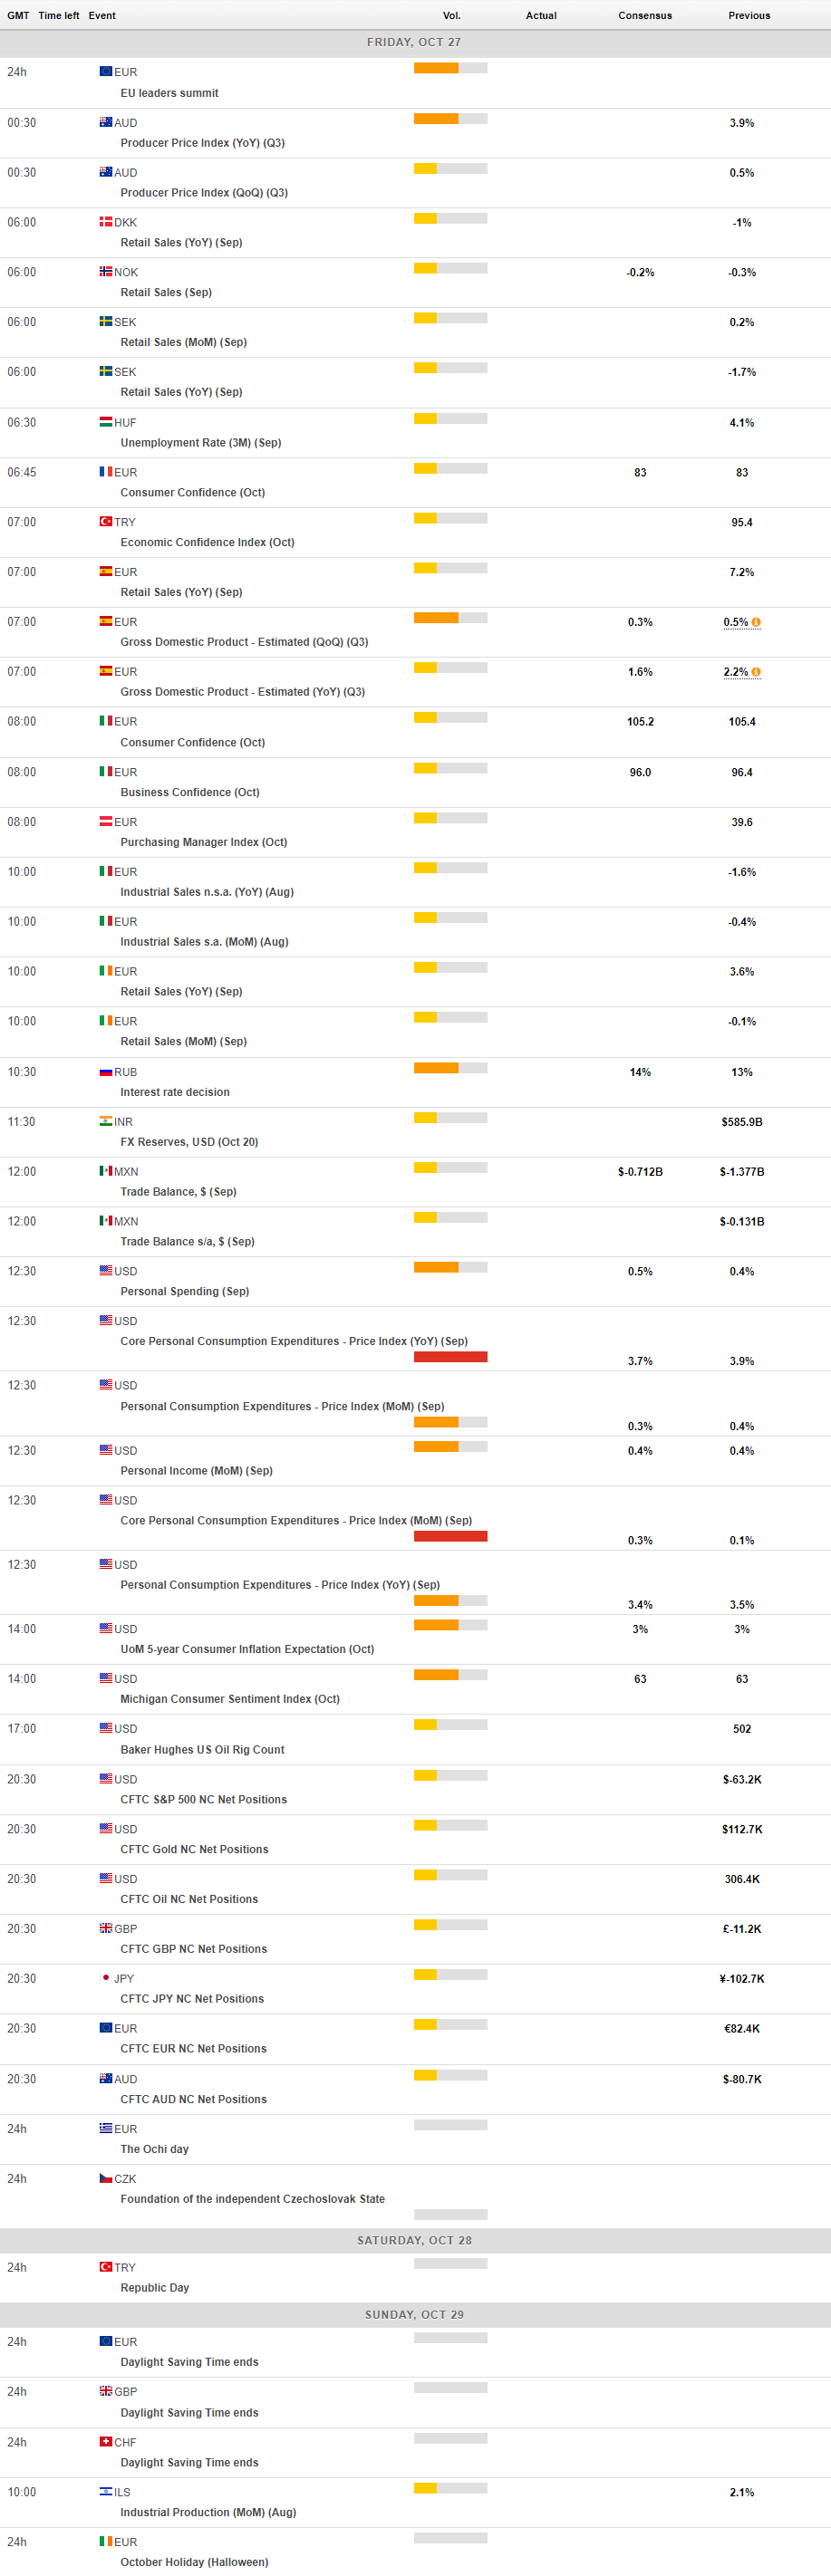
MACROECONOMIC EVENTS
All Information & Updates provided by:

All information relating to the financial markets available on this page has been prepared and issued by FXStreet (Forexstreet SL, Spain, Reg: B62498233) on the basis of publicly available information and all information believed to be reliable and does not conflict with Kuwaiti local laws, and all necessary care has been taken to before the company to ensure that the facts mentioned are correct from the source.
NCM Investment nor any of its directors or employees shall in any way be held responsible for the contents of this news, and the information contained on this page is intended only to provide clients with publicly available information and should not be construed as investment advice, report or analysis and/or constitute an offer or invitation to buy or sell financial instruments of any kind.
RISK WARNING: Forex and CFDs are highly risky leveraged products, as losses can exceed deposits. Please ensure you understand all the risks and take independent advice if necessary. NCM will segregate the clients based on the criteria of the regulator and its bylaws. NCM does not provide any advisory service; the material published does not constitute advice or a recommendation for a transaction in any financial instrument. NCM accepts no responsibility for any use of the content presented and any consequences of that use. Anyone acting on the information provided does so at their own risk.