
- Contact Us:
-

-

-

-


Daily Market Updates
30 Oct 2023
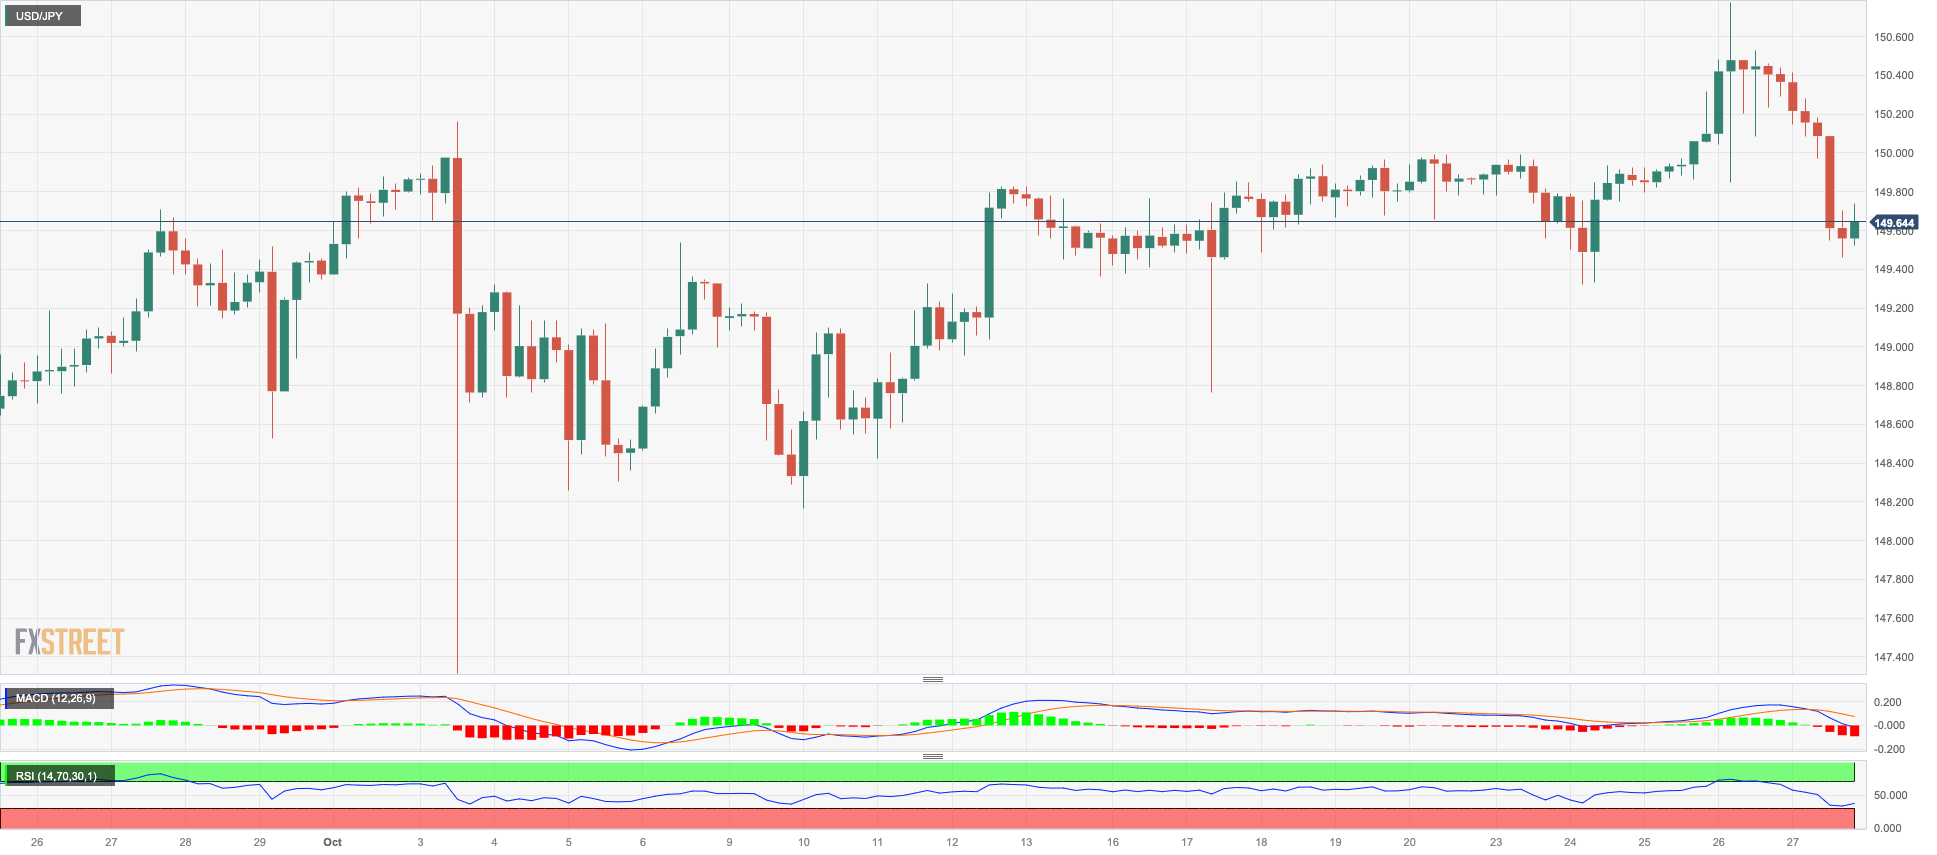
USDJPY
USD/JPY retreated markedly to three-day lows in the mid-149.00s at the end of the week.
The daily pullback came in response to further weakness in US yields in the 2-year/10-year segment vs. a small uptick in the JGB 10-year yields, which remained close to the 0.90% region.
In addition, omnipresent fears of FX intervention by the BoJ or the government also seem to have undermined the weekly move higher in the pair, particularly when it trades around the key 150.00 hurdle.
Moving forward, investors continue to see some form of tweaking of the YCC programme at the BoJ’s next monetary policy gathering.
There were no data releases scheduled in the “Land of the Rising Sun” on Friday.
Further USD/JPY gains aim for the YTD peak of 150.77 (October 26), followed by the 2022 top of 151.94 (October 21) and the round level of 152.00. The most recent challenger, in comparison, appears to be the weekly low of 148.16 (October 10), which is ahead of the transitory 55-day SMA at 147.95 and the October low of 147.27 (October 3). The weekly low of 145.89 (September 11) is aligned farther down, ahead of the September low of 144.43 (September 1). There are no significant support levels beyond that until the August low of 141.50 (August 7), which is above the 200-day SMA at 139.85 and the July low of 137.23 (July 14). The daily RSI sank below the 55 yardstick.
Resistance levels: 150.77 151.94 152.00 (4H chart)
Support levels: 149.45 149.32 148.73 (4H chart)
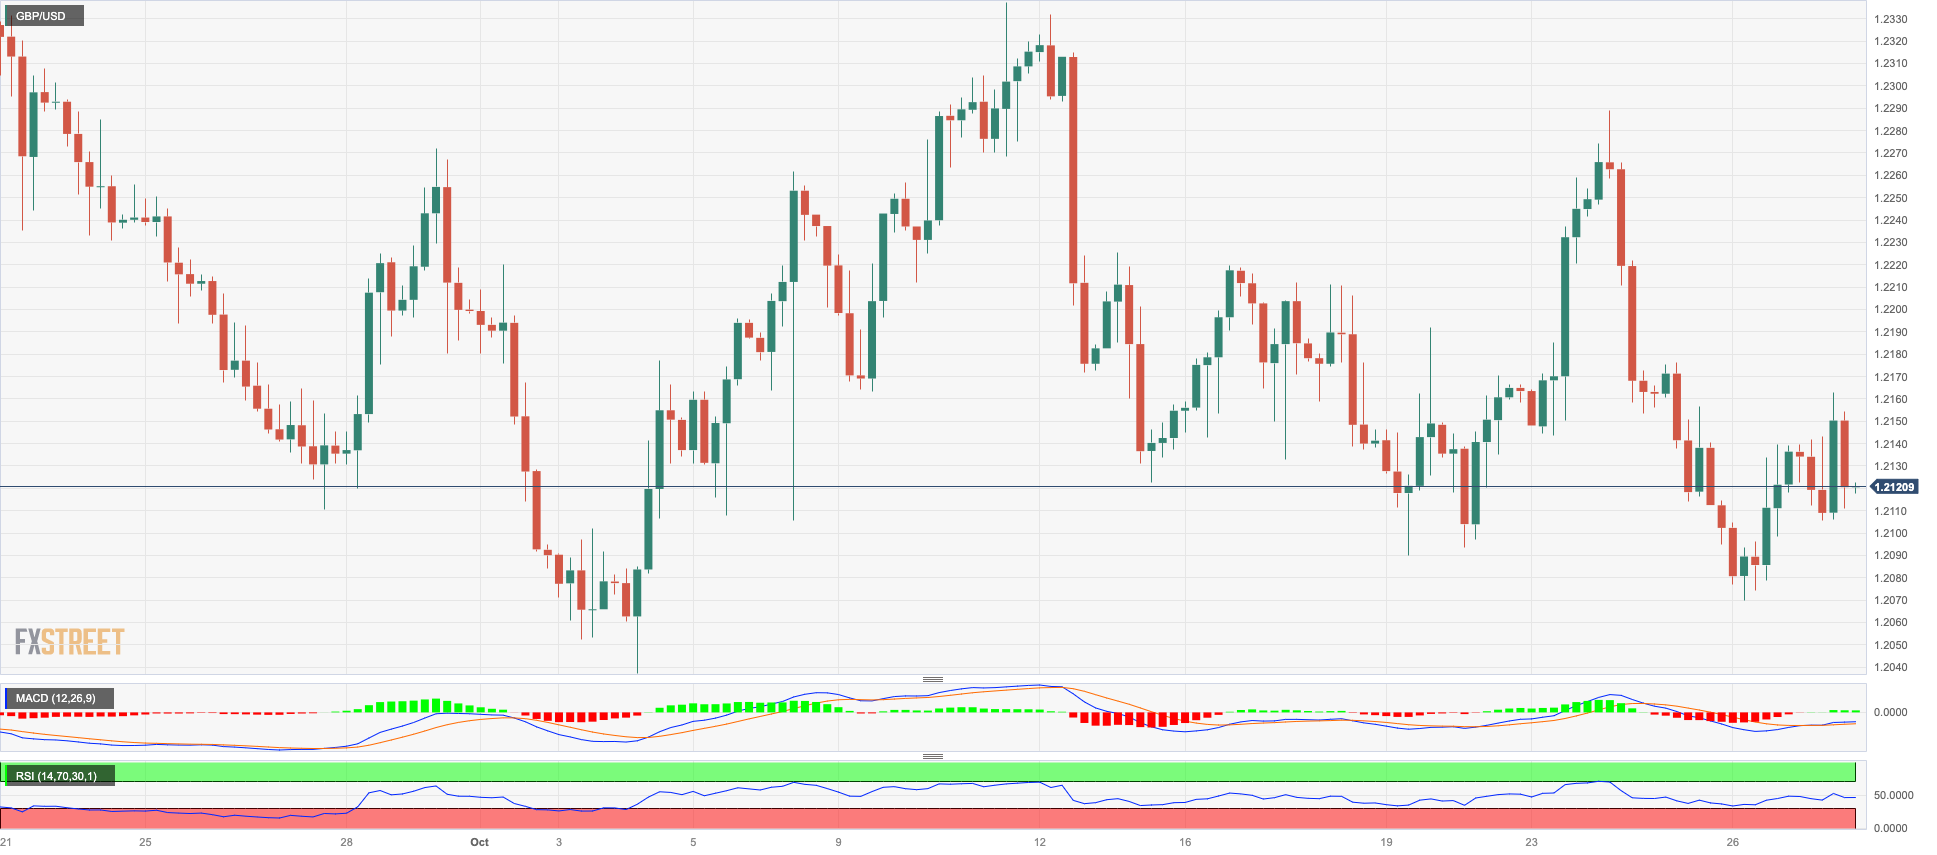
GBPUSD
GBP/USD could not sustain the early move to two-day highs around 1.2160 and later succumbed to the selling pressure and the generalized better tone in the greenback.
That said, Cable ended the week around the 1.2120 region in a context dominated by a persistent risk-off mood in response to escalating geopolitical concerns, while speculation that the BoE might keep its policy rate unchanged at its upcoming meeting also weighed on the quid.
The UK calendar remained empty at the end of the week.
If the selling trend continues, GBP/USD might retest the October bottom of 1.2037 (October 3), prior to the psychologically 1.2000 barrier, as well as the 2023 low of 1.1802 (March 8). Cable's initial resistance level is the October high of 1.2337 (October 11), followed by the 200-day SMA at 1.2437. Above this level, the weekly top of 1.2548 (September 11) beckons, followed by the transitory 100-day SMA at 1.2568. Once cleared, the pair could revisit the weekly high of 1.2746 (August 30), followed by 1.2818 (August 10), and 1.2995 (July 27), all preceding the psychological 1.3000 threshold. The daily RSI dropped below 41.
Resistance levels: 1.2162 1.2229 1.2288 (4H chart)
Support levels: 1.2069 1.2037 1.1802 (4H chart)
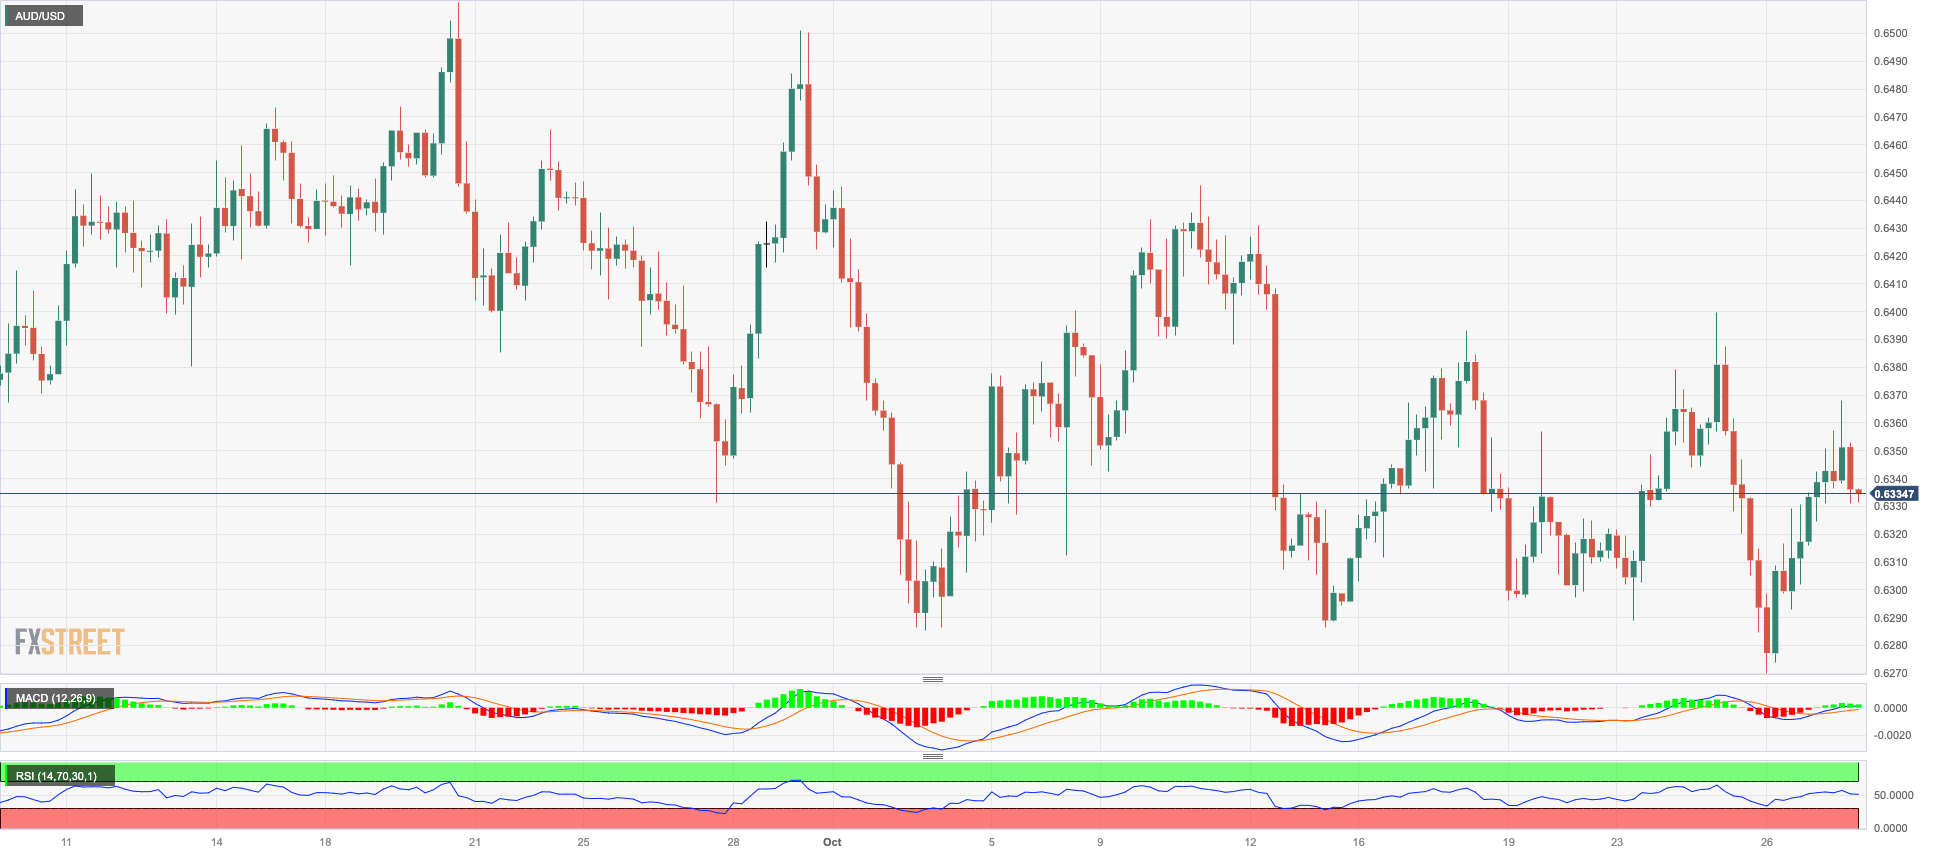
AUDUSD
AUD/USD added to Thursday’s advance and managed to revisit the 0.6370 zone before giving away part of those gains and ending Friday’s session around 0.6330.
The positive performance of copper prices and iron ore helped the Aussie dollar extend the optimism in the second part of the week, despite the intense bounce in the greenback.
Data-wise Down Under, Producer Prices rose 1.8% QoQ in the July-September period and 3.8% from a year earlier.
If bears seize control, the AUD/USD may touch the 2023 bottom of 0.6270 (October 26) before testing the round level of 0.6200 and the 2022 low of 0.6179 (October 13). The immediate barrier on the upswing is the October top of 0.6445 (October 11), prior to the weekly peak of 0.6501 (September 29) and the September high of 0.6521 (September 1). Extra gains can target the temporary 100-day SMA at 0.6534 before the weekly top of 0.6616 (August 10) and the 200-day SMA at 0.6637. Further advances may push the pair to its July peak of 0.6894 (July 14), then to its June high of 0.6899 (June 16), and finally to the key 0.7000 barrier. The RSI on a daily basis ticked higher and approached the 46 level.
Resistance levels: 0.6367 0.6399 0.6445 (4H chart)
Support levels: 0.6270 0.6210 0.6169 (4H chart)
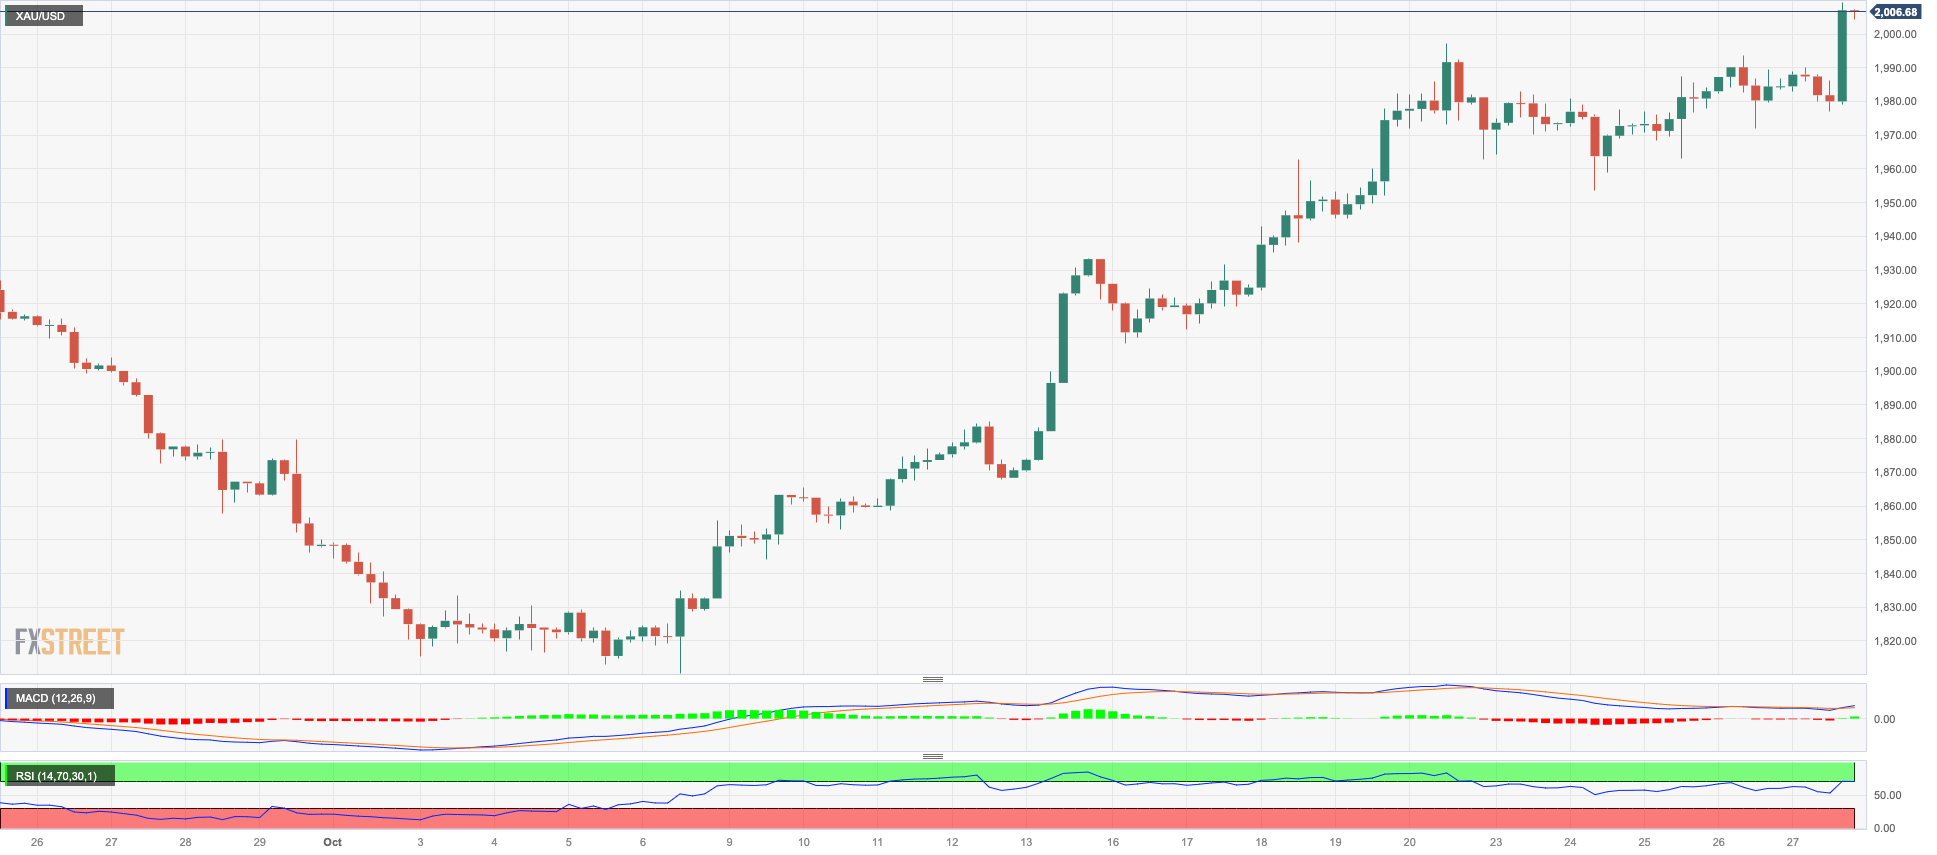
GOLD
Gold prices extended their monthly needle-like rally and advanced to levels last seen in mid-May past the critical $2000 mark per troy ounce on Friday, closing at the same time its third consecutive week of gains.
Rising geopolitical fears in the Middle East and the likelihood that the conflict might spread to neighbouring regions lent extra legs to the precious metal, which advanced for the third straight day.
Also collaborating with the upside bias in bullion emerged the late decline in the greenback as well as the knee-jerk in the short end and the belly of the US yield curve.
The continuation of the rebound in gold prices now target the 2023 peak of $2067 (May 4) ahead of the 2022 high of $2070 (March 8) and the all-time top of $2075 (August 7, 2020). On the flip side, the 200-day SMA at $1932 provides immediate support, which is strengthened by the intermediate 55-day SMA at $1911 and comes ahead of the October low of $1810 (October 6). If the latter is breached, the 2023 low of $1804 (February 28) may be revisited before reaching the critical contention zone of $1800.
Resistance levels: $2009 $2022 $2048 (4H chart)
Support levels: $1953 $1907 $1867 (4H chart)
CRUDE WTI
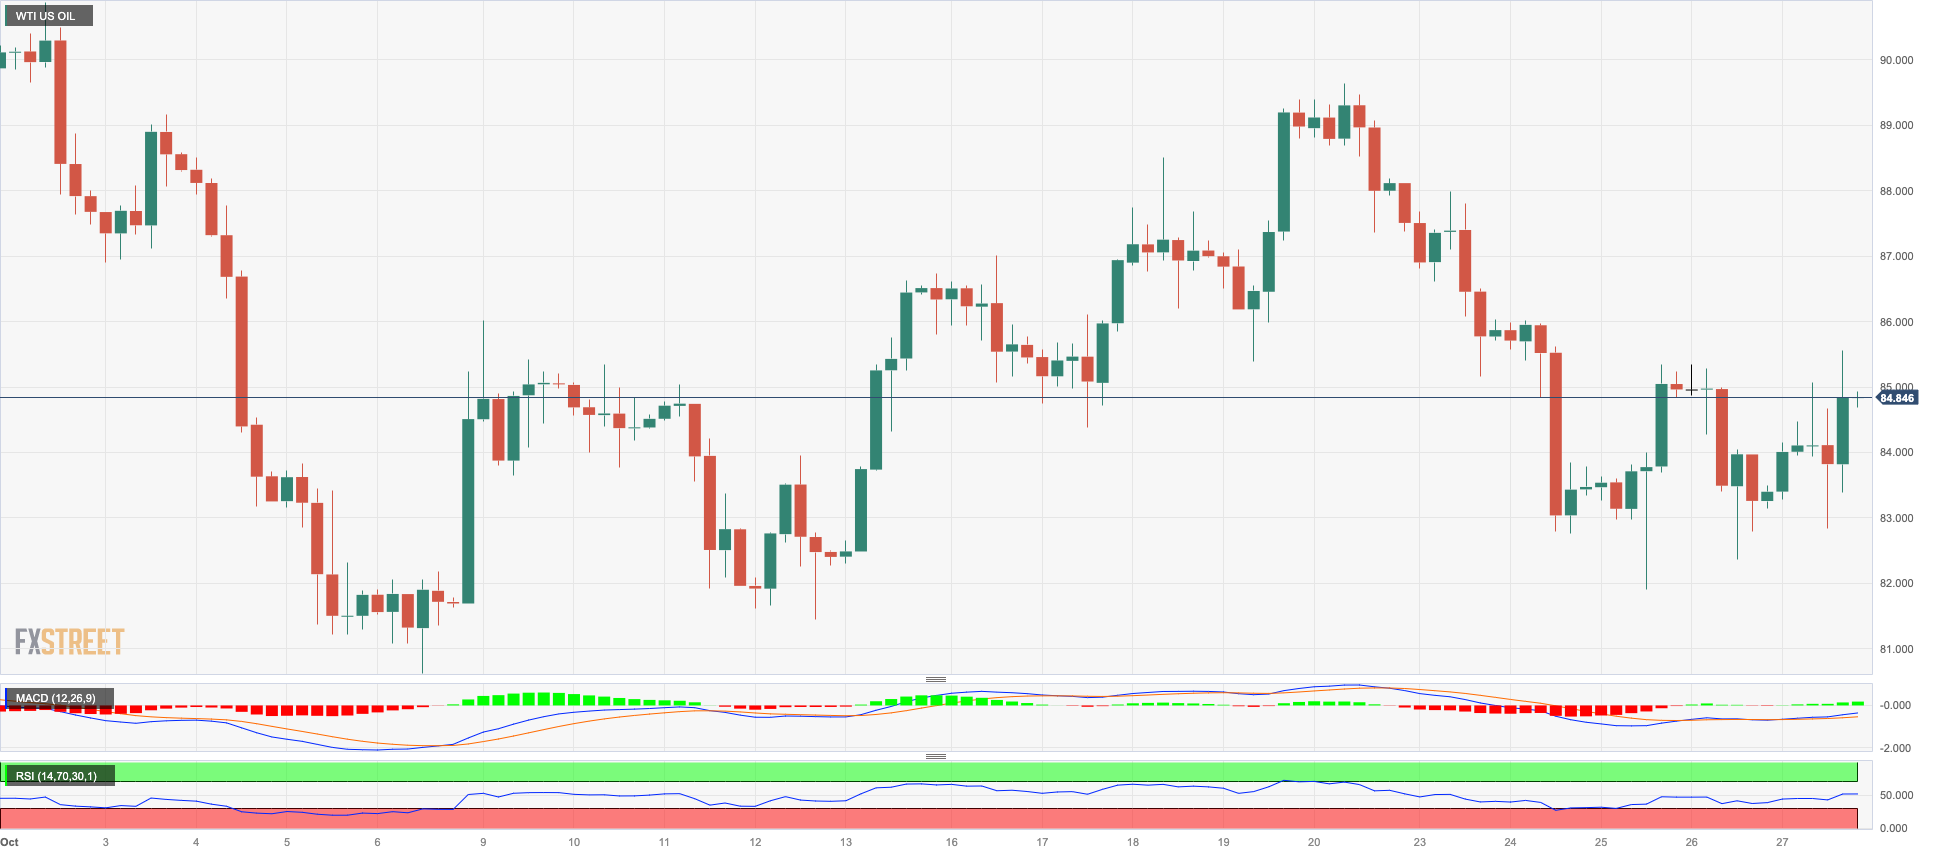
WTI prices extended the erratic performance and reclaimed the area beyond the $85.00 mark per barrel on Friday, rapidly leaving behind Thursday’s daily retracement.
The corrective upside in prices of the American reference for sweet light crude oil came exclusively on the back of the intensification of the crisis in the Middle East and its potential consequences for the supply of the commodity.
In the docket, the total number of US active oil rigs rose by 2 to 504 in the week to October 27, according to driller Baker Hughes.
WTI might fall further, revisiting the October low of $81.56 (October 6), ahead of the important $80.00 level and the pivotal 200-day SMA at $78.13. If this level is breached, a test of the August low of $77.64 (August 24) might reappear on the horizon before the weekly low of $73.89 (July 17) and the important $70.00 mark per barrel. If this round level is breached, the June low of $66.85 (June 12), the 2023 low of $63.61 (May 4) and the critical $60.00 per barrel will be revealed. Having said that, the weekly high of $89.83 (October 18) comes before the 2023 record of $94.99 (September 28). North from here aligns the weekly top of $97.65 (August 30, 2022) prior to the psychological $100.00 mark per barrel.
Resistance levels: $85.85 $87.87 $89.82 (4H chart)
Support levels: $82.06 $81.47 $79.31 (4H chart)
GER40
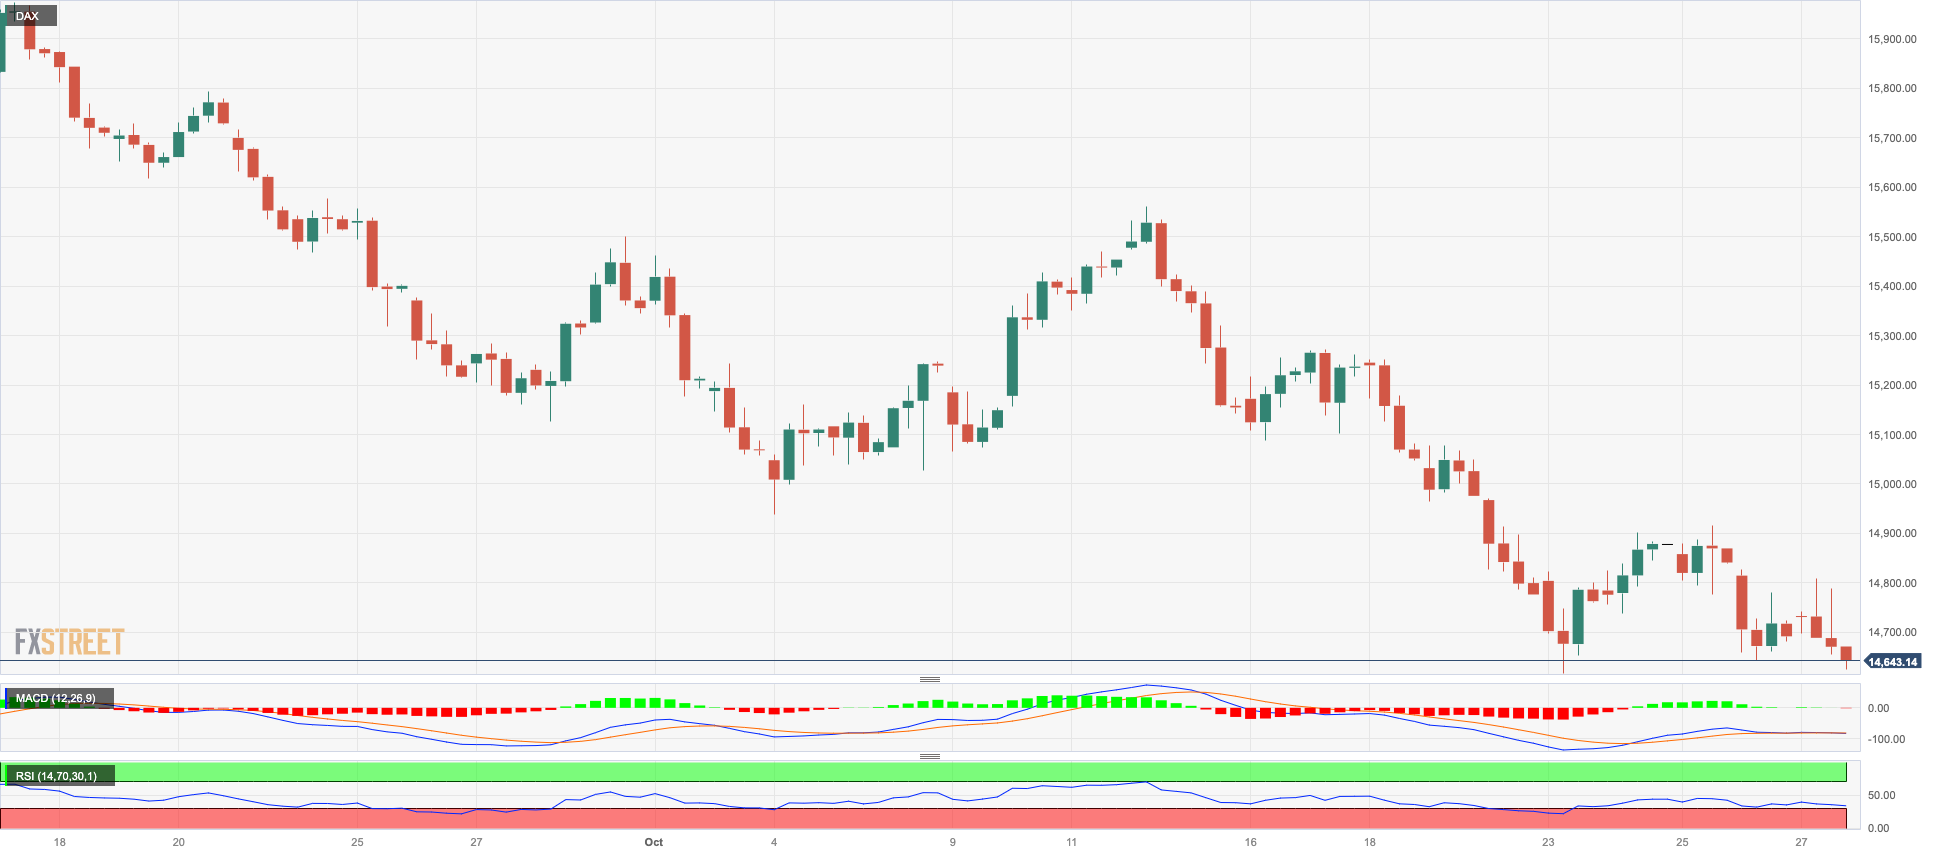
Germany’s benchmark DAX40 added to Thursday’s losses and kept the pessimism in place in the latter part of the week.
The index came under further pressure against the increasingly deteriorating geopolitical backdrop in the Middle East, while disappointing results from corporate earnings reports and the generalized gloomy prospects for economic activity in the region also added to the wide-spread bearish sentiment.
The daily drop in the index was also mirrored by another pullback in the 10-year bund yields, this time approaching the 2.80% region.
The continuation of the downward trend might drive the DAX40 back to its October low of 14630 (October 23). The breakdown of this region may reveal the March bottom of 14458 (March 20) prior to the December 2022 low of 13791 (December 20) and the 2022 bottom of 11862 (September 28). On the opposite side, the initial upward barrier is the October high of 15575 (October 12), which precedes the critical 200-day SMA of 15644. Further north, the September top of 15989 (September 15) is seen, seconded by the weekly peaks of 16042 (August 31) and 16060 (August 10). If this region is trespassed, the index may attempt a move to its all-time high of 16528 (July 31). The daily RSI retreated to the 31 region.
Best Performers: Siemens Energy AG, Sartorius AG VZO, Continental AG
Worst Performers: Covestro, Mercedes Benz Group, MTU Aero
Resistance levels: 14933 15288 15575 (4H chart)
Support levels: 14630 14458 13791 (4H chart)
NASDAQ
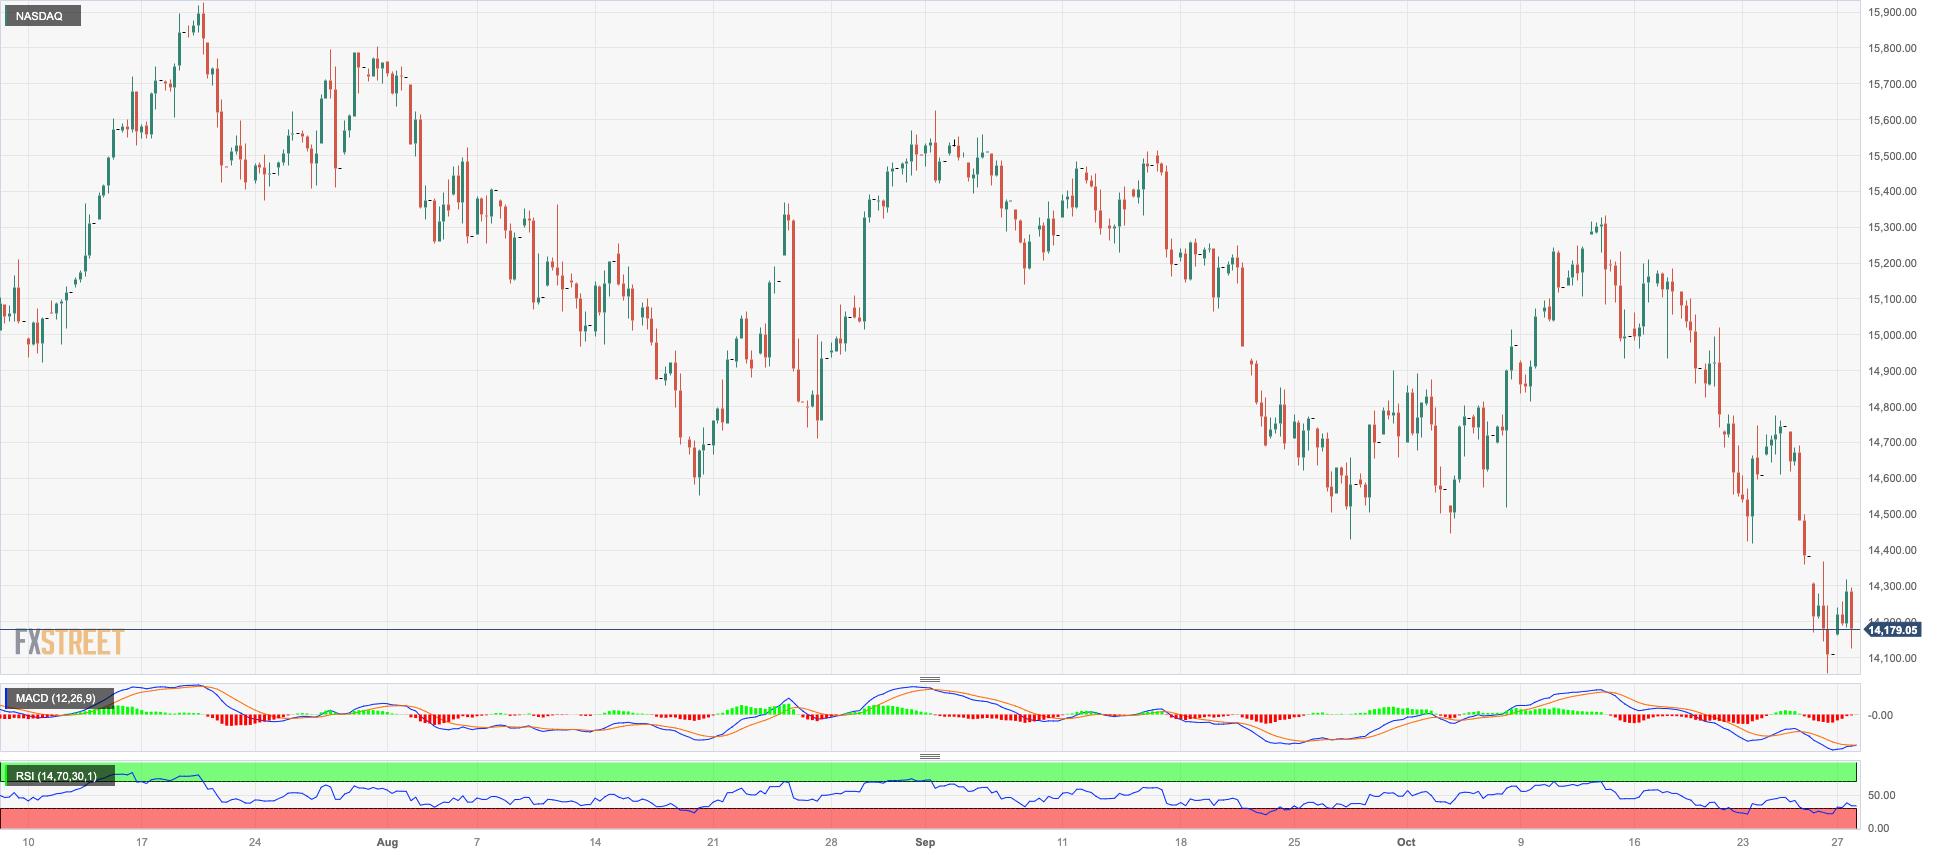
In stark contrast to the rest of its US peers, the tech reference Nasdaq 100 printed decent gains on Friday after two daily declines in a row.
In fact, the tech sector managed well to shrug off broad-based jitters surrounding the geopolitical scenario and found in the outstanding performance of Amazon and Intel a sufficient reason to leave behind part of the recent weakness.
In addition, the small losses in the greenback and the mixed tone in US yields seem to have added to the upside momentum in the tech index.
If sellers maintain control, the Nasdaq 100 should find immediate support at the October low of 14058 (October 26). The loss of this region could put the 200-day SMA of 13926 to the test prior to the April bottom of 12724 (April 25), then to the March low of 11695 (March 13), and lastly to the 2023 low of 10696 (January 6). In contrast, immediate resistance exists at the October high of 15333 (October 12), which is followed by the September top of 15618 (September 1) and the weekly peak of 15803 (July 31). If the index rises above this level, it may dispute the 2023 high of 15932 (July 19). The daily RSI rebounded past 34.
Top Gainers: DexCom, Intel, Amazon.com
Top Losers: Enphase, Charter Communications, Moderna
Resistance levels: 14774 15080 15333 (4H chart)
Support levels: 14058 13520 12724 (4H chart)
DOW JONES
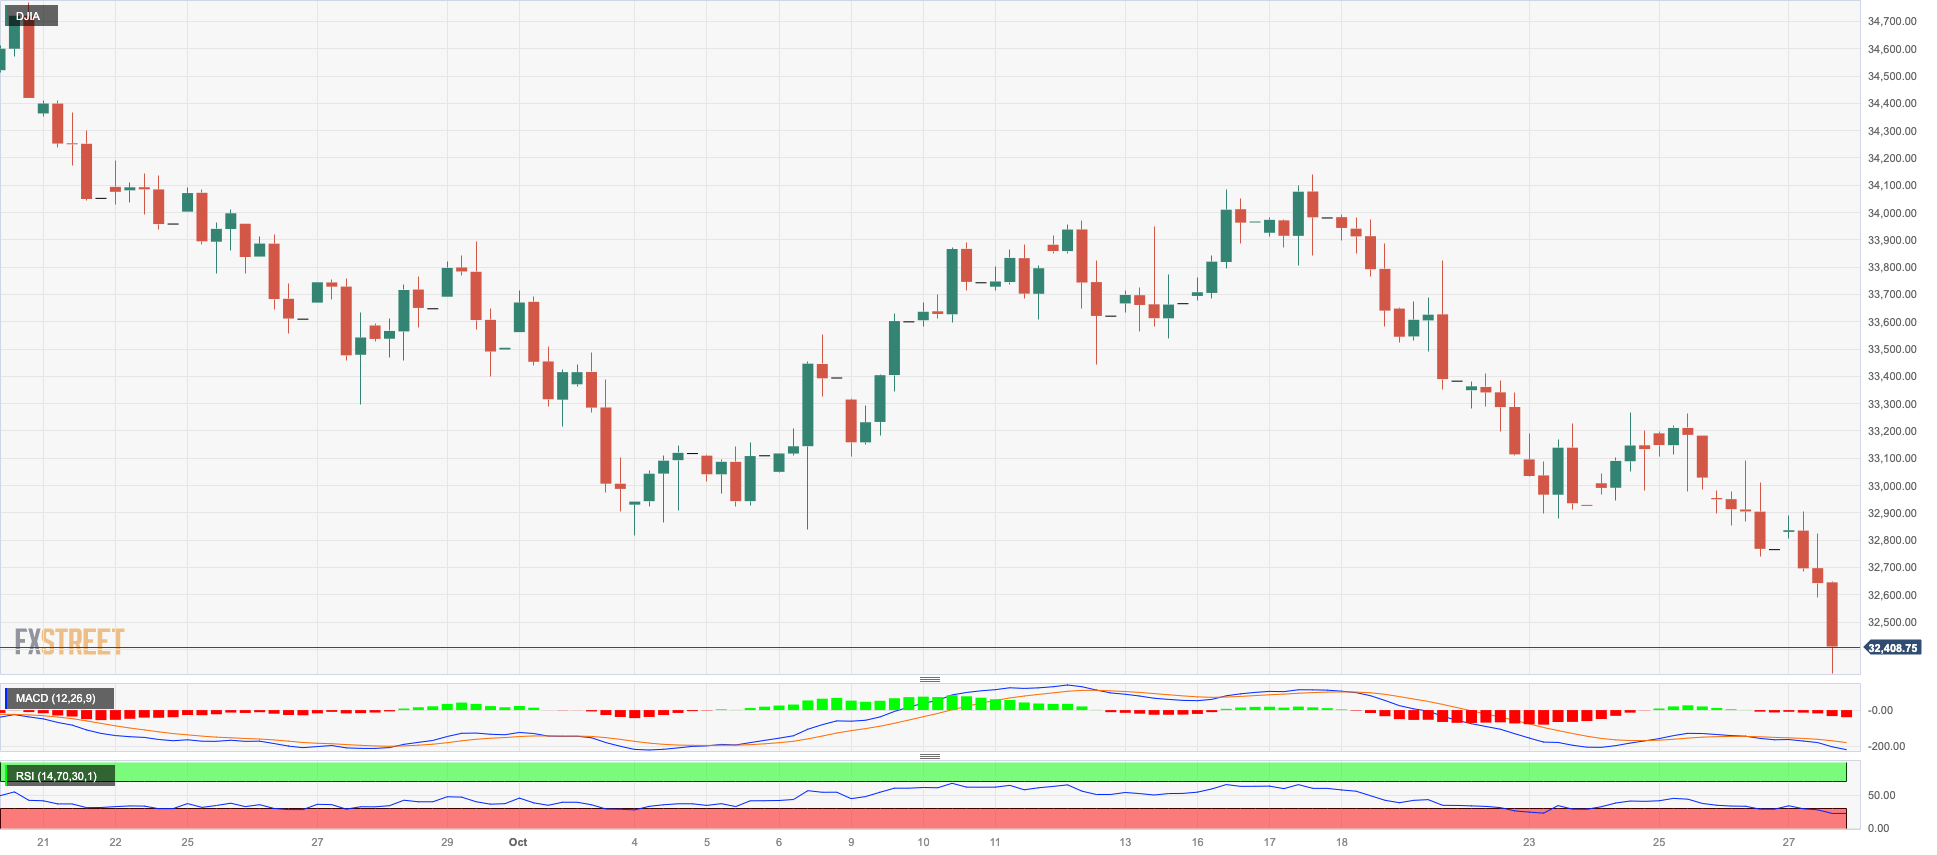
There was no respite for US equities on Friday, as they retreated to levels last traded in late March around 32300 when gauged by the blue-chip index Dow Jones.
Indeed, the index went down for the third straight session on Friday, as investors’ sentiment remained clouded by increasing geopolitical concerns, disheartening corporate earnings reports, mixed yields and the firm perception that the Federal Reserve might keep its restrictive stance for longer than anticipated.
At the end of the week, the Dow Jones retreated 1.12% to 32417, the S&P500 deflated 0.48% to 4117, and the tech-benchmark Nasdaq Composite advanced 0.38% to 12643.
Further declines may lead the Dow Jones to its 2023 bottom of 31429 (March 15) ahead of the 2022 low of 28637 (October 13). Instead, the important 200-day SMA of 33812 emerges as the initial up-barrier, ahead of the October high of 34147 (October 17). A rally north from here should test the intermediate 100-day SMA at 34292 before the September high of 34977 (September 14) and the weekly top of 35070 (August 31), both of which precede the 2023 peak of 35679 (August 1). The everyday RSI entered the oversold territory below 29.
Top Performers: Intel, Apple, Microsoft
Worst Performers: Chevron, JPMorgan, Amgen
Resistance levels: 33272 34147 34300 (4H chart)
Support levels: 32327 31429 30206 (4H chart)
MACROECONOMIC EVENTS

All Information & Updates provided by:

All information relating to the financial markets available on this page has been prepared and issued by FXStreet (Forexstreet SL, Spain, Reg: B62498233) on the basis of publicly available information and all information believed to be reliable and does not conflict with Kuwaiti local laws, and all necessary care has been taken to before the company to ensure that the facts mentioned are correct from the source.
NCM Investment nor any of its directors or employees shall in any way be held responsible for the contents of this news, and the information contained on this page is intended only to provide clients with publicly available information and should not be construed as investment advice, report or analysis and/or constitute an offer or invitation to buy or sell financial instruments of any kind.
RISK WARNING: Forex and CFDs are highly risky leveraged products, as losses can exceed deposits. Please ensure you understand all the risks and take independent advice if necessary. NCM will segregate the clients based on the criteria of the regulator and its bylaws. NCM does not provide any advisory service; the material published does not constitute advice or a recommendation for a transaction in any financial instrument. NCM accepts no responsibility for any use of the content presented and any consequences of that use. Anyone acting on the information provided does so at their own risk.