
- Contact Us:
-

-

-

-


Daily Market Updates
31 Oct 2023
USDJPY
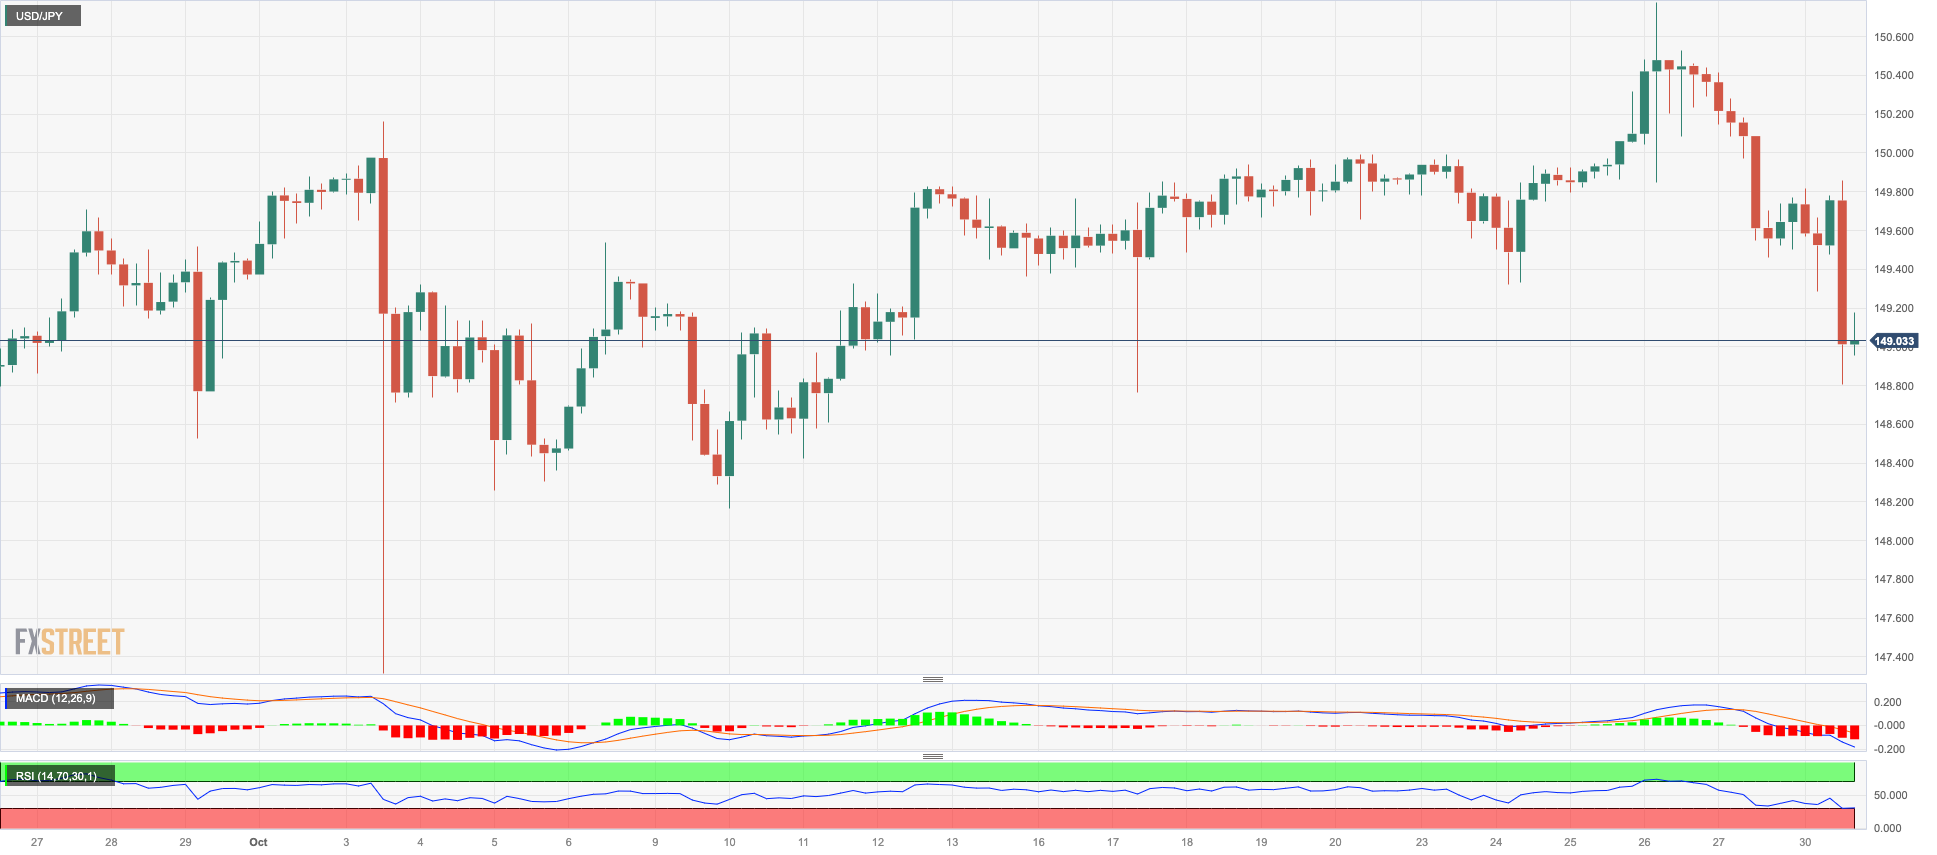
USD/JPY saw Friday’s decline rapidly accelerate and break below the 149.00 support on Monday on the back of rising speculation that the BoJ might tweak its YYC programme at its imminent gathering.
That market chatter around potential announcements from the BoJ was the exclusive driver behind the pair’s drop to two-week lows, in an atmosphere of further weakness in the greenback and an utter absence of traction in US yields across different maturities.
In the Japanese bond market, the JGB 10-year yields flirted with 0.90% for the first time since July 2013.
The Japanese docket was empty on Monday.
Further USD/JPY increases are aimed at the YTD high of 150.77 (October 26), prior to the 2022 top of 151.94 (October 21), and the round level of 152.00. In comparison, the immediate contention emerges at the weekly low of 148.16 (October 10), which is just above the transitory 55-day SMA at 148.03 and the October low of 147.27 (October 3). The weekly low of 145.89 (September 11) is positioned lower, ahead of the September low of 144.43 (September 1). Further down, there are no meaningful support levels until the August low of 141.50 (August 7), which is above the 200-day SMA at 139.95 and the July low of 137.23 (July 14). The daily RSI dropped markedly to the 49 zone.
Resistance levels: 150.77 151.94 152.00 (4H chart)
Support levels: 148.80 148.16 147.27 (4H chart)
GBPUSD
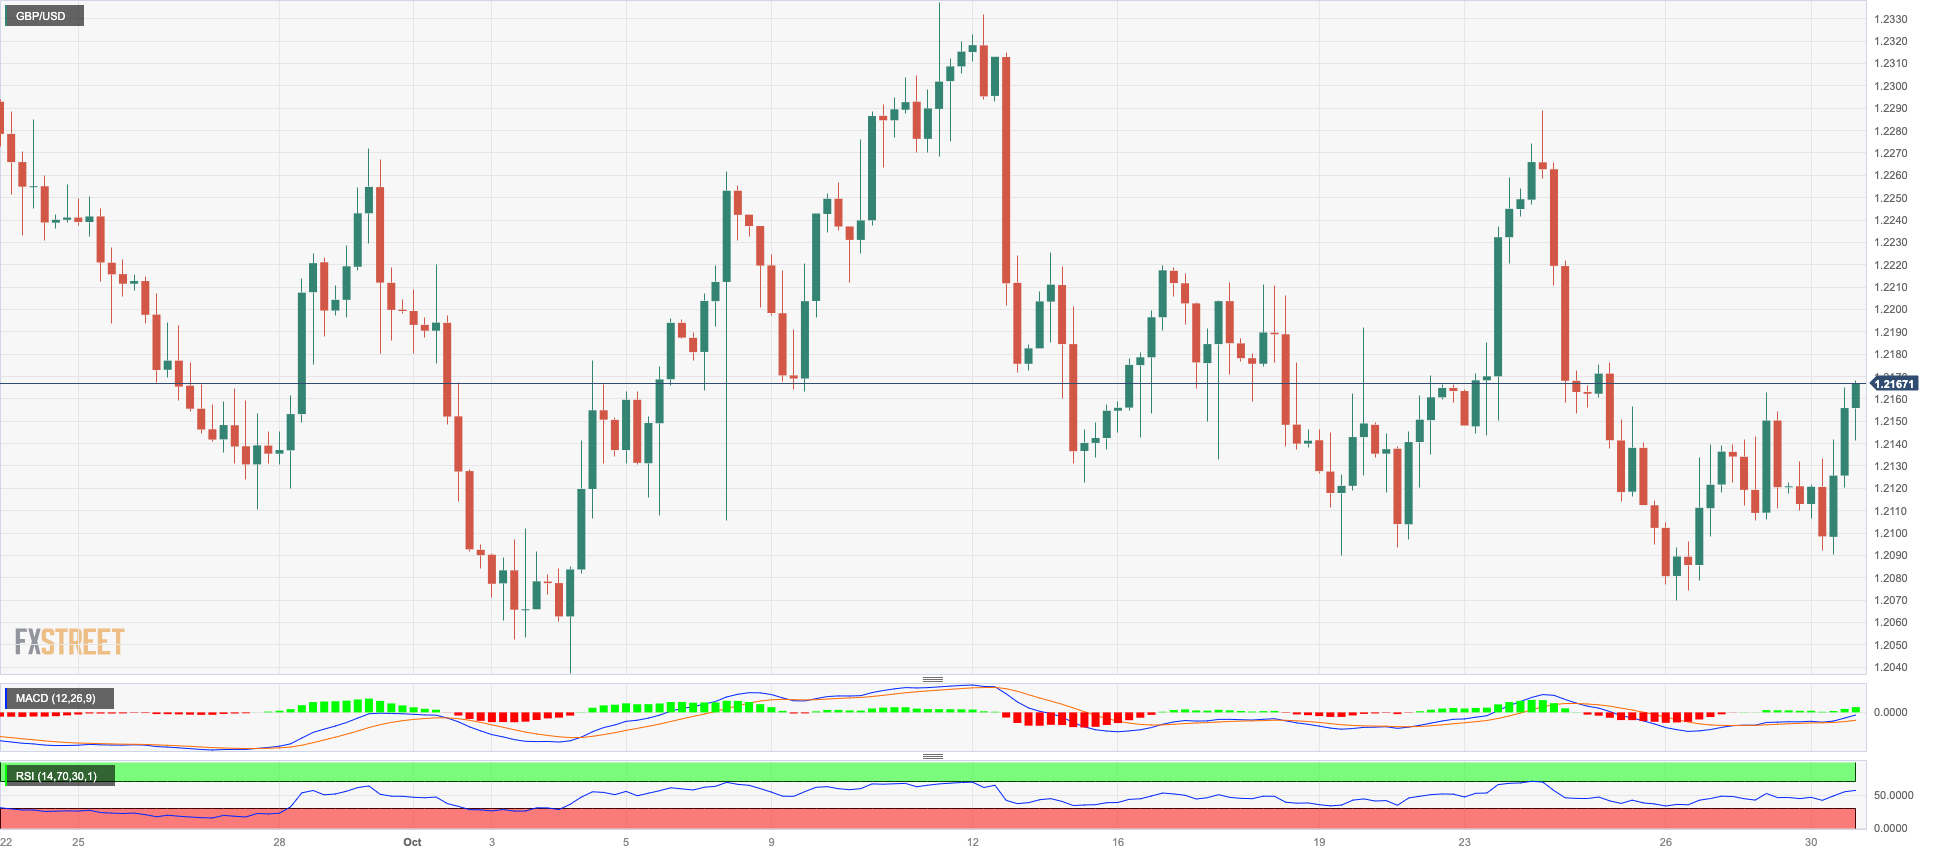
GBP/USD traded in a positive fashion and kept the trade in the mid-1.2100s on the back of another strong pullback in the greenback on Monday.
Moving forward, and other than USD dynamics, Cable is expected to keep a cautious stance and attempt some consolidative move ahead of the key BoE gathering on November 2.
Across the Channel, Mortgage Approvals eased to 43.328K in September and Mortgage Lending shrank by £0.94B in the same month.
If the selling trend continues, GBP/USD might retest the October low of 1.2037 (October 3), just before the psychologically important 1.2000 barrier, as well as the 2023 low of 1.1802 (March 8). On the flip side, the October high of 1.2337 (October 11) is the first level of resistance for Cable, followed by the 200-day SMA at 1.2436. Above this level, the weekly top of 1.2548 (September 11) awaits, seconded by the transitory 100-day SMA at 1.2564. After clearing the latter, emerges the weekly peak of 1.2746 (August 30), followed by 1.2818 (August 10), and 1.2995 (July 27), all ahead of the psychological 1.3000 mark. The daily RSI ticked higher past the 45 level.
Resistance levels: 1.2166 1.2222 1.2288 (4H chart)
Support levels: 1.2069 1.2037 1.1802 (4H chart)
AUDUSD
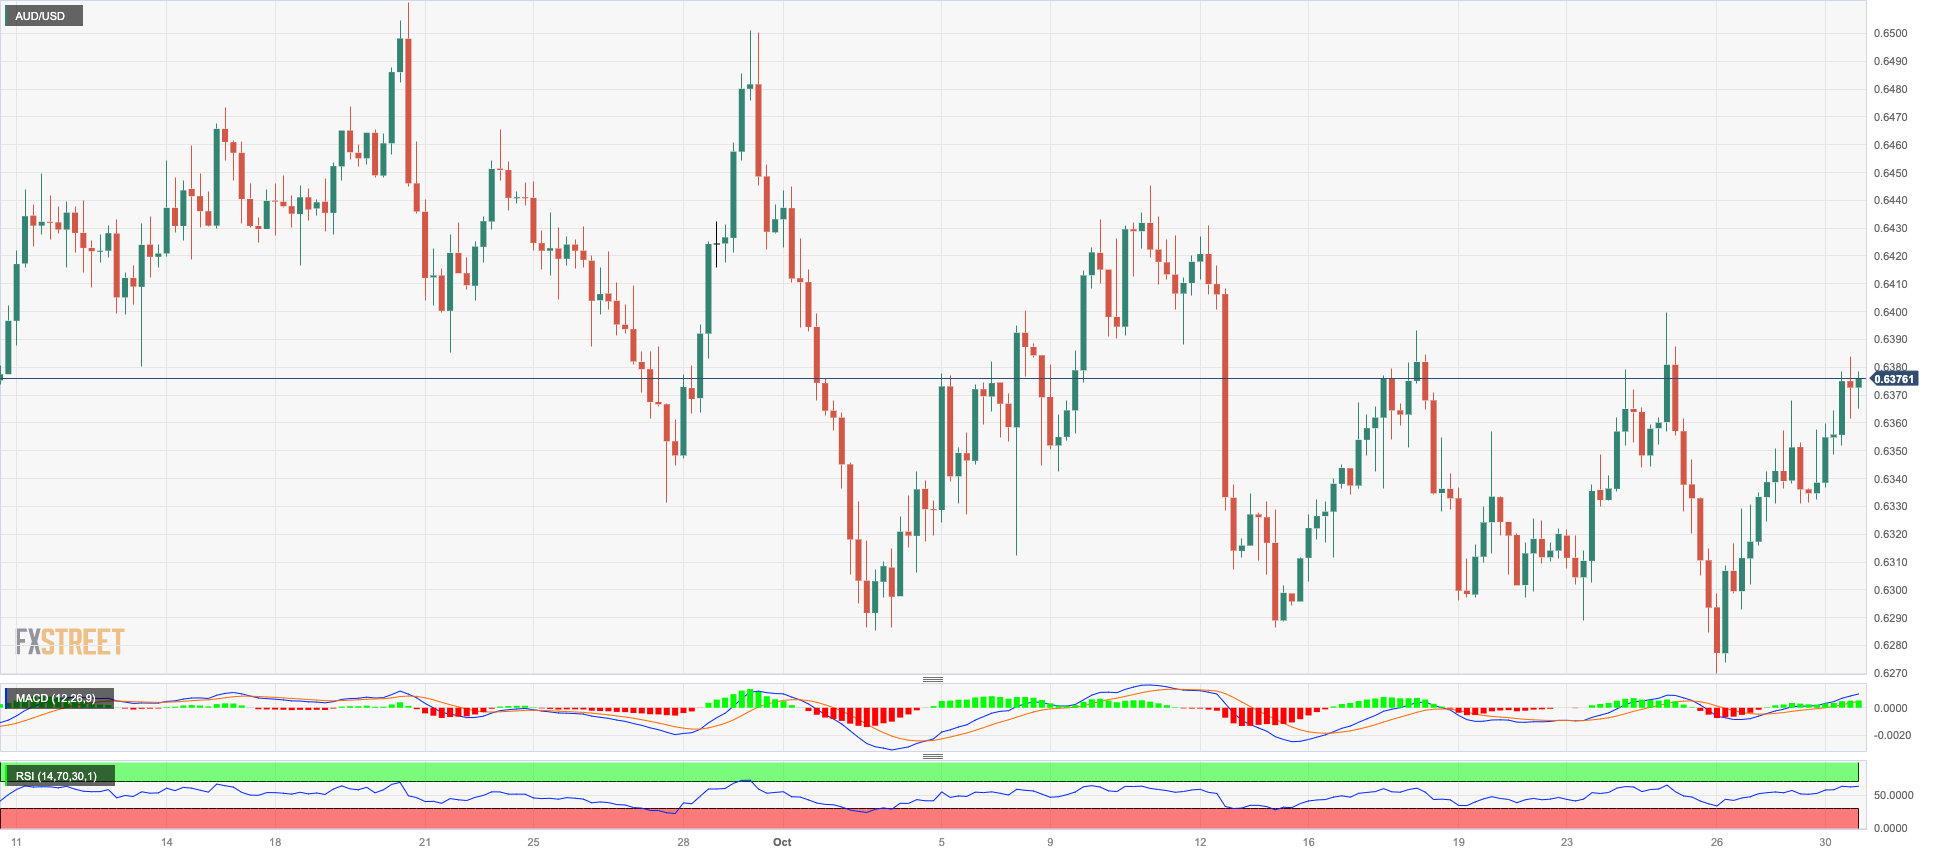
The intense sell-off in the greenback sponsored another marked advance in AUD/USD, this time flirting with the 0.6380 region, or three-day peaks, on Monday.
In addition, the Aussie dollar derived extra legs from the generalized positive performance of the commodity complex, while stronger-than-expected results from the Australian calendar also underpinned the bid bias in the currency.
On the latter, preliminary readings saw Retail Sales expand by 0.9% in September vs. the previous month.
Further rebound in AUD/USD is expected to retest the October high of 0.6445 (October 11), which comes before the weekly top of 0.6501 (September 29) and the September peak of 0.6521 (September 1). Extra gains might be made by aiming for the temporary 100-day SMA at 0.6530 before the weekly high of 0.6616 (August 10) and the 200-day SMA at 0.6633. Further upside may take the pair to its July top of 0.6894 (July 14), then to its June peak of 0.6899 (June 16), and eventually to the critical 0.7000 threshold. If bears grab control, the pair may hit the 2023 low of 0.6270 (October 26) prior to the round level of 0.6200 and the 2022 low of 0.6179 (October 13). On a daily basis, the RSI approached the 52 area.
Resistance levels: 0.6383 0.6399 0.6445 (4H chart)
Support levels: 0.6270 0.6210 0.6169 (4H chart)
GOLD
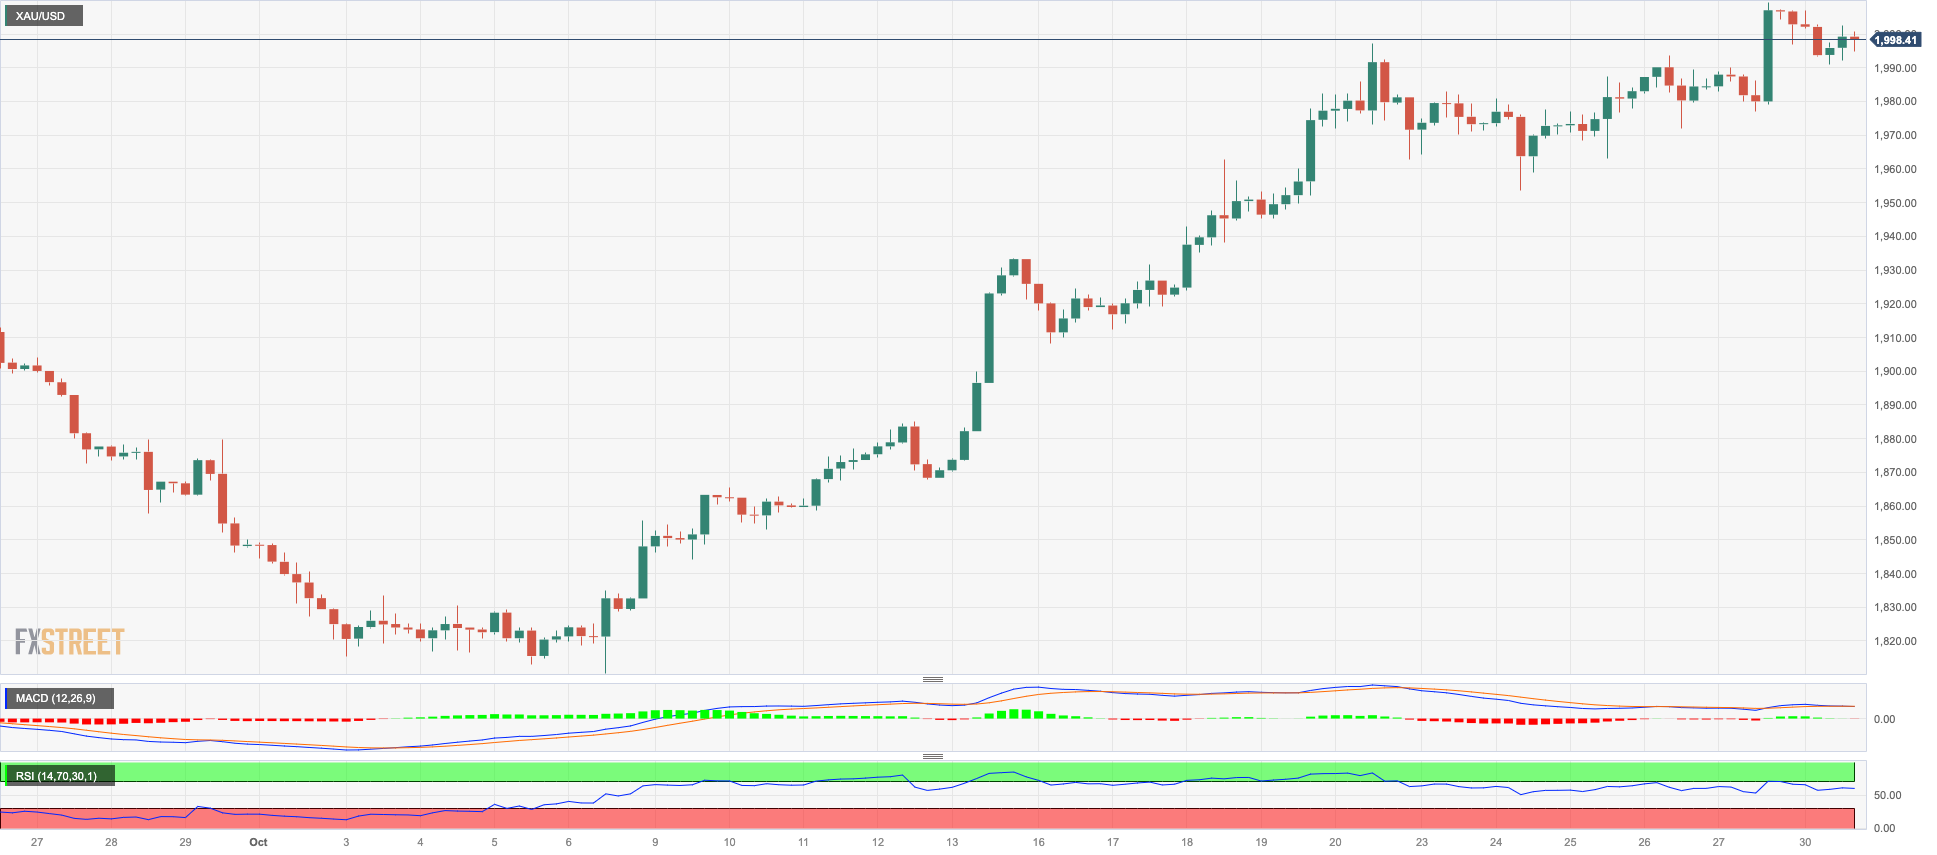
Gold prices could not sustain another visit to the area beyond the critical $2000 threshold per troy ounce, coming under some pressure and dropping modestly at the beginning of the week.
The corrective decline in the precious metal came pari passu with easing, albeit marginally, geopolitical concerns in the Middle East, while the small rebound in US yields across the curve seems to have also favoured some selling in bullion on Monday.
Moving forward, the yellow metal is expected to see its volatility pick up pace ahead of the FOMC event (Wednesday) and the publication of US Nonfarm Payrolls (Friday).
The continuance of the gold price rally now targets the 2023 peak of $2067 (May 4), followed by the 2022 high of $2070 (March 8) and the all-time top of $2075 (August 7, 2020). On the other hand, the 200-day SMA at $1932 provides temporary contention, which is reinforced by the intermediate 55-day SMA at $1913 and is above the October low of $1810 (October 6). If the latter is breached, the 2023 low of $1804 (February 28) may be revisited before the important support zone of $1800 is reached.
Resistance levels: $2009 $2022 $2048 (4H chart)
Support levels: $1953 $1909 $1867 (4H chart)
CRUDE WTI
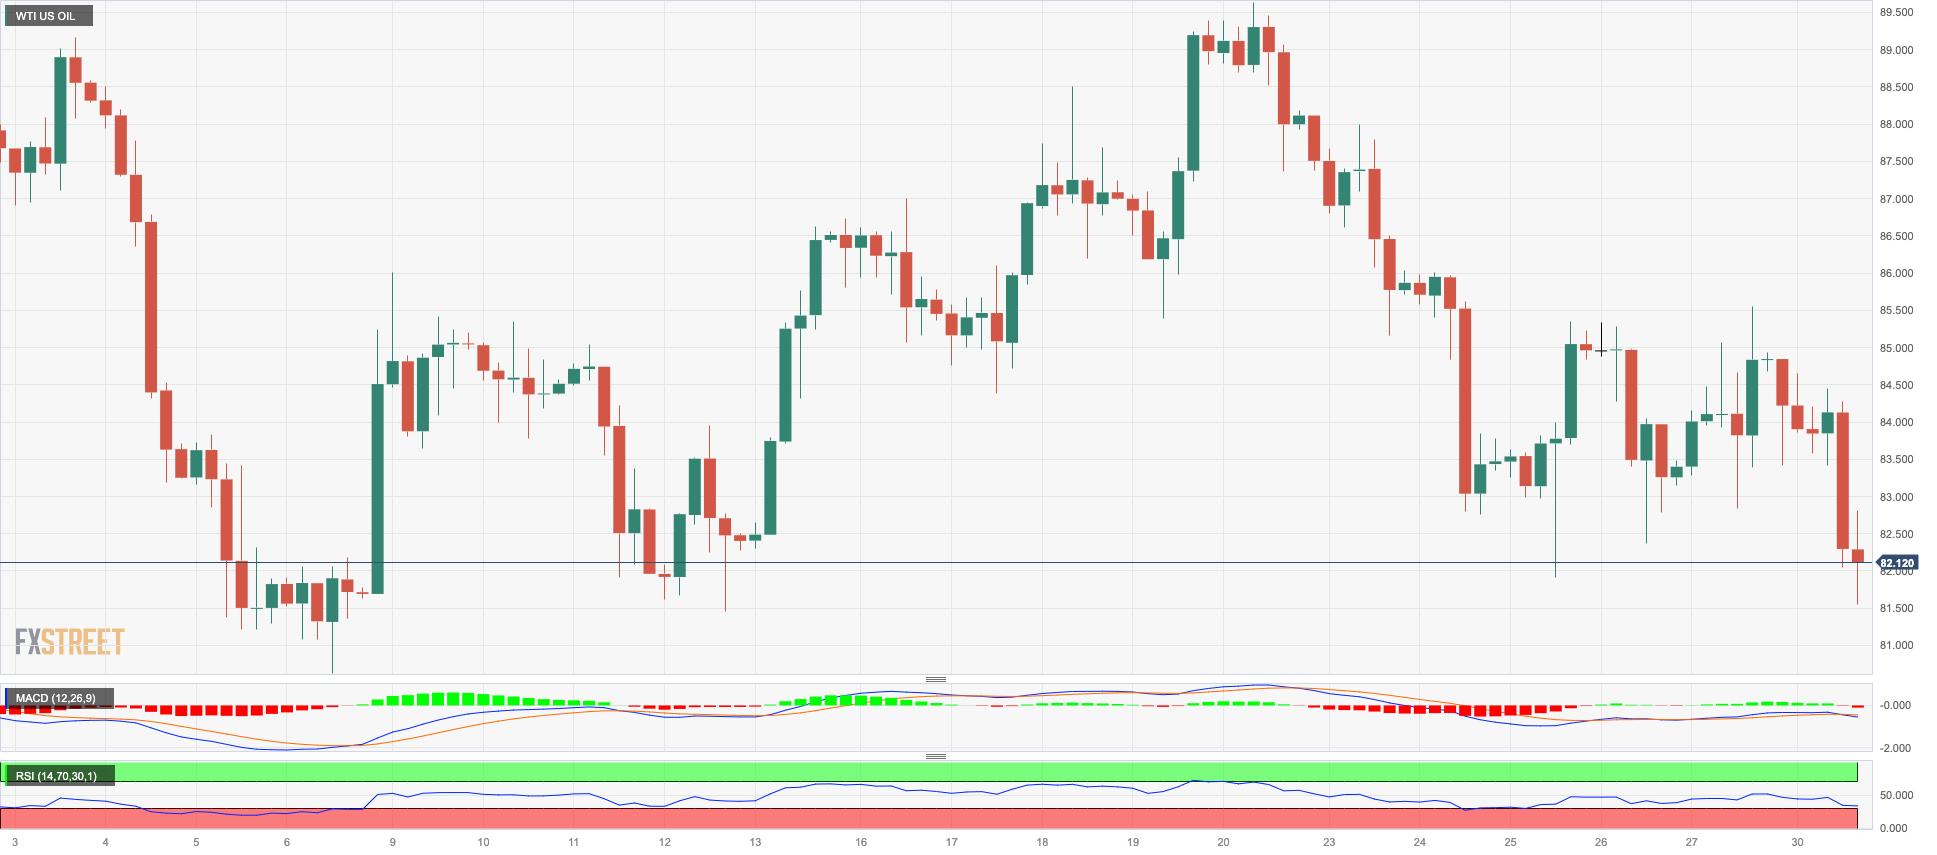
In a disheartening start to the new trading week, prices of WTI sank to four-week lows in the sub-$82.00 region against the backdrop of somewhat mitigated concerns from the crisis in the Middle East and their association with a potential impact on the crude oil supply.
In addition, cautiousness among traders is expected to gather pace ahead of the key FOMC gathering on Wednesday and the crucial release of the US jobs report on Friday.
On the speculative front, net longs in WTI retreated to levels last seen in early September in the week ended on October 24, as per the CFTC Positioning Report.
On the docket, the API and the EIA will report on US crude oil supplies in the week to October 27 on Tuesday and Wednesday, respectively.
WTI might fall further, revisiting the October low of $81.56 (October 6), ahead of the important $80.00 level and the pivotal 200-day SMA at $78.14. If bears clear this region, a test of the August low of $77.64 (August 24) might reappear on the horizon before the weekly low of $73.89 (July 17) and the important $70.00 mark per barrel. South from here emerges the June low of $66.85 (June 12), followed by the 2023 low of $63.61 (May 4) and the critical $60.00 mark per barrel. Having said that, the weekly high of $89.83 (October 18) comes before the 2023 record of $94.99 (September 28). Further north aligns the weekly top of $97.65 (August 30, 2022) prior to the psychological $100.00 mark per barrel.
Resistance levels: $85.85 $87.87 $89.82 (4H chart)
Support levels: $81.86 $77.56 $73.81 (4H chart)
GER40
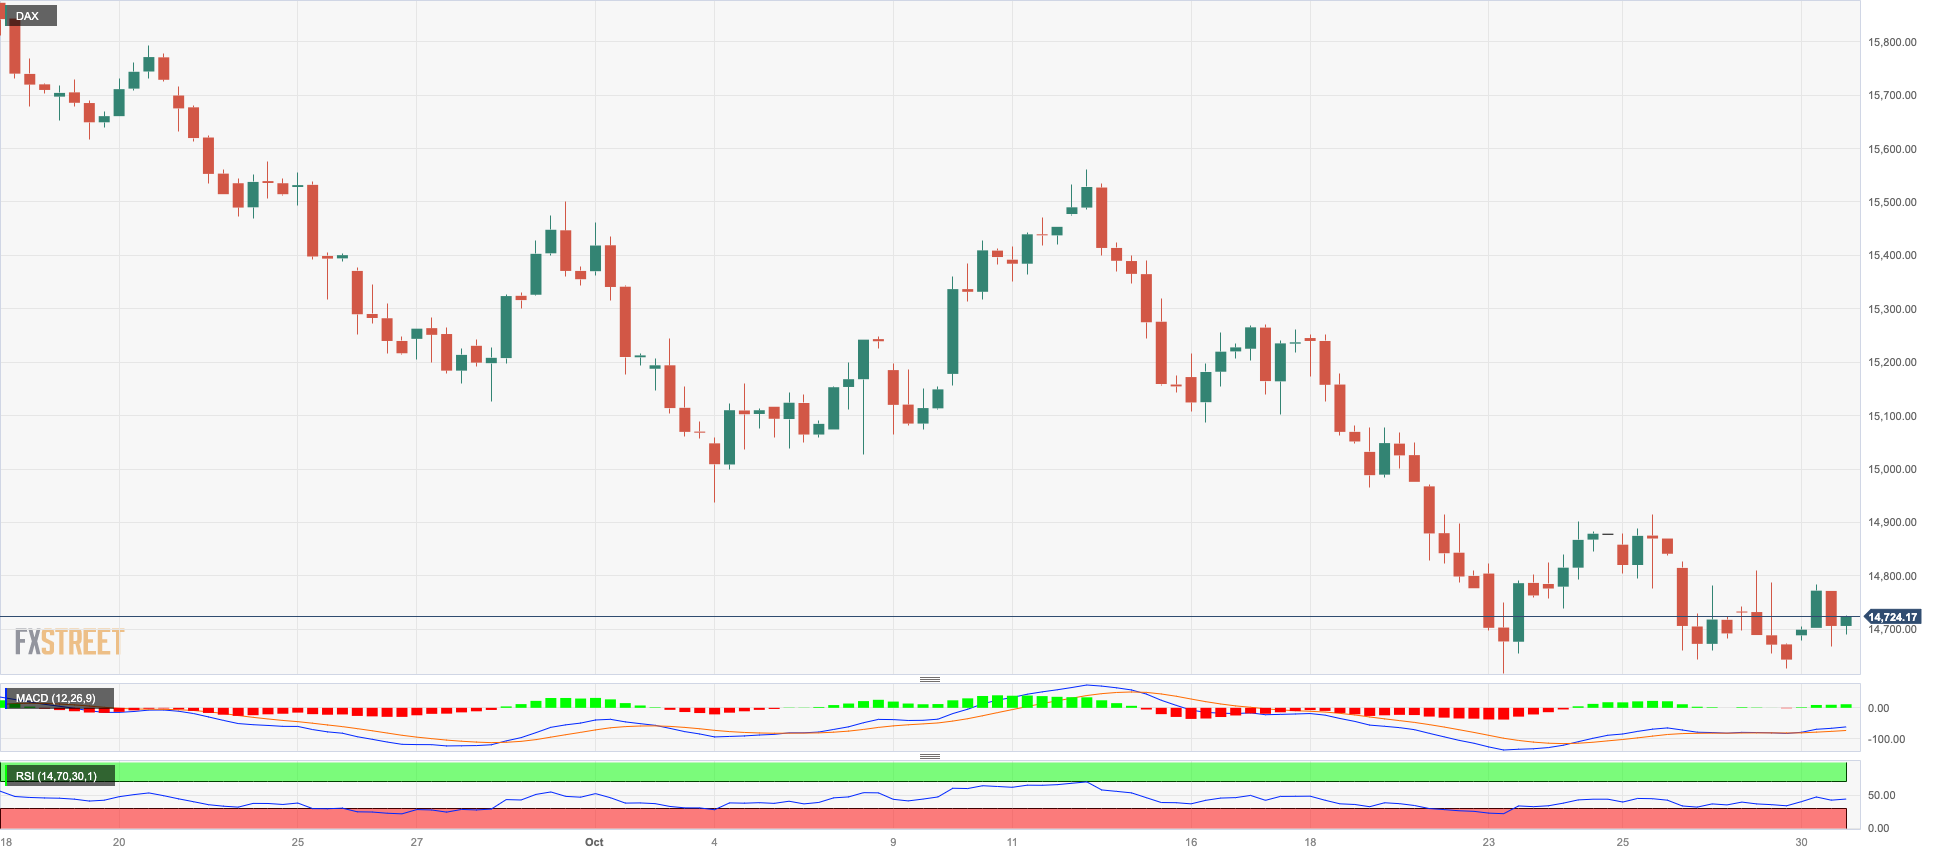
German stocks reversed two consecutive daily retracements and pushed the DAX40 back to positive territory on Monday, this time briefly flirting with the 14800 zone.
The resumption of the buying bias in the index came in response to temporarily subdued geopolitical jitters in the Middle East, while further strength emerged when flash GDP figures in Germany showed the economy is expected to have contracted less than previously estimated.
The daily bounce in the index fell in line with the move higher in the 10-year bund yields, which revisited the 2.85% level.
If sellers regain the initiative, the DAX40 might return to its October low of 14630 (October 23) ahead of the March ow of 14458 (March 20) and the December 2022 low of 13791 (December 20). The loss of the later exposes a probable decline to the 2022 low of 11862 (September 28). Instead, the initial upward hurdle is the October high of 15575 (October 12), closely followed by the key 200-day SMA of 15642. Further north, the September peak of 15989 (September 15) can be observed, prior to the weekly peaks of 16042 (August 31) and 16060 (August 10). If this zone is trespassed, the index may aim to reach its all-time high of 16528 (July 31). The daily RSI bounced north of 32.
Best Performers: Siemens Energy AG, Heidelbergcement , MTU Aero
Worst Performers: Infineon, Sartorius AG VZO, Merck
Resistance levels: 14933 15288 15575 (4H chart)
Support levels: 14630 14458 13791 (4H chart)
NASDAQ
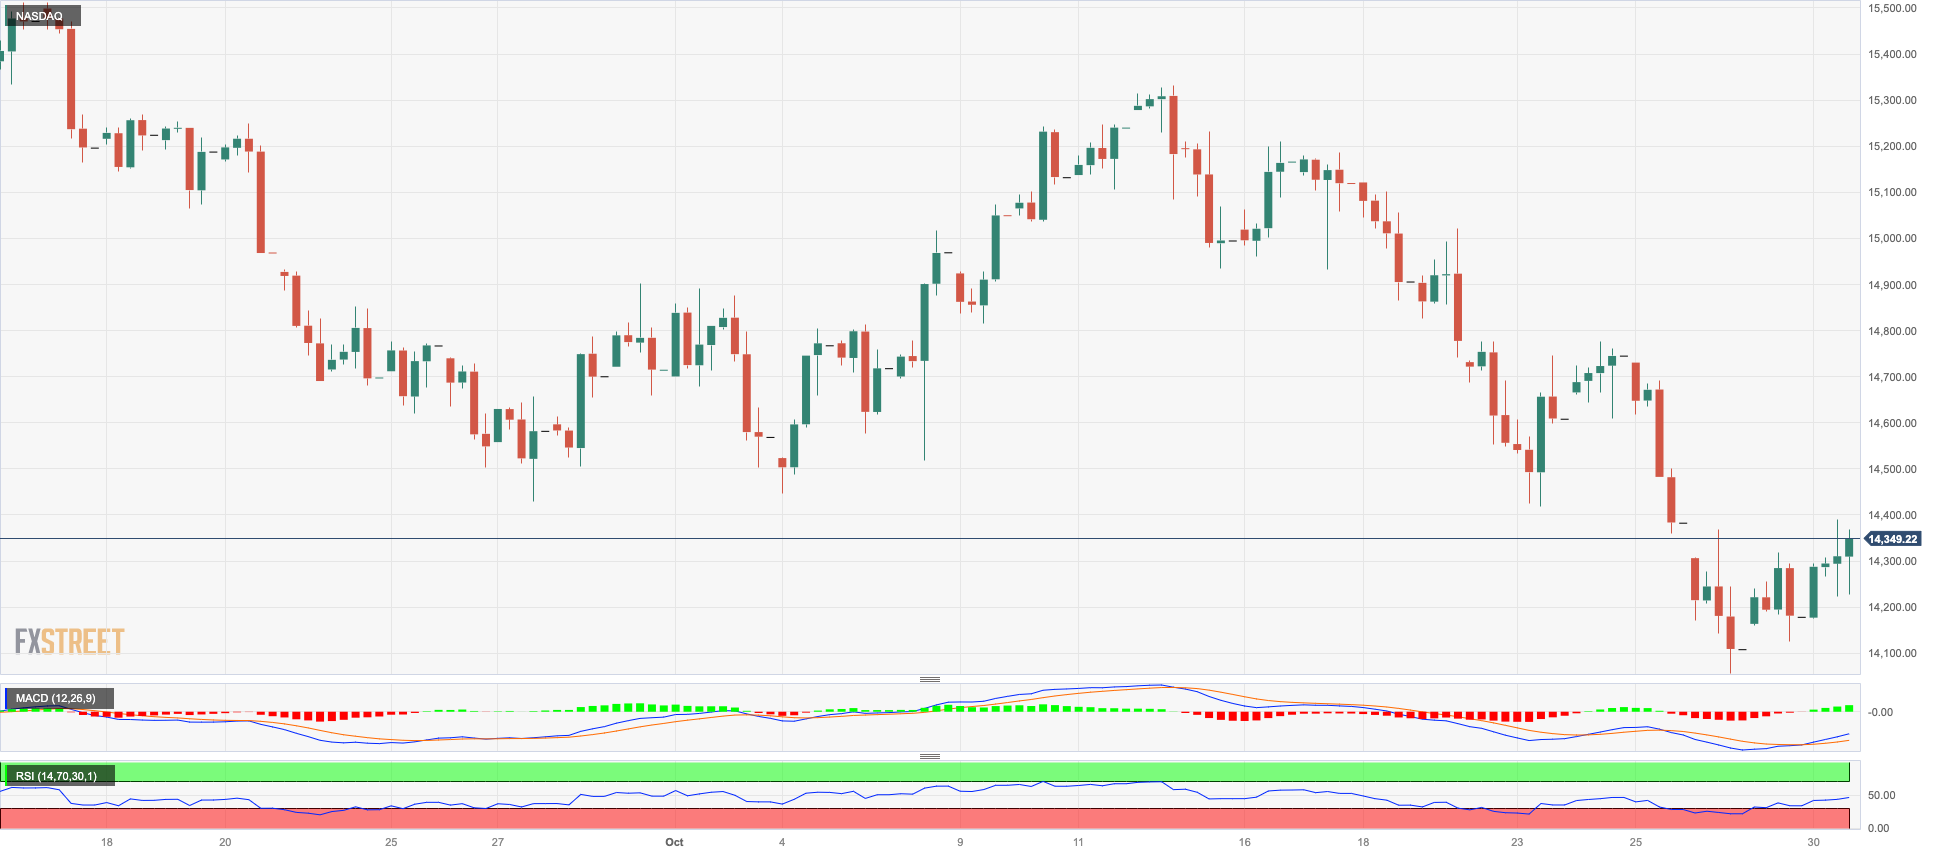
The US tech sector kept Friday’s optimism well in place and advanced to three-day highs around the 14400 region when tracked by the benchmark Nasdaq 100 at the beginning of the week.
The upside momentum in the index came in tandem with increasing hopes of an upbeat print from Apple’s earnings report due later in the week, along with bargain hunters, all in light of the sharp pullback seen in the second half of the month.
The bullish price action in the Nasdaq 100 was also underpinned by investors’ perception that the Fed will keep its interest rates unchanged at its event on Wednesday, while the selling pressure in the greenback and the lack of traction in US yields also added to Monday’s uptick.
If sellers retain control, the Nasdaq 100 should find quick support at 14058, the October low (October 26). If this area is lost, the 200-day SMA of 13941 will be put to the test before reaching the April bottom of 12724 (April 25), then to the March low of 11695 (March 13), and finally to the 2023 low of 10696 (January 6). Immediate resistance occurs at the October high of 15333 (October 12), followed by the September top of 15618 (September 1) and the weekly peak of 15803 (July 31). If the index advances above this level, it may challenge the 2023 high of 15932 (July 19). The daily RSI advanced to the proximity of 40.
Top Gainers: Charter Communications, Amazon.com, Adobe
Top Losers: ON Semiconductor, NXP, Tesla
Resistance levels: 14774 15080 15333 (4H chart)
Support levels: 14058 13520 12724 (4H chart)
DOW JONES
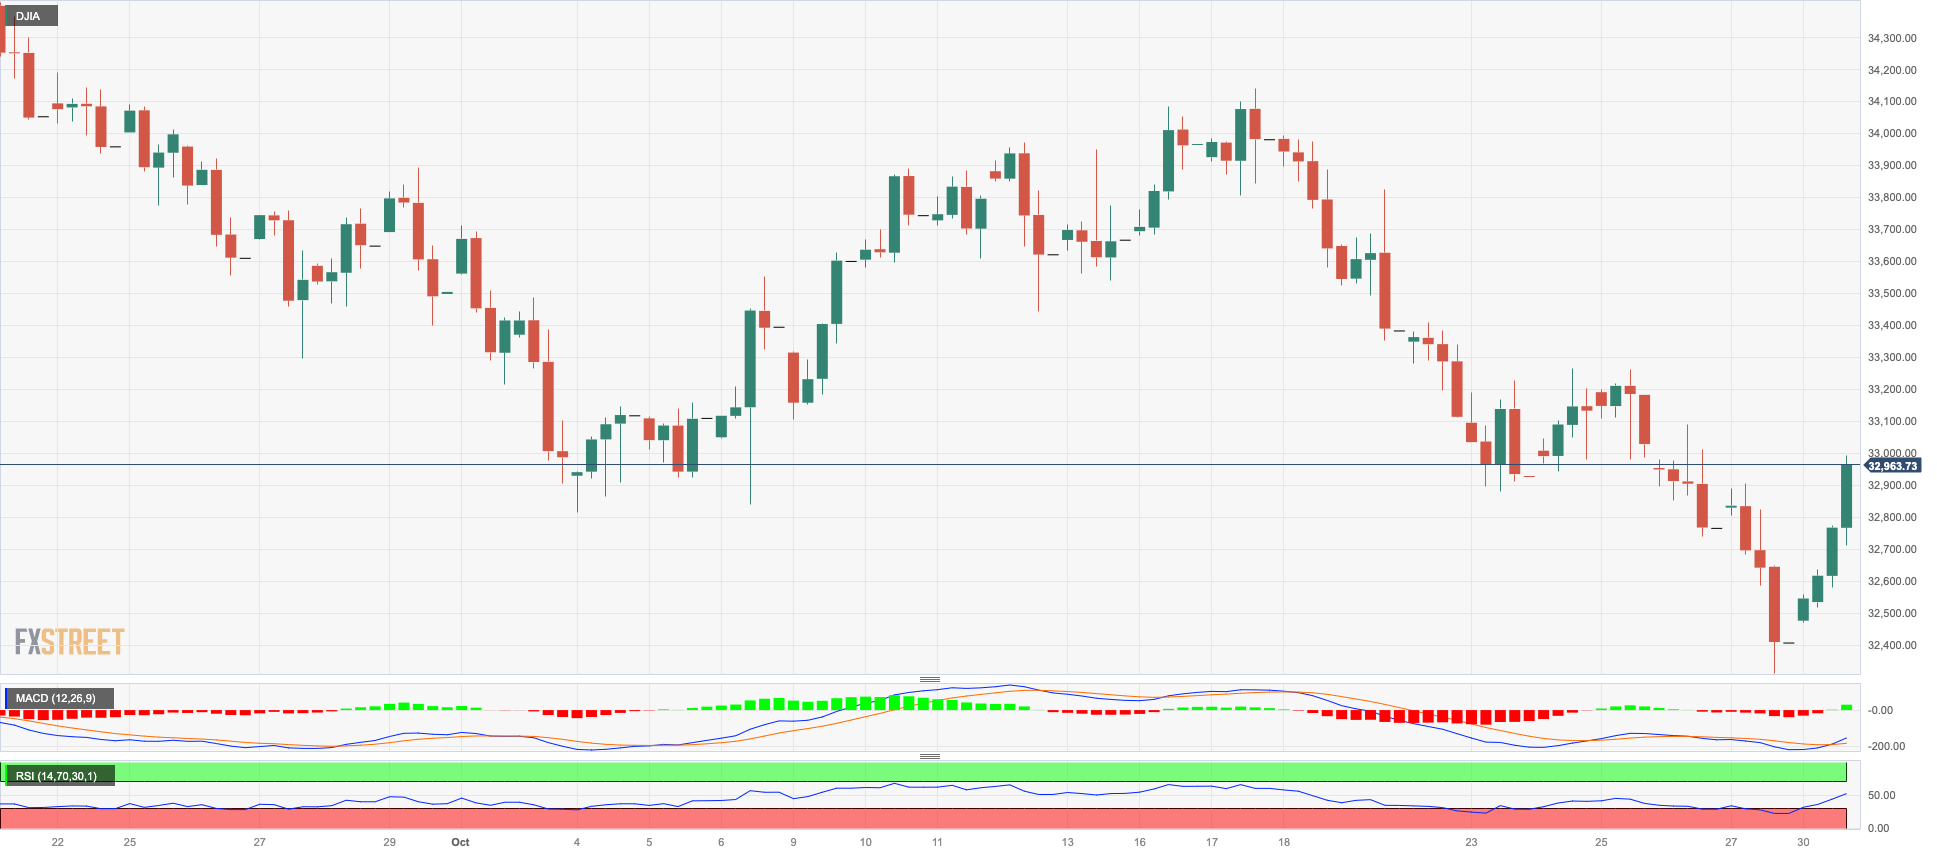
A strong kickoff to the new trading week saw US equities gauged by the Dow Jones advance strongly to the boundaries of the key 33000 threshold on Monday.
In fact, hopes of positive results from megacap Apple due later in the week, in combination with the anticipated on-hold interest rate decision by the Federal Reserve on Wednesday, seem to have reignited a robust buying interest among investors at the beginning of the week.
In addition, mitigated geopolitical jitters appear to have also bolstered the upbeat sentiment among market participants.
All in all, the Dow Jones gained 1.65% to 32972, the S&P500 advanced 1.30% to 4171, and the tech-focused Nasdaq Composite rose 1.27% to 12803.
Further recovery in the Dow Jones is expected to put the key 200-day SMA of 33806 back on the radar prior the October high of 34147 (October 17). A rally north from here should test the intermediate 100-day SMA at 34285 before the September top of 34977 (September 14) and the weekly top of 35070 (August 31), both of which precede the 2023 peak of 35679 (August 1). On the flip side, there is an initial support at the October low of 32327 (October 27) ahead of the 2023 bottom of 31429 (March 15) and the 2022 low of 28660 (October 13). The everyday RSI rebounded past the 31 level.
Top Performers: Verizon, Goldman Sachs, Nike
Worst Performers: Walgreen Boots, Cisco, Intel
Resistance levels: 33272 34147 34293 (4H chart)
Support levels: 32327 31429 30206 (4H chart)
MACROECONOMIC EVENTS

All Information & Updates provided by:

All information relating to the financial markets available on this page has been prepared and issued by FXStreet (Forexstreet SL, Spain, Reg: B62498233) on the basis of publicly available information and all information believed to be reliable and does not conflict with Kuwaiti local laws, and all necessary care has been taken to before the company to ensure that the facts mentioned are correct from the source.
NCM Investment nor any of its directors or employees shall in any way be held responsible for the contents of this news, and the information contained on this page is intended only to provide clients with publicly available information and should not be construed as investment advice, report or analysis and/or constitute an offer or invitation to buy or sell financial instruments of any kind.
RISK WARNING: Forex and CFDs are highly risky leveraged products, as losses can exceed deposits. Please ensure you understand all the risks and take independent advice if necessary. NCM will segregate the clients based on the criteria of the regulator and its bylaws. NCM does not provide any advisory service; the material published does not constitute advice or a recommendation for a transaction in any financial instrument. NCM accepts no responsibility for any use of the content presented and any consequences of that use. Anyone acting on the information provided does so at their own risk.