
- Contact Us:
-

-

-

-


Daily Market Updates
01 Nov 2023
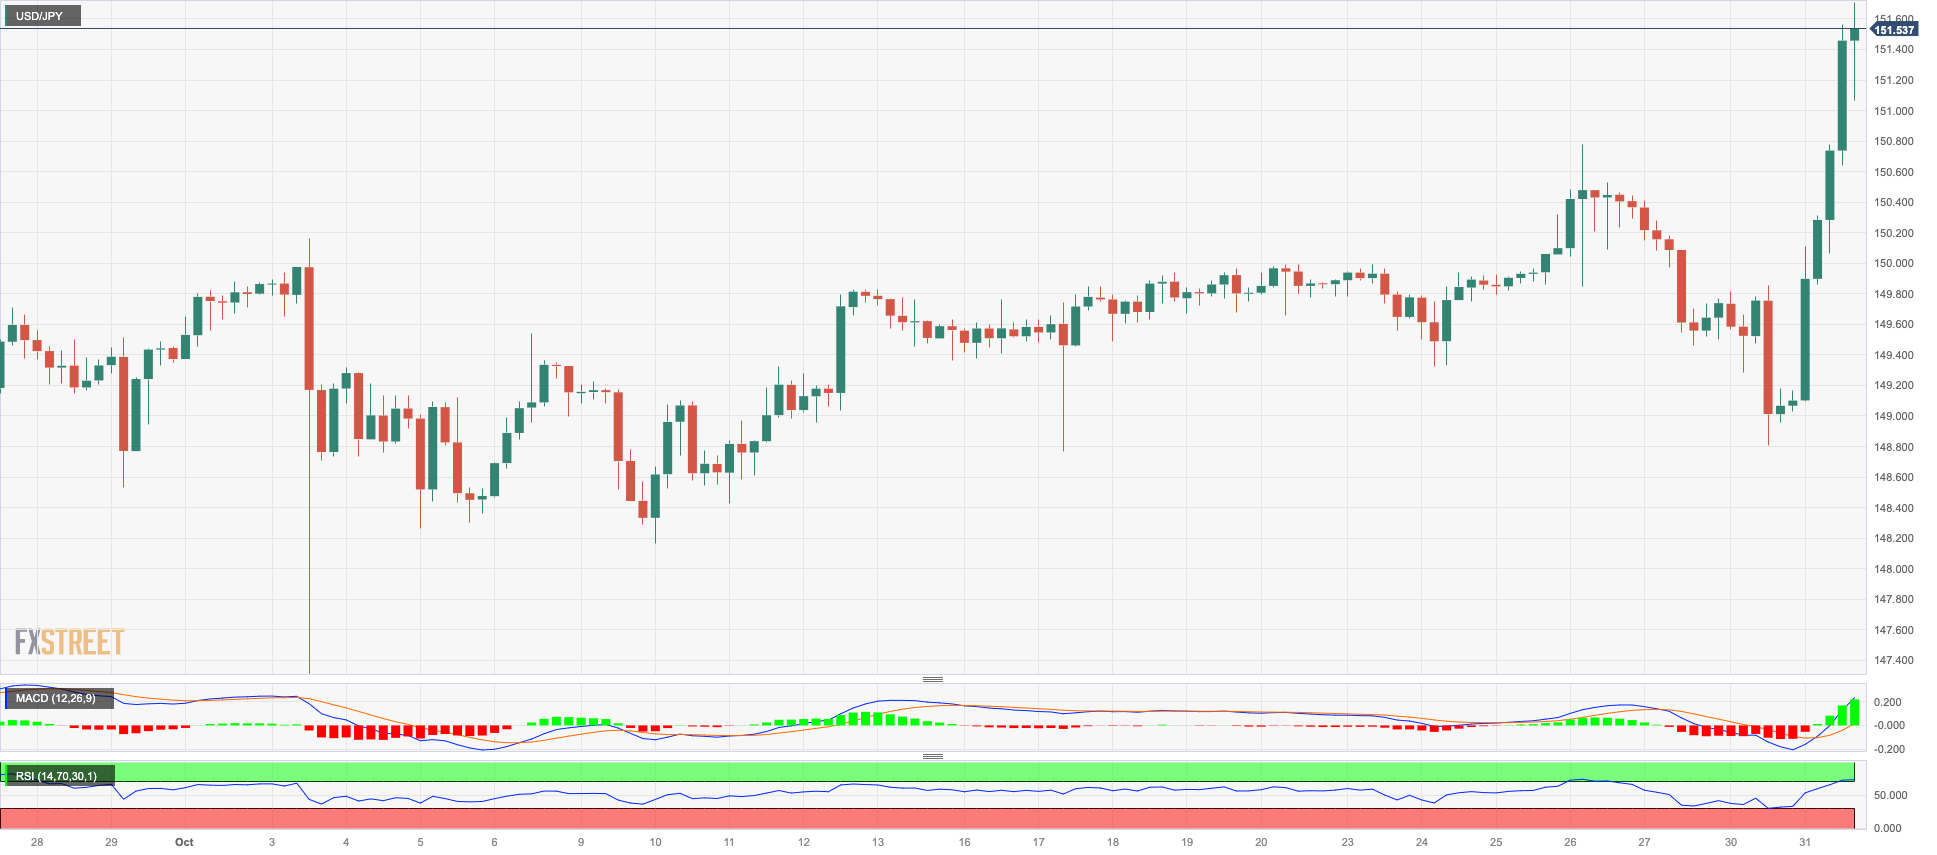
USDJPY
A strong selling pressure hurt the Japanese yen and sponsored the move higher in USD/JPY to the area well north of the 151.00 barrier for the first time since mid-October 2022.
The marked depreciation of the Japanese currency followed the perceived as disappointing meeting of the BoJ, which left the policy rate unchanged at -0.1%. Furthermore, the central bank acknowledged that the 1% mark for 10-year JGB yields constitutes a reference level in market operations rather than a ceiling, while reference to daily fixed-rate bond-buying operations was dropped. In addition, the BoJ will persist with large-scale JGB purchases. Additionally, core inflation projections were raised to 2.8% for fiscal years 2023 and 2024 and 1.7% for fiscal year 2025. Headline projections were elevated to 3.8%, 1.9%, and 1.9%, respectively.
As investors continued to digest the BoJ event, JGB 10-year yields rose to the 0.96% region for the first time since May 2013.
In Japan, the jobless rate receded to 2.6% in September, while flash Industrial Production contracted 4.6% YoY in the same month and Retail Sales expanded at an annualized 5.8%. Further data saw Consumer Confidence improve to 35.7 in October and Housing Starts contract 6.8% in September from a year earlier.
Further USD/JPY gains are targeted for the YTD high of 151.70 (October 31), before the 2022 high of 151.94 (October 21) and the round level of 152.00. In comparison, the weekly low of 148.16 (October 10) appears propped up by the transitory 55-day SMA (148.12) and comes ahead of the October low of 147.27 (October 3). South from here aligns, the weekly low of 145.89 (September 11) prior to the September low of 144.43 (September 1). From this region, there are no meaningful support levels until the August low of 141.50 (August 7), which is above the 200-day SMA of 140.05 and the July low of 137.23 (July 14). The daily RSI leapt past the 66 yardstick.
Resistance levels: 151.70 151.94 152.00 (4H chart)
Support levels: 148.80 148.16 147.27 (4H chart)
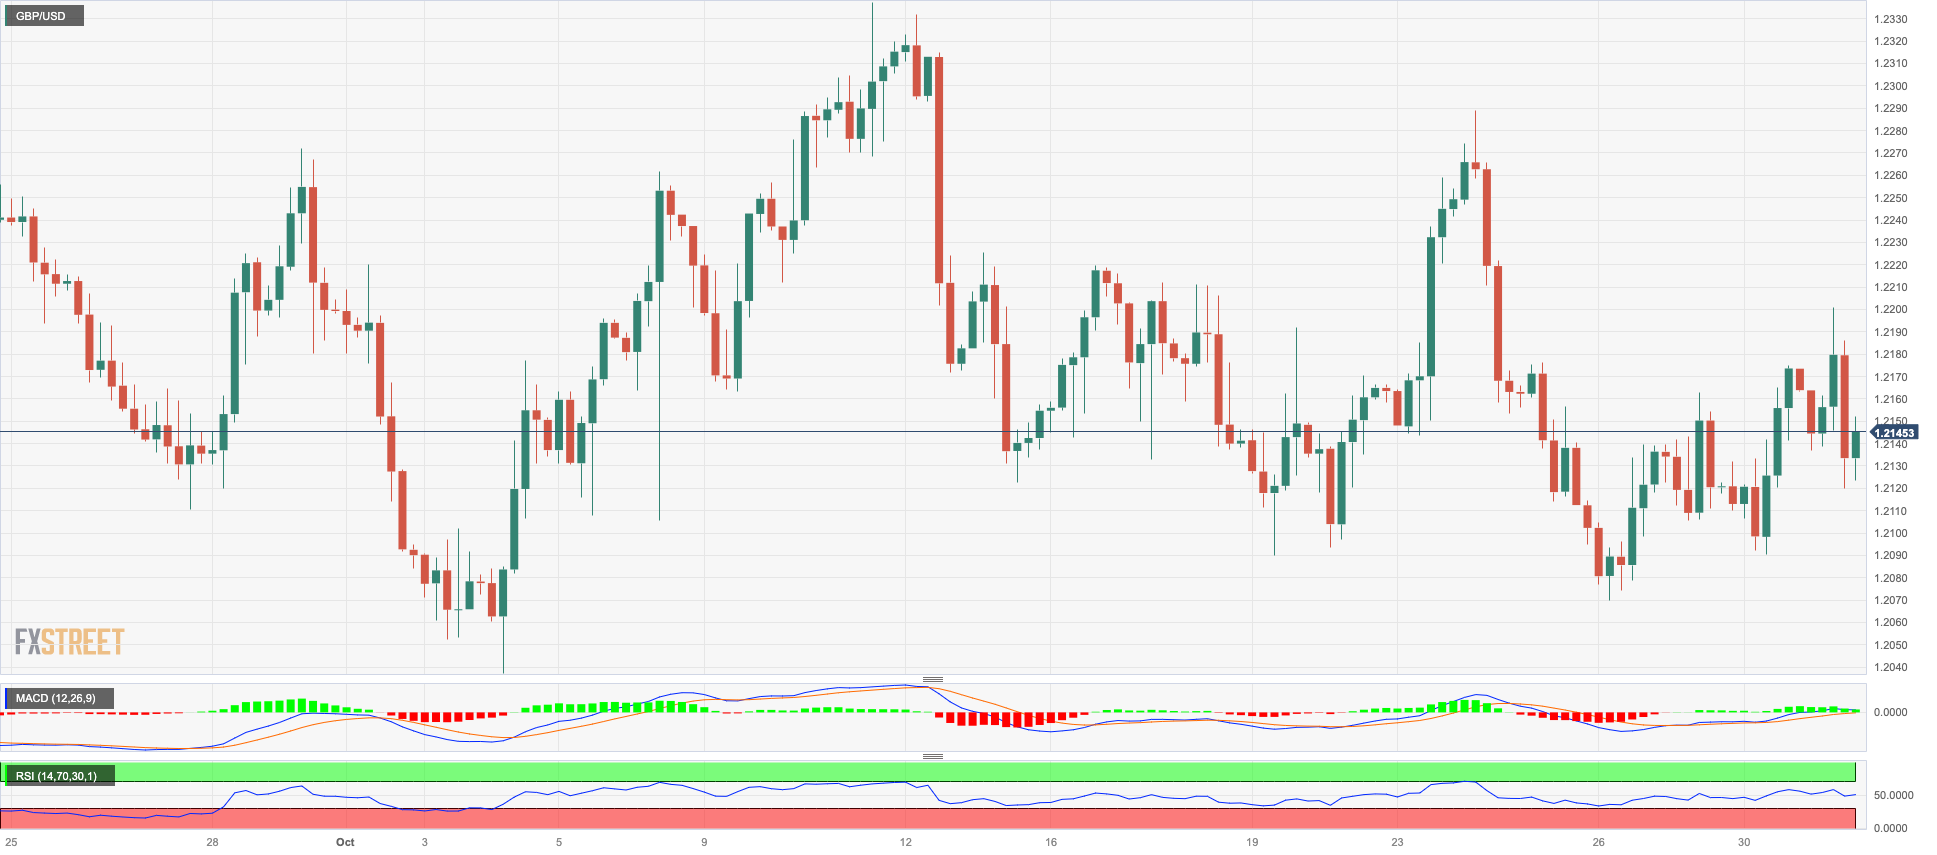
GBPUSD
The late rebound in the greenback prompted GBP/USD to give away earlier gains to multi-day peaks around the 1.2200 region on turnaround Tuesday.
The daily retracement of the British pound fell in line with the erratic performance of Cable seen as of late, while prudence among market participants is seen picking up pace in light of the upcoming BoE interest rate decision.
There were no data releases in the UK docket on Tuesday.
If the selling trend regains traction, GBP/USD may retest the October low of 1.2037 (October 3), just ahead of the psychological1.2000 barrier, and before the 2023 low of 1.1802 (March 8). On the other hand, the initial level of resistance for Cable is the weekly top of 1.2288 (October 24) seconded by the October high of 1.2337 (October 11), and the 200-day SMA at 1.2435. Above this region, the weekly high of 1.2548 (September 11) awaits, followed by the transitory 100-day SMA at 1.2560. Following the clearing of the latter, the weekly peak of 1.2746 (August 30) appears, prior to another weekly tops of 1.2818 (August 10) and 1.2995 (July 27), all of which are ahead of the psychological 1.3000 threshold. The daily RSI slipped back below 44.
Resistance levels: 1.2200 1.2288 1.2337 (4H chart)
Support levels: 1.2069 1.2037 1.1802 (4H chart)
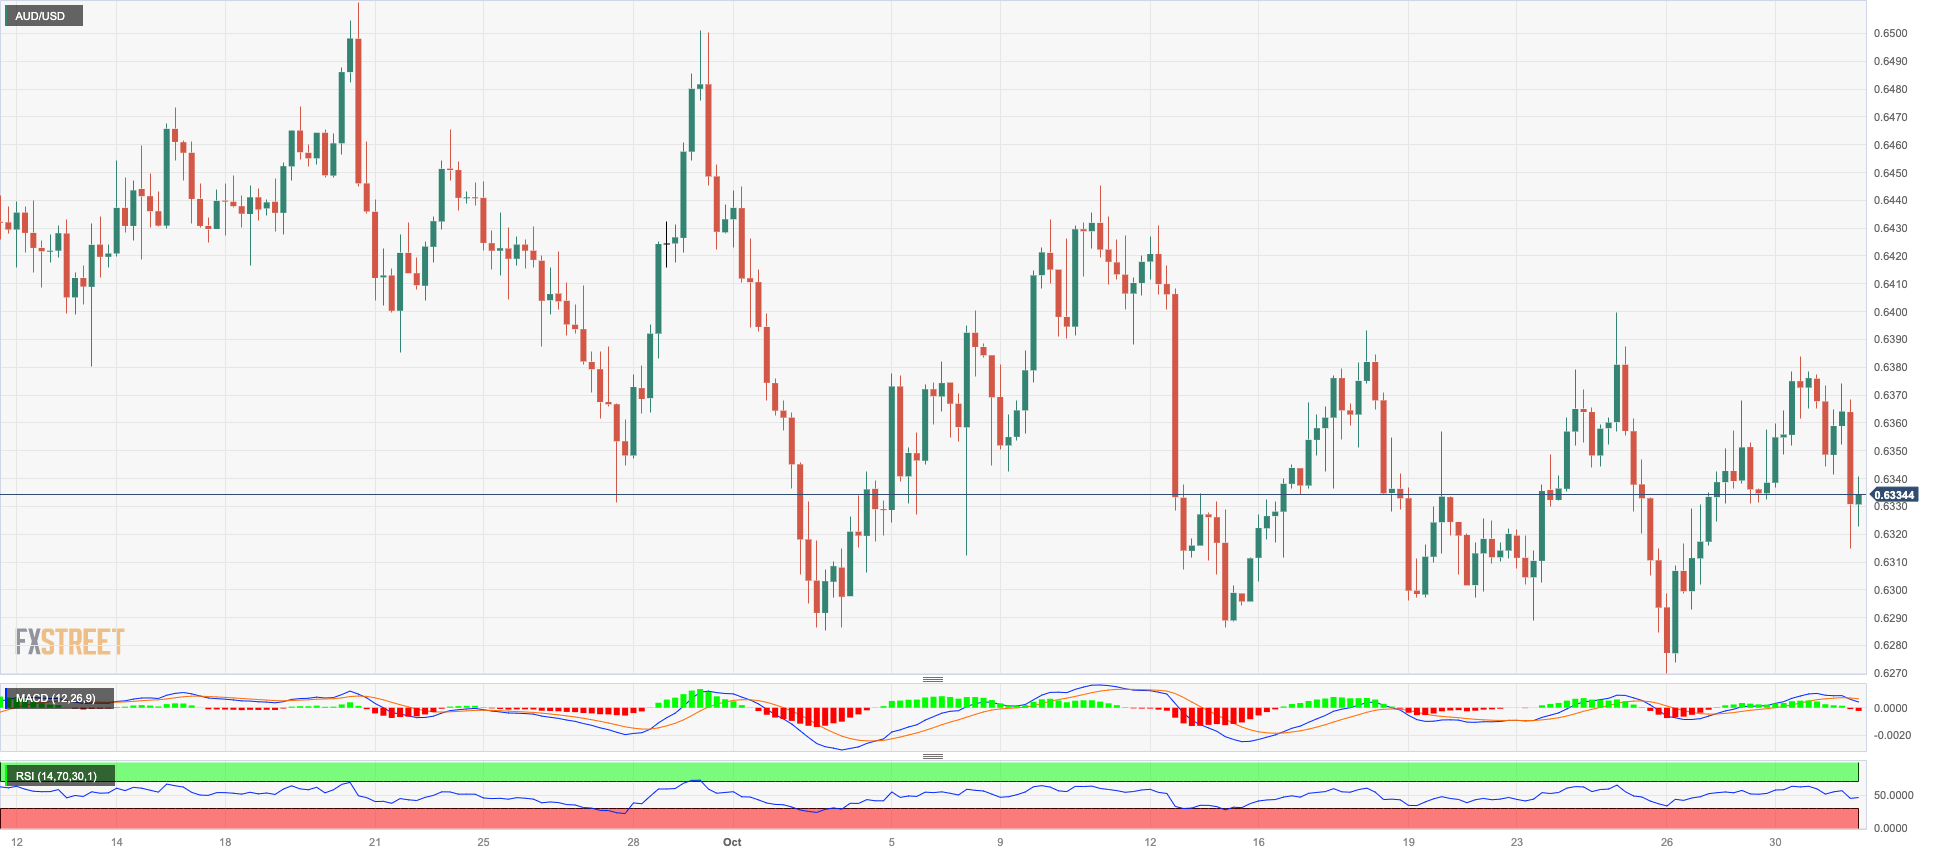
AUDUSD
In line with the rest of the risk-linked assets, AUD/USD left behind the recent three-day positive streak and dropped markedly in response to another data-driven bounce in the greenback.
Spot, in the meantime, maintained the ongoing consolidative theme, which appears to be limited by the 0.6400 barrier for the time being.
Also weighing on the Aussie dollar emerged the poor PMI prints from China for the month of October as well as the mixed performance of the commodity space.
In Oz, Housing Credit expanded at a monthly 0.4% in September.
Next on the upside for AUD/USD appears the October high of 0.6445 (October 11), which comes before the weekly top of 0.6501 (September 29) and the September peak of 0.6521 (September 1). Extra gains could retest the temporary 100-day SMA at 0.6526 before the weekly high of 0.6616 (August 10) and the 200-day SMA at 0.6630. Further upward movement may take the pair to its July top of 0.6894 (July 14), then to its June peak of 0.6899 (June 16), and finally to the key 0.7000 threshold. If the bears seize control, the pair may reach the 2023 bottom of 0.6270 (October 26) before the round level of 0.6200 and the 2022 low of 0.6179 (October 13). The RSI on the daily chart eased below 47.
Resistance levels: 0.6383 0.6399 0.6445 (4H chart)
Support levels: 0.6327 0.6270 0.6210 (4H chart)
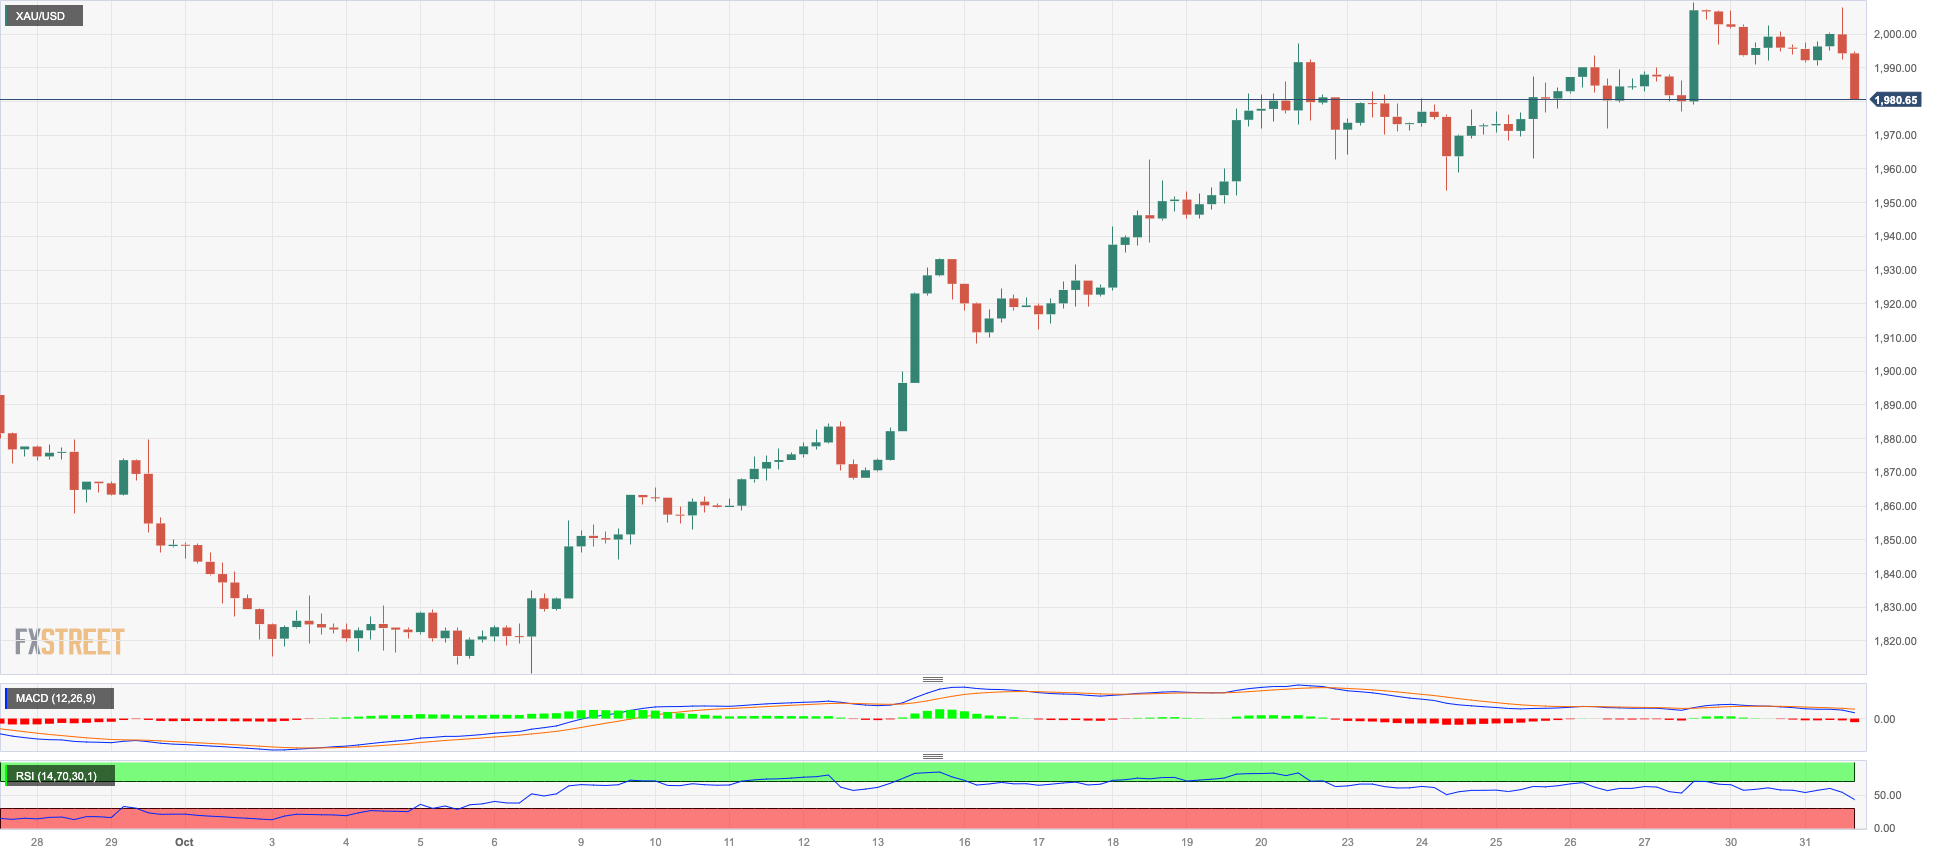
GOLD
Prices of the yellow metal initially advanced past the key $2000 mark per troy ounce, although that uptick later fizzled out and forced prices to return to the $1985 zone on turnaround Tuesday.
The sharp rebound in the greenback, coupled with a bounce in the short end of the US curve and somewhat mitigated geopolitical concerns, collaborated with the bearish tone of the precious metal so far in the first half of the week.
Moving forward, bullion is expected to remain under the microscope in light of the FOMC gathering and the release of the US monthly jobs report on Wednesday and Friday, respectively.
In the meantime, the Middle East crisis should limit occasional bouts of weakness around the metal.
The gold price surge will now aim for the 2023 peak of $2067 (May 4), followed by the 2022 high of $2070 (March 8) and the all-time top of $2075. (August 7, 2020). The 200-day SMA at $1933, on the other hand, provides temporary support, which is strengthened by the intermediate 55-day SMA at $1914. A deeper pullback could prompt the October low of $1810 (October 6) to re-emerge on the horizon ahead of the 2023 low of $1804 (February 28) and the critical support zone of $1800.
Resistance levels: $2009 $2022 $2048 (4H chart)
Support levels: $1953 $1912 $1867 (4H chart)
CRUDE WTI
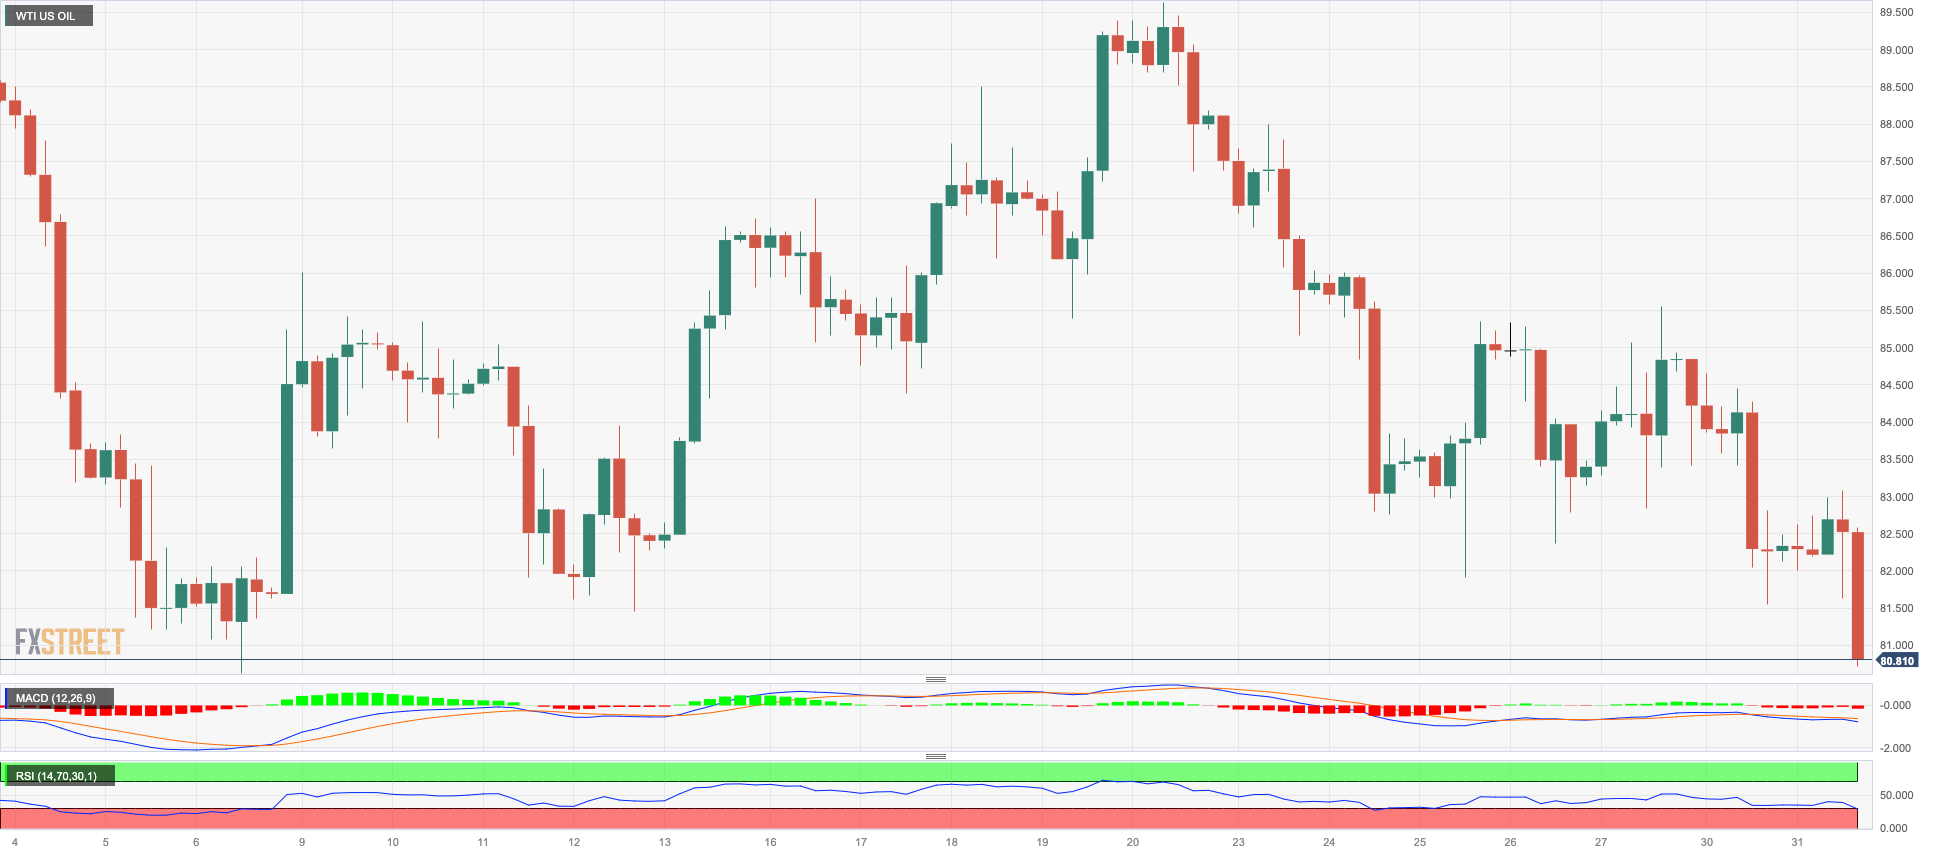
Prices of WTI extended the pessimism seen at the beginning of the week and retreated further on Tuesday, this time revisiting the vicinity of the $81.00 mark per barrel, or two-month lows.
Extra weakness in the commodity came in response to the intense rebound in the greenback, which in turn appeared propped up by auspicious results from the US docket and its association with the Fed’s tighter-for-longer stance.
Additionally, geopolitical worries seemed to have dwindled somewhat on Tuesday, also contributing to the corrective decline in the commodity.
Further weakness might prompt WTI to retreat to the crucial $80.00 mark, ahead of the significant 200-day SMA at $78.14. If bears clear this area, a retest of the August low of $77.64 (August 24) might loom on the horizon prior to the weekly low of $73.89 (July 17) and the crucial $70.00 level per barrel. South of here, the June low of $66.85 (June 12) appears, followed by the 2023 low of $63.61 (May 4) and the key $60.00 per barrel mark. Nonetheless, the weekly high of $89.83 (October 18) emerges as the immediate obstacle for bulls’ intentions ahead of the 2023 top of $94.99 (September 28). Further north, the weekly peak of $97.65 (August 30, 2022) comes before the psychological $100.00 per barrel.
Resistance levels: $85.85 $87.55 $89.82 (4H chart)
Support levels: $81.14 $77.56 $73.81 (4H chart)
GER40
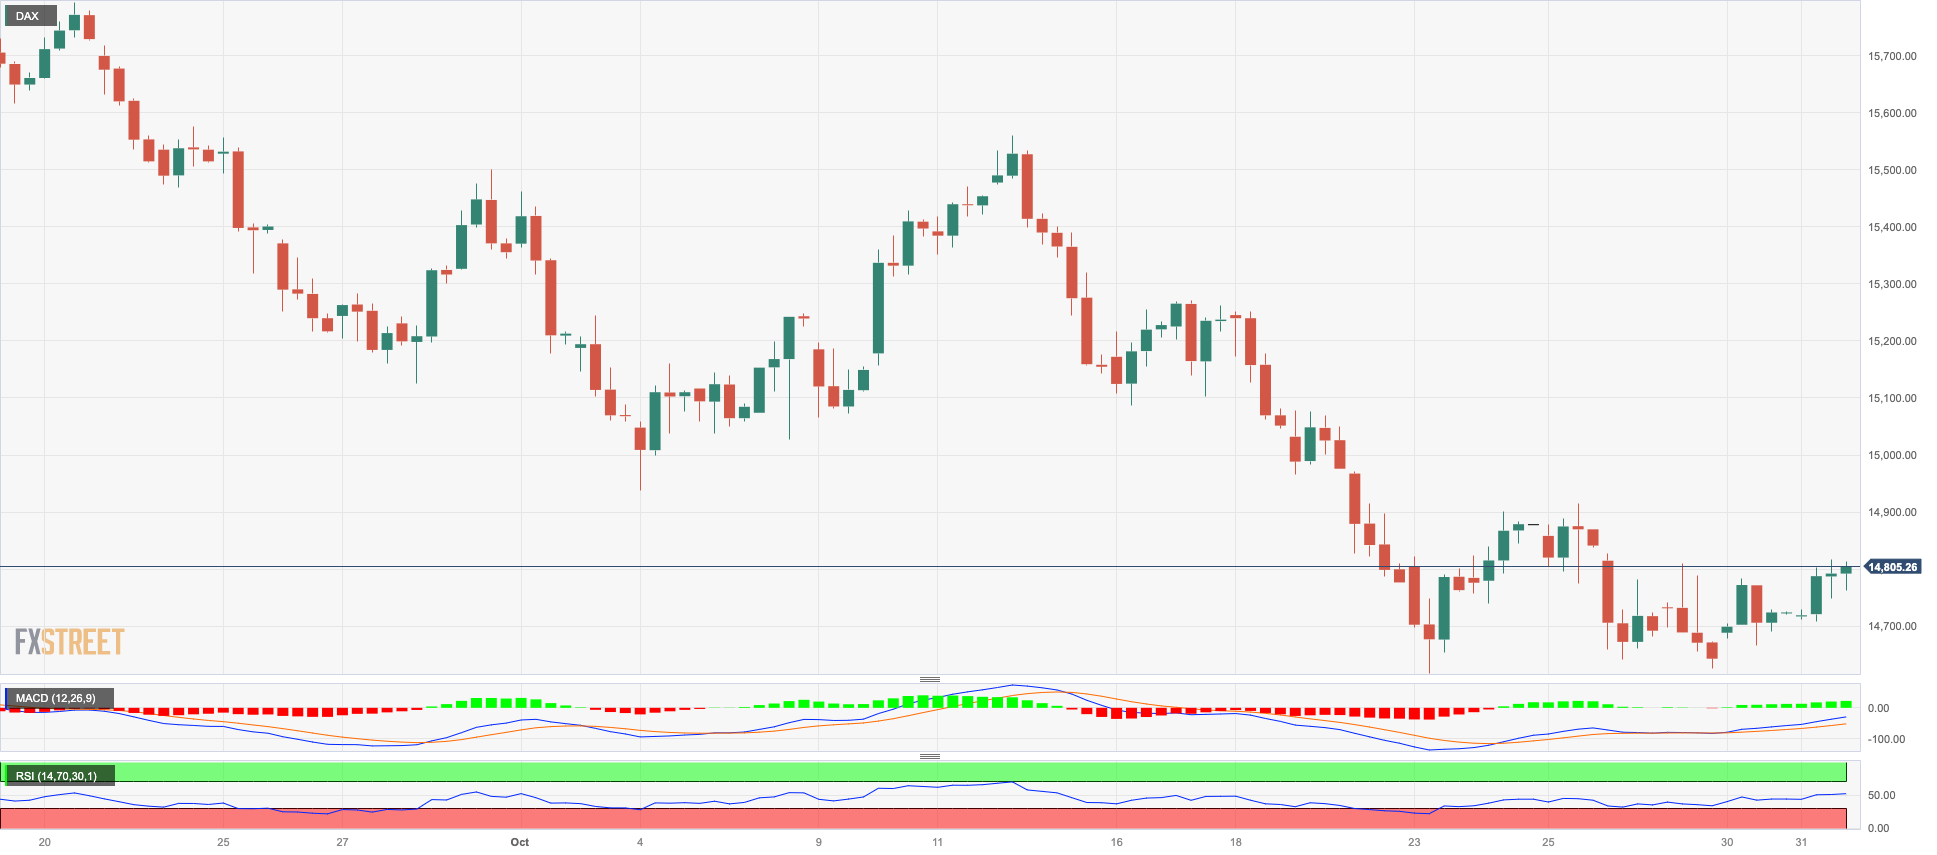
Germany’s benchmark DAX40 added to Monday’s gains and closed just above the 14800 region, up modestly for the day, on Tuesday.
The second uptick in a row in the index came on the back of easing geopolitical jitters, a quarterly contraction in the bloc’s economy during the third quarter, and further disinflationary pressures, as per October’s flash CPI.
Extra gains in the index this time came in contrast to a decline in the 10-year bund yields, which fell in line with their US peers.
The first upward obstacle is the October high of 15575 (October 12), which is immediately followed by the important 200-day SMA of 15641. Further north, the DAX40 might visit the September top of 15989 (September 15), seconded by the weekly peaks of 16042 (August 31) and 16060 (August 10). If this zone is trespassed, the index might strive for its all-time high of 16528 (July 31). Having said that, the resumption of the selling bias could drag the index to its October bottom of 14630 (October 23), before the March low of 14458 (March 20) and the December 2022 low of 13791 (December 20). The loss of the latter opens the door to a possible drop to the 2022 low of 11862 (September 28). The daily RSI rose past the 37 hurdle.
Best Performers: Sartorius AG VZO, Qiagen, BASF
Worst Performers: Dr Ing hc F Porsche Prf, Siemens Energy AG, Deutsche Bank AG
Resistance levels: 14933 15288 15575 (4H chart)
Support levels: 14630 14458 13791 (4H chart)
NASDAQ
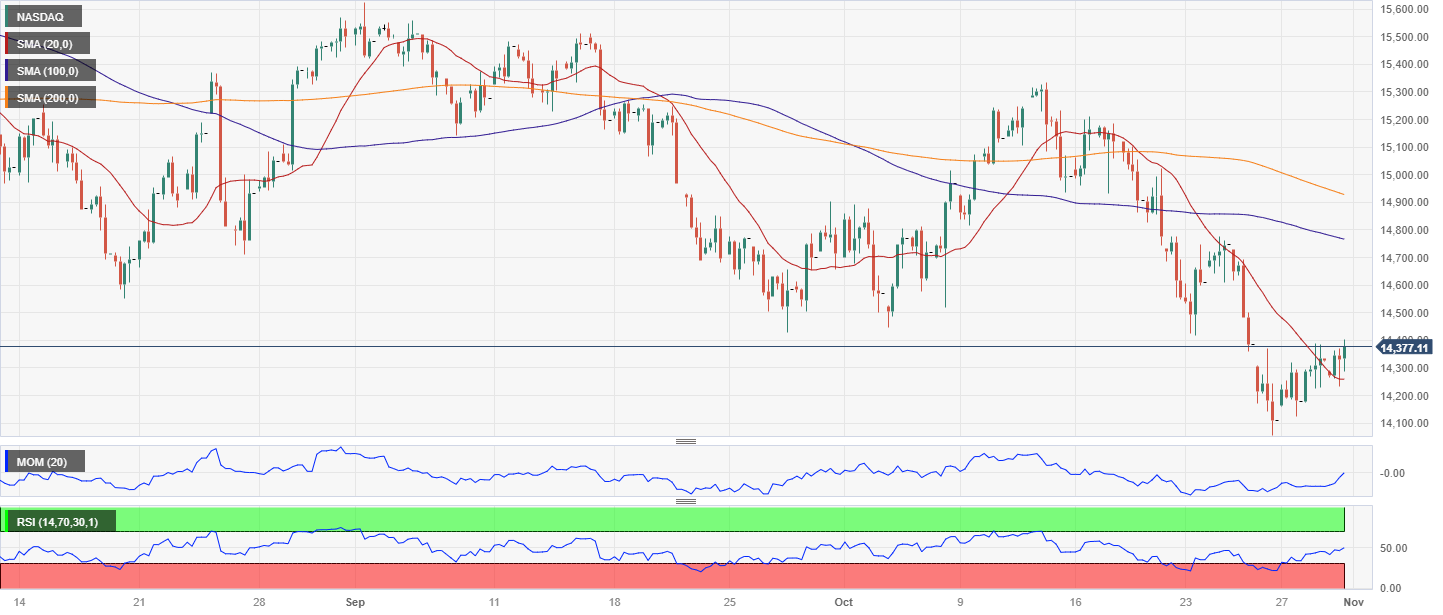
US tech equities gauged by the Nasdaq 100 advanced for the third consecutive session on turnaround Tuesday.
In fact, the index managed to extend further the rebound from last week’s five-month lows near the 14000 threshold (October 26), as investors’ kept the optimism unchanged ahead of the Fed’s interest rate decision on Wednesday, the stronger dollar, and alternating results from corporate earnings reports.
Extra upside in the Nasdaq 100 is expected to meet the next hurdle at the October high of 15333 (October 12), which is followed by the September top of 15618 (September 1) and the weekly peak of 15803 (July 31). If the index rises above this level, it may challenge the 2023 high of 15932 (July 19). Just the opposite, if sellers regain control, the index should find immediate support at the October low of 14058 (October 26). If this region is breached, the 200-day SMA of 13955 will be tested before hitting the April low of 12724 (April 25), then the March low of 11695 (March 13), and ultimately the 2023 low of 10696 (January 6). The day-to-day RSI rose above 41
Top Gainers: GE HealthCare, DexCom, The Trade Desk
Top Losers: Amgen, PDD Holdings DRC, ON Semiconductor
Resistance levels: 14774 15078 15333 (4H chart)
Support levels: 14058 13520 12724 (4H chart)
DOW JONES
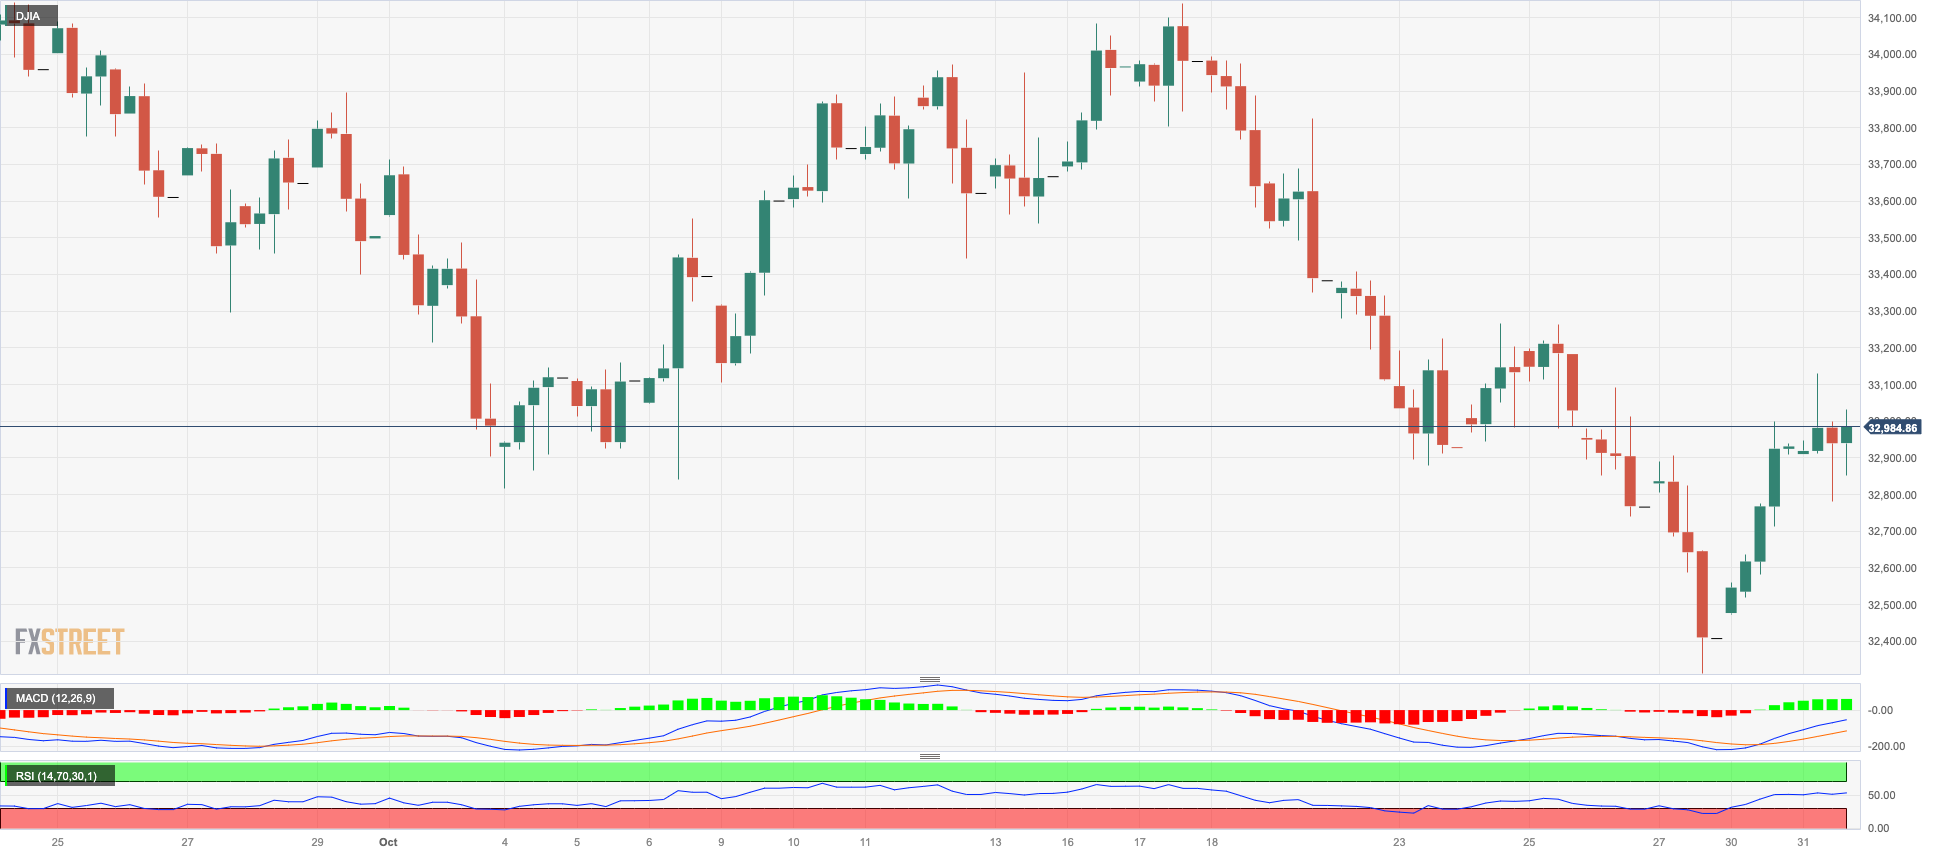
The US benchmark Dow Jones edged marginally higher and added to Monday’s advance on Tuesday, this time managing to reclaim the area above the key 33000 yardstick.
The small uptick in the index came amidst rising cautiousness ahead of the key FOMC event on Wednesday, while investors continued to assess the publication of corporate earnings reports.
Overall, the Dow Jones rose 0.31% to 33030, the S&P500 gained 0.50% to 4188, and the tech-reference Nasdaq Composite advanced 0.38% to 12838.
Further Dow Jones rebound is predicted to retest the critical 200-day SMA of 33799 prior to the October high of 34147 (October 17). A rally north from here should challenge the intermediate 100-day SMA at 34277 before the September top of 34977 (September 14) and the weekly peak of 35070 (August 31), both of which precede the 2023 high of 35679 (August 1). On the flip side, the October low of 32327 (October 27) provides early support ahead of the 2023 bottom of 31429 (March 15) and the 2022 low of 28660 (October 13). The daily RSI ticked higher past 42
Top Performers: Boeing, 3M, Honeywell
Worst Performers: Caterpillar, Amgen, Chevron
Resistance levels: 33272 34147 34286 (4H chart)
Support levels: 32327 31429 30206 (4H chart)
MACROECONOMIC EVENTS

All Information & Updates provided by:

All information relating to the financial markets available on this page has been prepared and issued by FXStreet (Forexstreet SL, Spain, Reg: B62498233) on the basis of publicly available information and all information believed to be reliable and does not conflict with Kuwaiti local laws, and all necessary care has been taken to before the company to ensure that the facts mentioned are correct from the source.
NCM Investment nor any of its directors or employees shall in any way be held responsible for the contents of this news, and the information contained on this page is intended only to provide clients with publicly available information and should not be construed as investment advice, report or analysis and/or constitute an offer or invitation to buy or sell financial instruments of any kind.
RISK WARNING: Forex and CFDs are highly risky leveraged products, as losses can exceed deposits. Please ensure you understand all the risks and take independent advice if necessary. NCM will segregate the clients based on the criteria of the regulator and its bylaws. NCM does not provide any advisory service; the material published does not constitute advice or a recommendation for a transaction in any financial instrument. NCM accepts no responsibility for any use of the content presented and any consequences of that use. Anyone acting on the information provided does so at their own risk.