
- Contact Us:
-

-

-

-


Daily Market Updates
02 Nov 2023
USDJPY
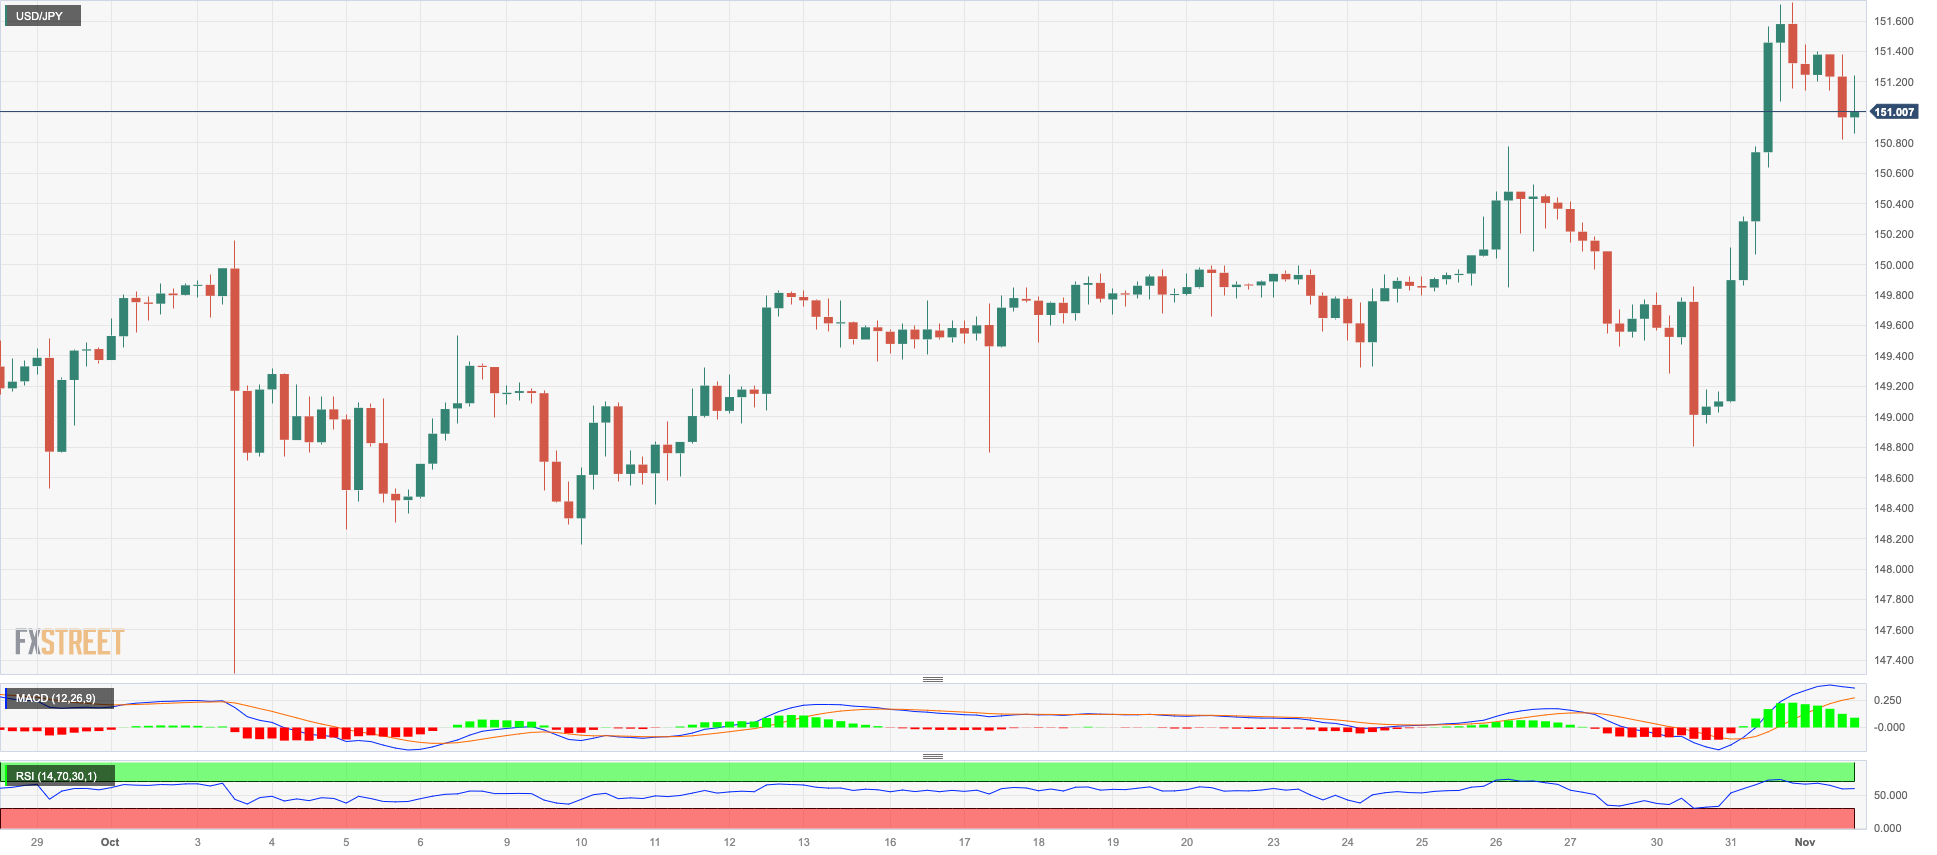
USD/JPY saw Tuesday’s robust uptick trimmed somewhat on Wednesday, returning to the 151.00 neighbourhood amidst rising speculation of further FX intervention by the BoJ and the government.
On the latter, Top Currency Diplomat Kanda expressed his concerns about one-sided sudden moves in currencies.
The pair’s daily pullback came amidst another pronounced rebound in the greenback and declining US yields across different maturities, while the JGB 10-year yields flirted with the 0.97% level for the first time since May 2013 before the BoJ’s unscheduled bond purchase operation.
In the Japanese docket, the final Jibun Bank Manufacturing PMI improved to 48.7 during the last month.
The surpass of the YTD high of 151.72 (October 31), should put USD/JPY en route to a test of the 2022 top of 151.94 (October 21), closely followed by the round level of 152.00. In contrast, the weekly low of 148.16 (October 10) looks to be supported by the transitory 55-day SMA (148.21) and comes before the October low of 147.27 (October 3). From here, the next support turns up at the weekly low of 145.89 (September 11) before the September low of 144.43. (September 1). There are no substantial support levels from this region until the August low of 141.50 (August 7), which is above the 200-day SMA of 140.16 and the July low of 137.23. (July 14). The daily RSI dropped below the 60 yardstick.
Resistance levels: 151.72 151.94 152.00 (4H chart)
Support levels: 149.25 148.80 148.16 (4H chart)
GBPUSD
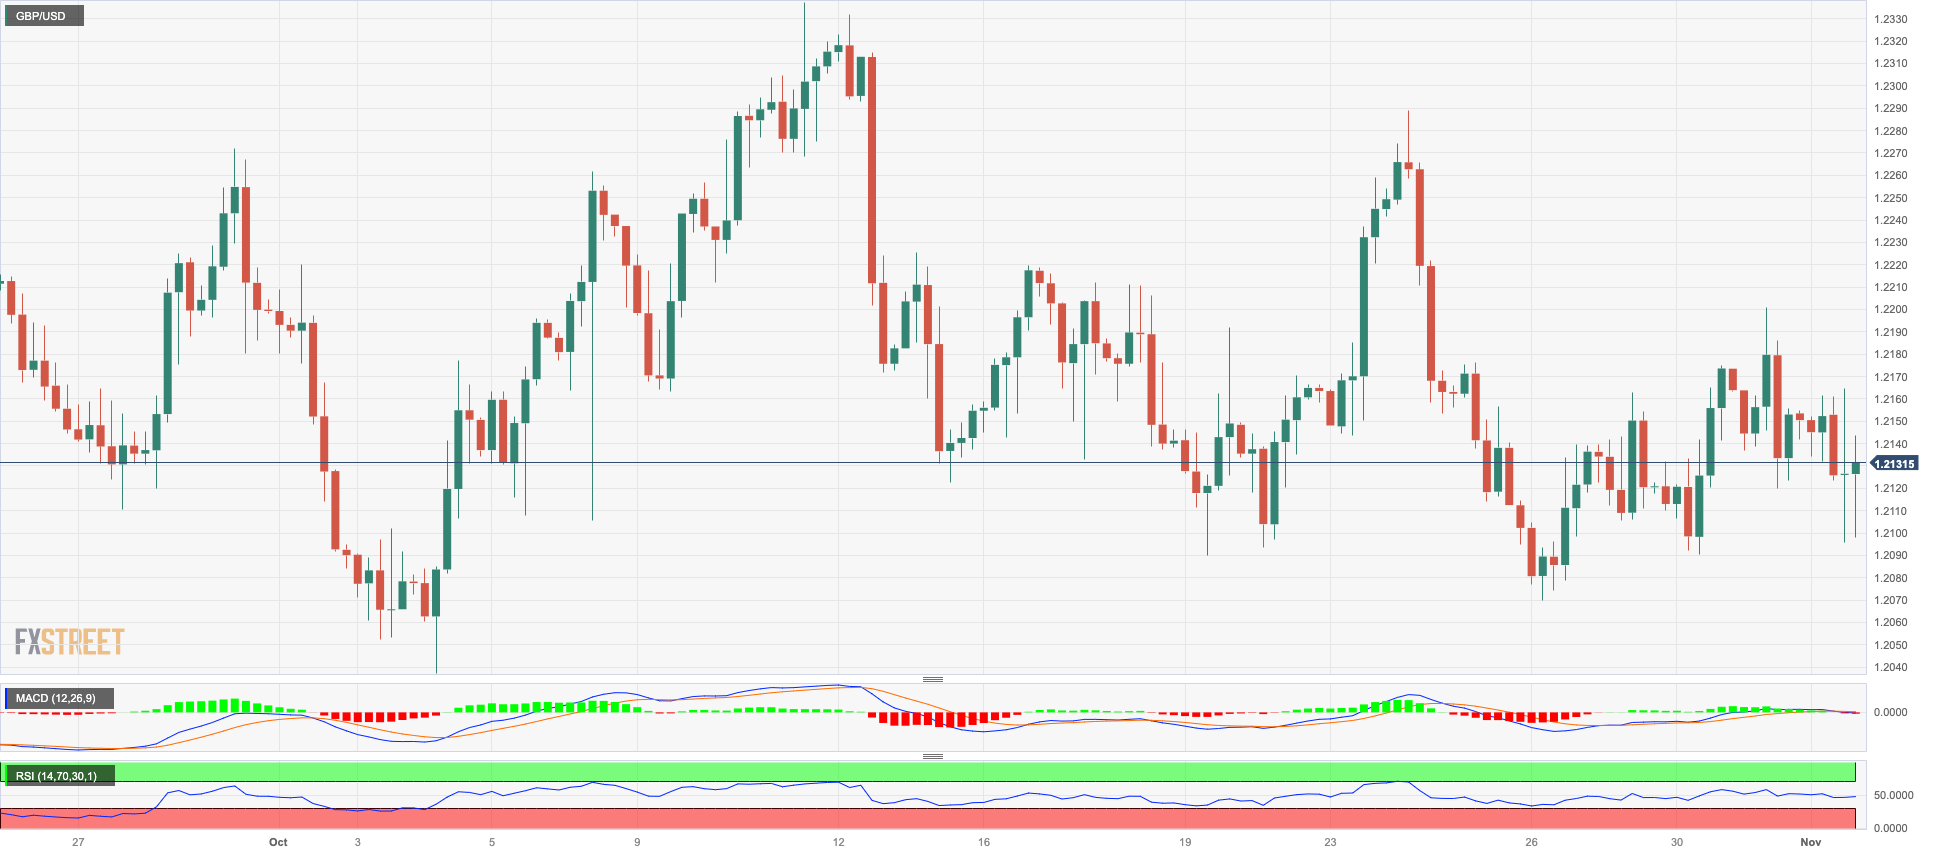
GBP/USD traded on the defensive for the second session in a row and briefly pierced the key support at 1.2100 the figure on Wednesday.
Further weakness in Cable came on the back of the persistent move higher in the greenback, which helped the USD Index (DXY) reclaim the area around the key 107.00 barrier.
In addition, rising cautiousness among traders ahead of the key BoE event later in the week collaborated with the selling pressure surrounding the British pound midweek. Regarding this event, market participants expect another dovish hold by the “Old Lady”.
In the UK, house prices tracked by Nationwide rose 0.9% MoM in October and contracted 3.3% from a year earlier. In addition, the final S&P Global/CIPS Manufacturing PMI came in at 44.8 in October, a tad lower than the preliminary reading.
If the selling trend resumes, GBP/USD might retest the October bottom of 1.2037 (October 3), just above the critical 1.2000 barrier and before the 2023 low of 1.1802 (March 8). The initial level of resistance for Cable, on the other hand, is the weekly high of 1.2288 (October 24), followed by the October top of 1.2337 (October 11), and the 200-day SMA at 1.2434. Above this level, the weekly peak of 1.2548 (September 11) awaits, prior to the transitory 100-day SMA at 1.2555. Following its removal, the weekly high of 1.2746 (August 30) emerges, seconded by weekly tops of 1.2818 (August 10) and 1.2995 (July 27), both of which come before the psychological 1.3000 level. The daily RSI receded to the sub-44 zone.
Resistance levels: 1.2200 1.2288 1.2337 (4H chart)
Support levels: 1.2069 1.2037 1.1802 (4H chart)
AUDUSD
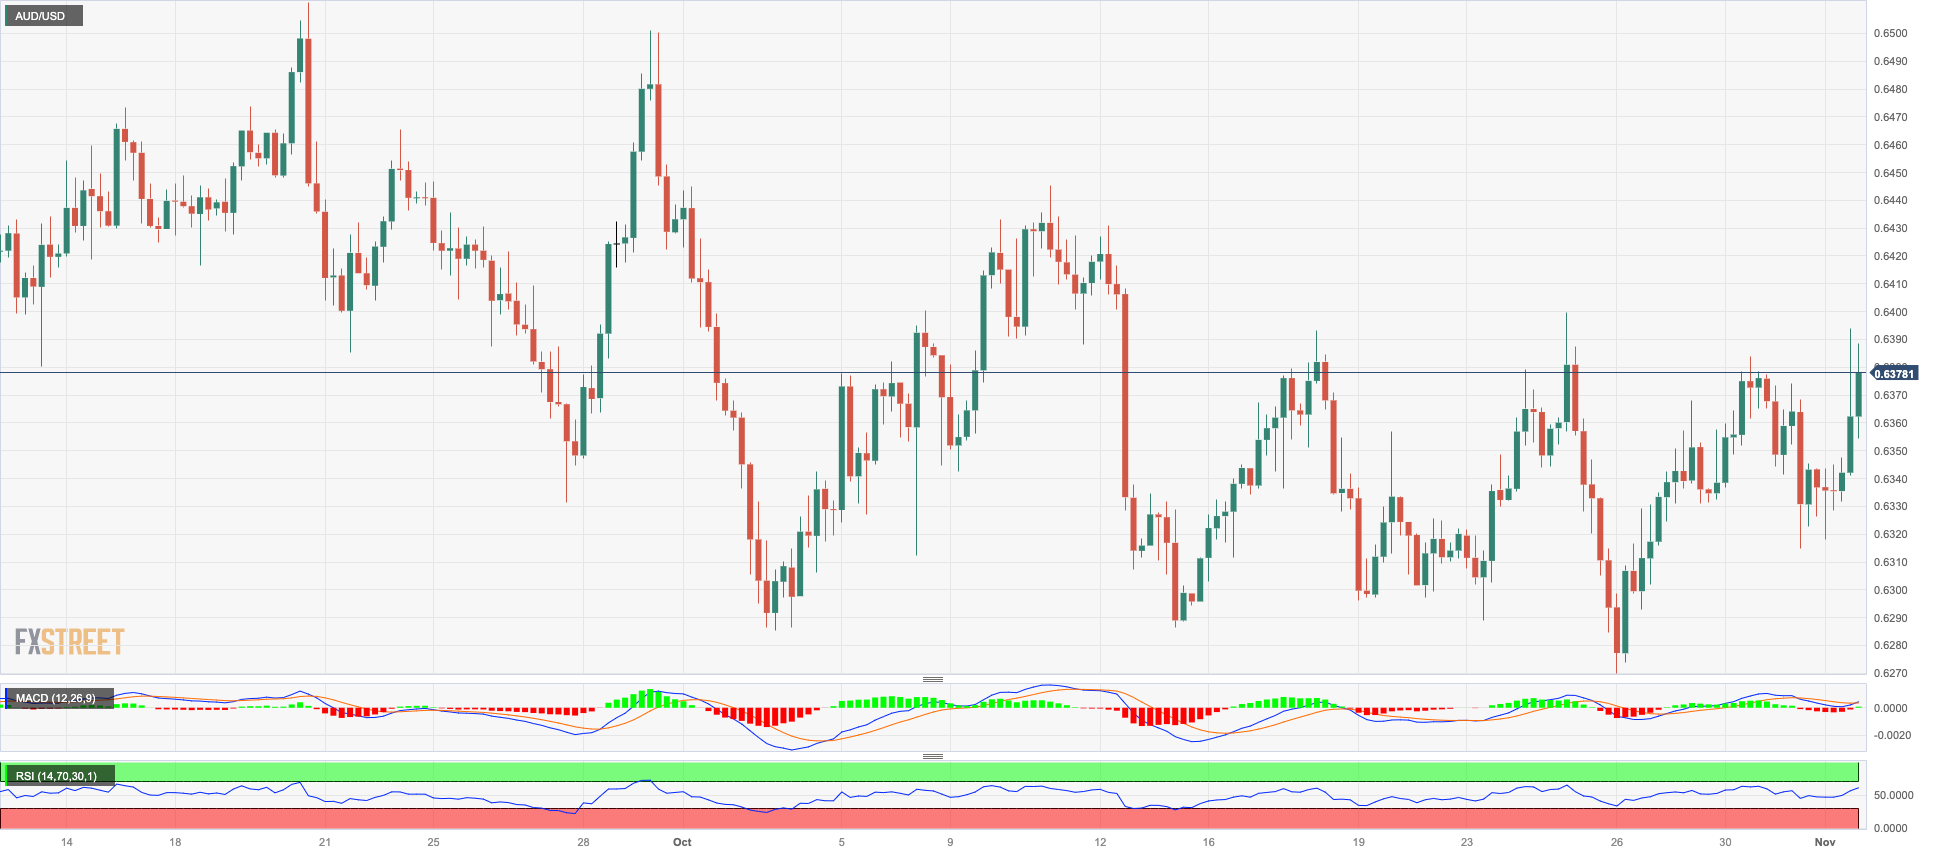
Despite another positive session in the greenback, AUD/USD managed to advance markedly and regain the vicinity of the 0.6400 mark on Wednesday.
The firm price action in the Aussie dollar appears to have been propped up by the mixed performance of the commodity universe at a time when the currency seems to have also ignored another disappointing print from Chinese PMIs.
In Oz, flash Building Permits contracted at a monthly 4.6% in September, while Commodity Prices dropped 16.8% in the year to October.
The October high of 0.6445 (October 11) is next on the upside for AUD/USD, followed by the weekly top of 0.6501 (September 29) and the September peak of 0.6521 (September 1), which appears bolstered by the temporary 100-day SMA (0.6522). North from here emerges the weekly high of 0.6616 (August 10) and the 200-day SMA at 0.6626. Further gains may take the pair to its July top of 0.6894 (July 14), then to its June peak of 0.6899 (June 16), and eventually to the critical 0.7000 mark. If bears regain control, the pair may reach the 2023 low of 0.6270 (October 26) before hitting the round level of 0.6200 and the 2022 low of 0.6179 (October 13). The RSI on the daily chart climbed beyond the 53 level.
Resistance levels: 0.6399 0.6445 0.6501 (4H chart)
Support levels: 0.6314 0.6270 0.6210 (4H chart)
GOLD
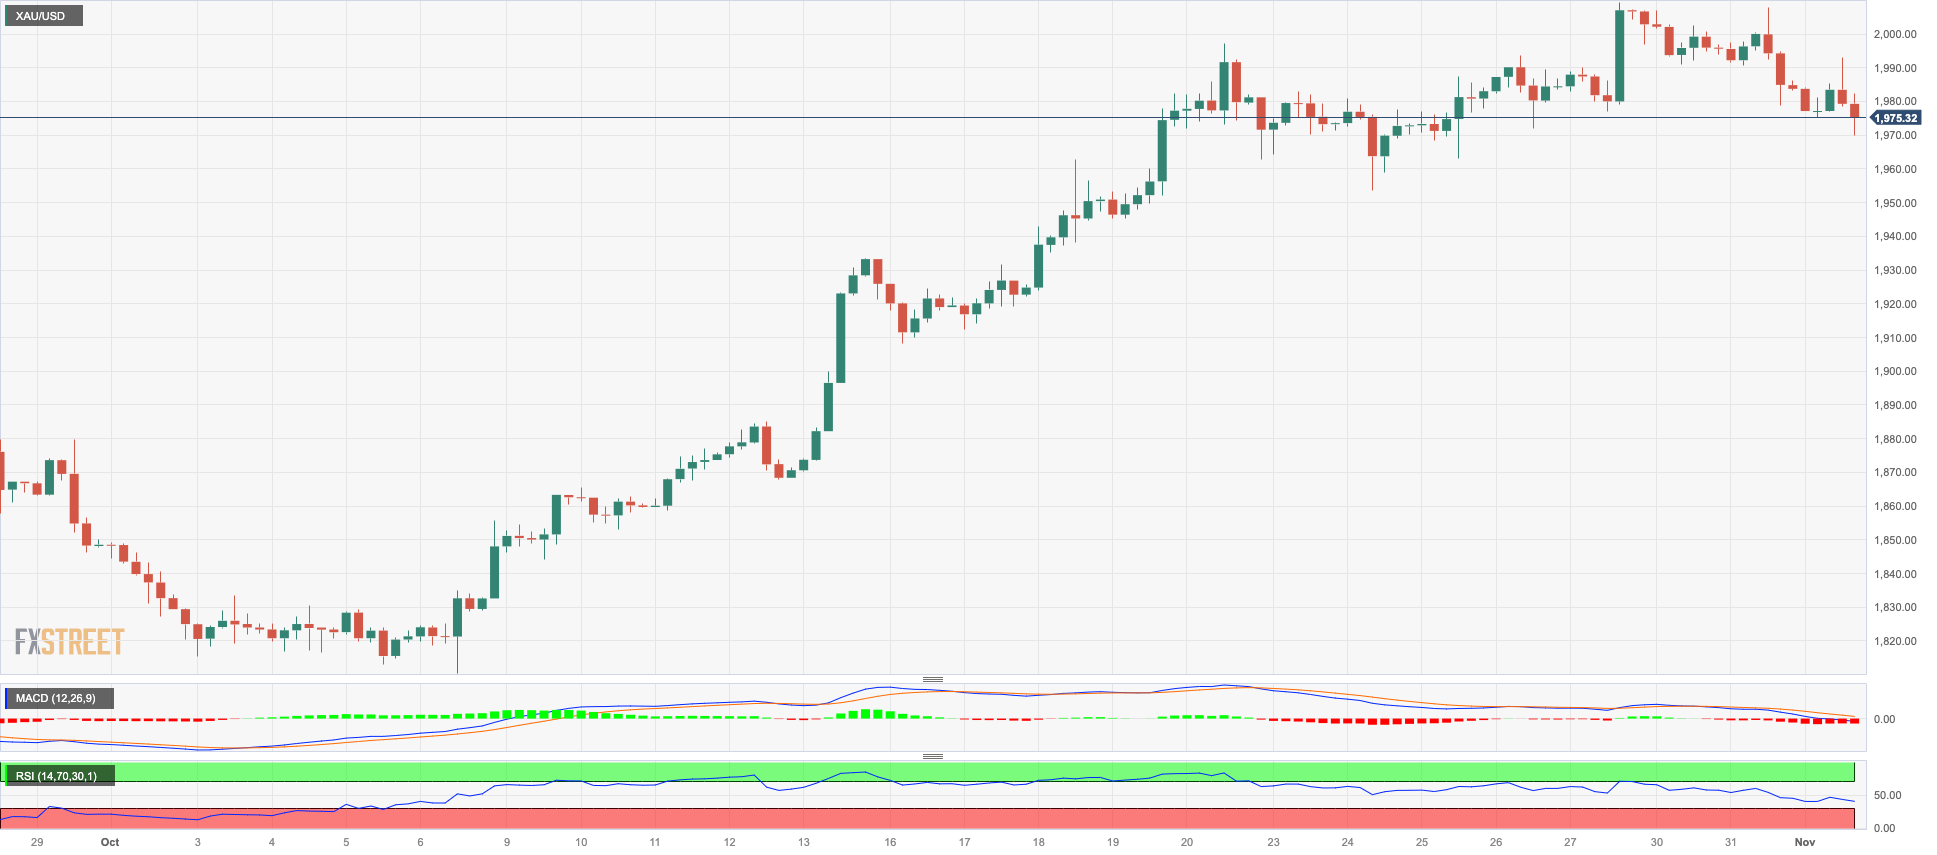
Gold prices remained on the defensive for the third straight session on Wednesday, this time slipping back to the proximity of the $1970 region per troy ounce.
The persistent selling bias in the precious metal came on the back of the persevering march north in the greenback, despite US yields being corrected further down midweek. The steady downward bias in bullion remained well in place after the Fed kept its interest rates unchanged, as expected, while Chair Powell delivered a cautious approach at his press conference.
On the positive side for the yellow metal, unabated geopolitical concerns stemming from the Middle East crisis should keep the yellow metal somewhat supported for the time being.
Once gold leaves behind the October high of $2009 (October 27), it could then aim for the 2023 top of $2067 (May 4), then the 2022 peak of $2070 (March 8) and the all-time high of $2075 (August 7, 2020). Just the opposite, there is a minor support at the weekly low of $1953 (October 24) ahead of the key 200-day SMA at $1933. A deeper decline might cause the provisional 55-day SMA at $1916 to reappear on the horizon ahead of the October low of $1810 (October 6). The breakdown of this level exposes the 2023 bottom of $1804 (February 28) and the key support zone of $1800.
Resistance levels: $2009 $2022 $2048 (4H chart)
Support levels: $1969 $1953 $1914 (4H chart)
CRUDE WTI
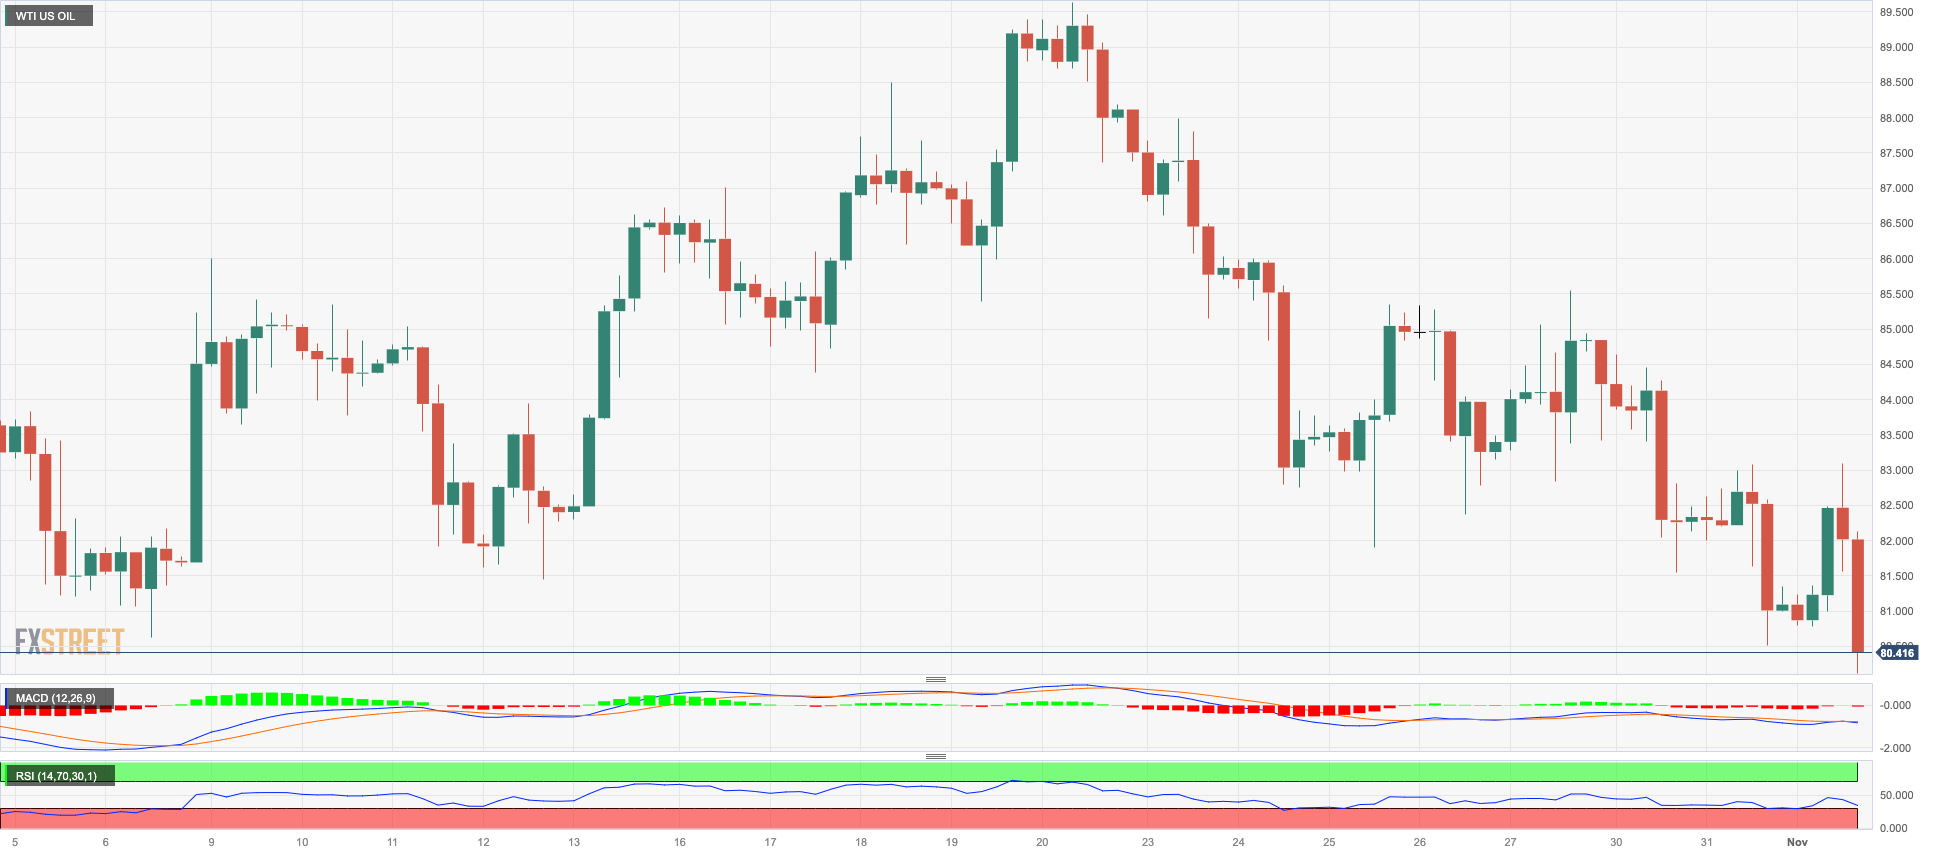
Prices of WTI remained on the back foot and navigated the area of nine-week lows near the $80.00 mark per barrel on Wednesday.
In fact, the sharp rebound in the greenback contributed to the downside pressure around the commodity, while geopolitical concerns and the potential impact on the supply of crude oil seem to have limited the weekly drop for the time being.
On the calendar, the EIA reported that US crude oil inventories went up by 0.774M barrels in the week to October 27, while supplies at Cushing increased by 0.272M barrels, Weekly Distillate Stocks dropped by 0.792M barrels and gasoline stockpiles rose by 0.065M barrels.
Further losses may push WTI down to the vital $80.00 level, ahead of the important 200-day SMA at $78.15. If bears break through this barrier, a retest of the August low of $77.64 (August 24) is possible before the weekly low of $73.89 (July 17) and the critical $70.00 mark per barrel. The June low of $66.85 (June 12) shows south of here, followed by the 2023 low of $63.61 (May 4) and the critical $60.00 per barrel mark. On the flip side, the weekly top of $89.83 (October 18) stands in the way of bulls' plans ahead of the 2023 peak of $94.99. (September 28). Further north, the weekly high of $97.65 (August 30, 2022) arrives before the psychologically significant $100.00 threshold per barrel.
Resistance levels: $83.38 $85.85 $87.55 (4H chart)
Support levels: $80.35 $77.56 $73.81 (4H chart)
GER40
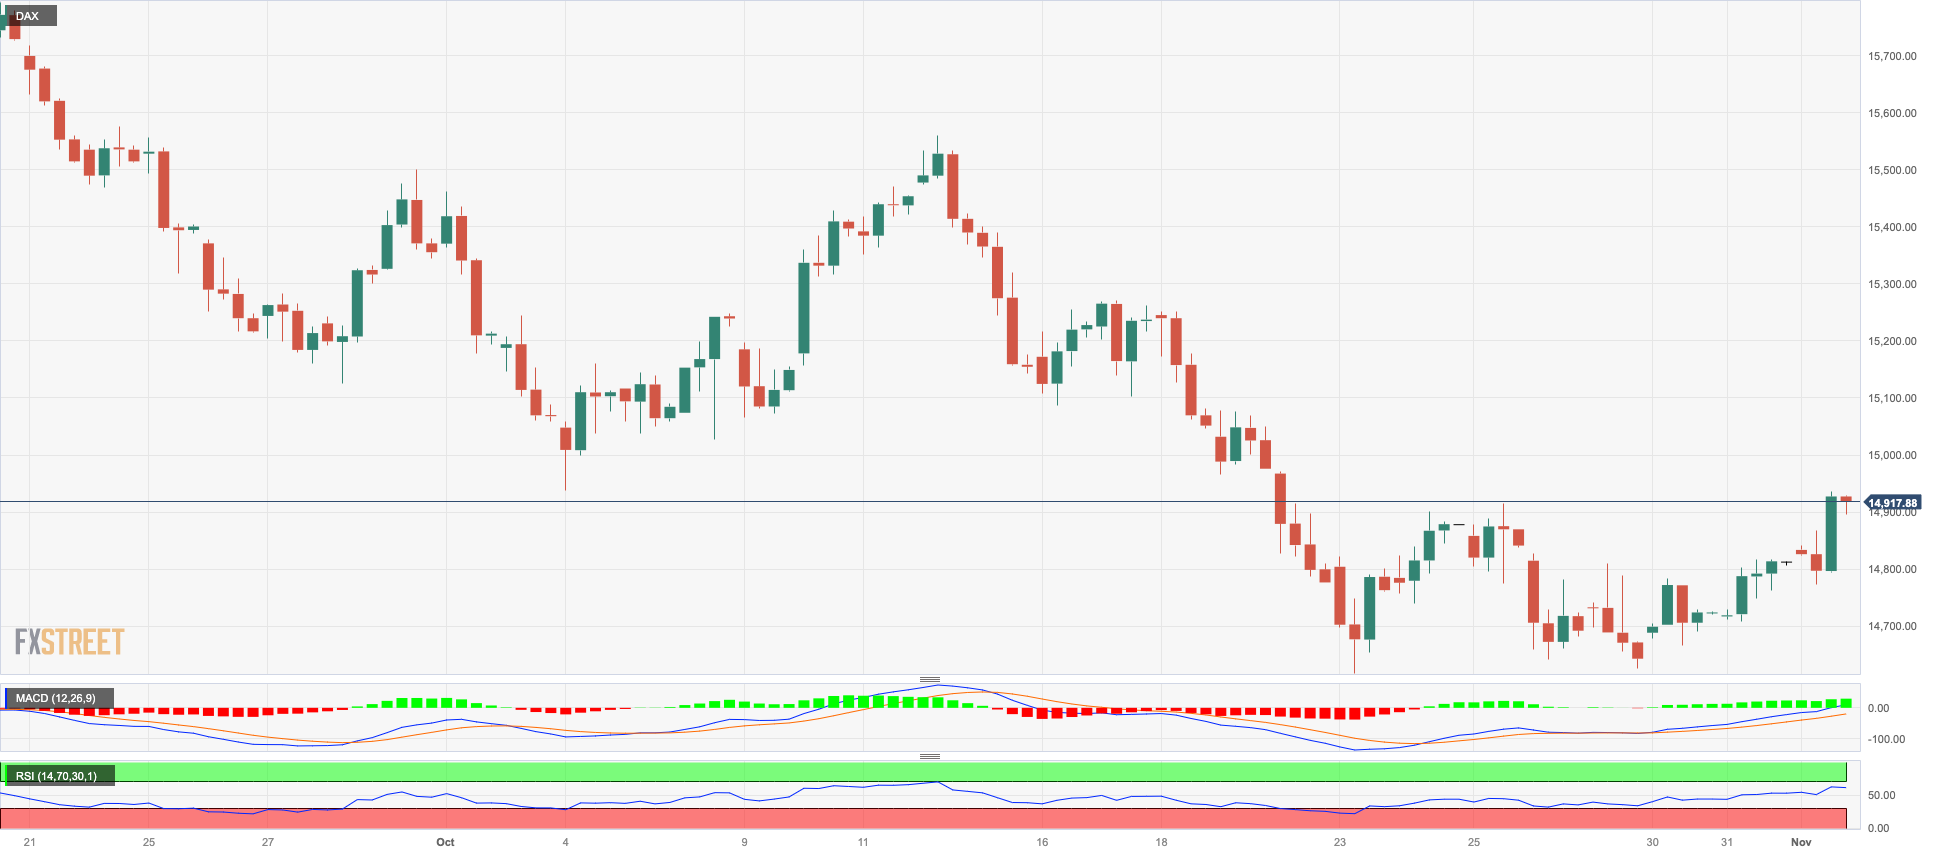
German stocks gauged by the DAX40 added to the weekly rebound and closed at shouting distance from the key 15000 threshold on Wednesday.
The third daily advance in a row in the index came as European investors largely anticipated the Fed to keep its interest rates unchanged at its event on Wednesday.
Also adding to the upbeat sentiment, traders’ expectations remain well in place for a protracted impasse by the ECB, particularly following the latest retracement in the euro zone’s consumer prices.
Wednesday’s uptick in equities came once again in contrast to another pullback in the 10-year bund yields, this time revisiting multi-day lows around 2.75%.
The initial upward barrier is the October high of 15575 (October 12), which is closely followed by the key 200-day SMA of 15641. Further north, the DAX40 may reach the September top of 15989 (September 15), seconded by the weekly peaks of 16042 (August 31) and 16060 (August 10). If this zone is cleared, the index may attempt to reach its all-time high of 16528 (July 31). Instead, a continuation of the selling tendency may bring the index down to its October low of 14630 (October 23), before the March low of 14458 (March 20) and the December 2022 low of 13791 (December 20). The loss of the latter opens the door to a probable reduction to the 2022 low of 11862 (September 28). The daily RSI climbed to the boundaries of 44.
Best Performers: Hannover Rueck SE, Sartorius AG VZO, Rheinmetall AG
Worst Performers: BASF, Siemens Energy AG, Bayer
Resistance levels: 14949 15288 15575 (4H chart)
Support levels: 14630 14458 13791 (4H chart)
NASDAQ
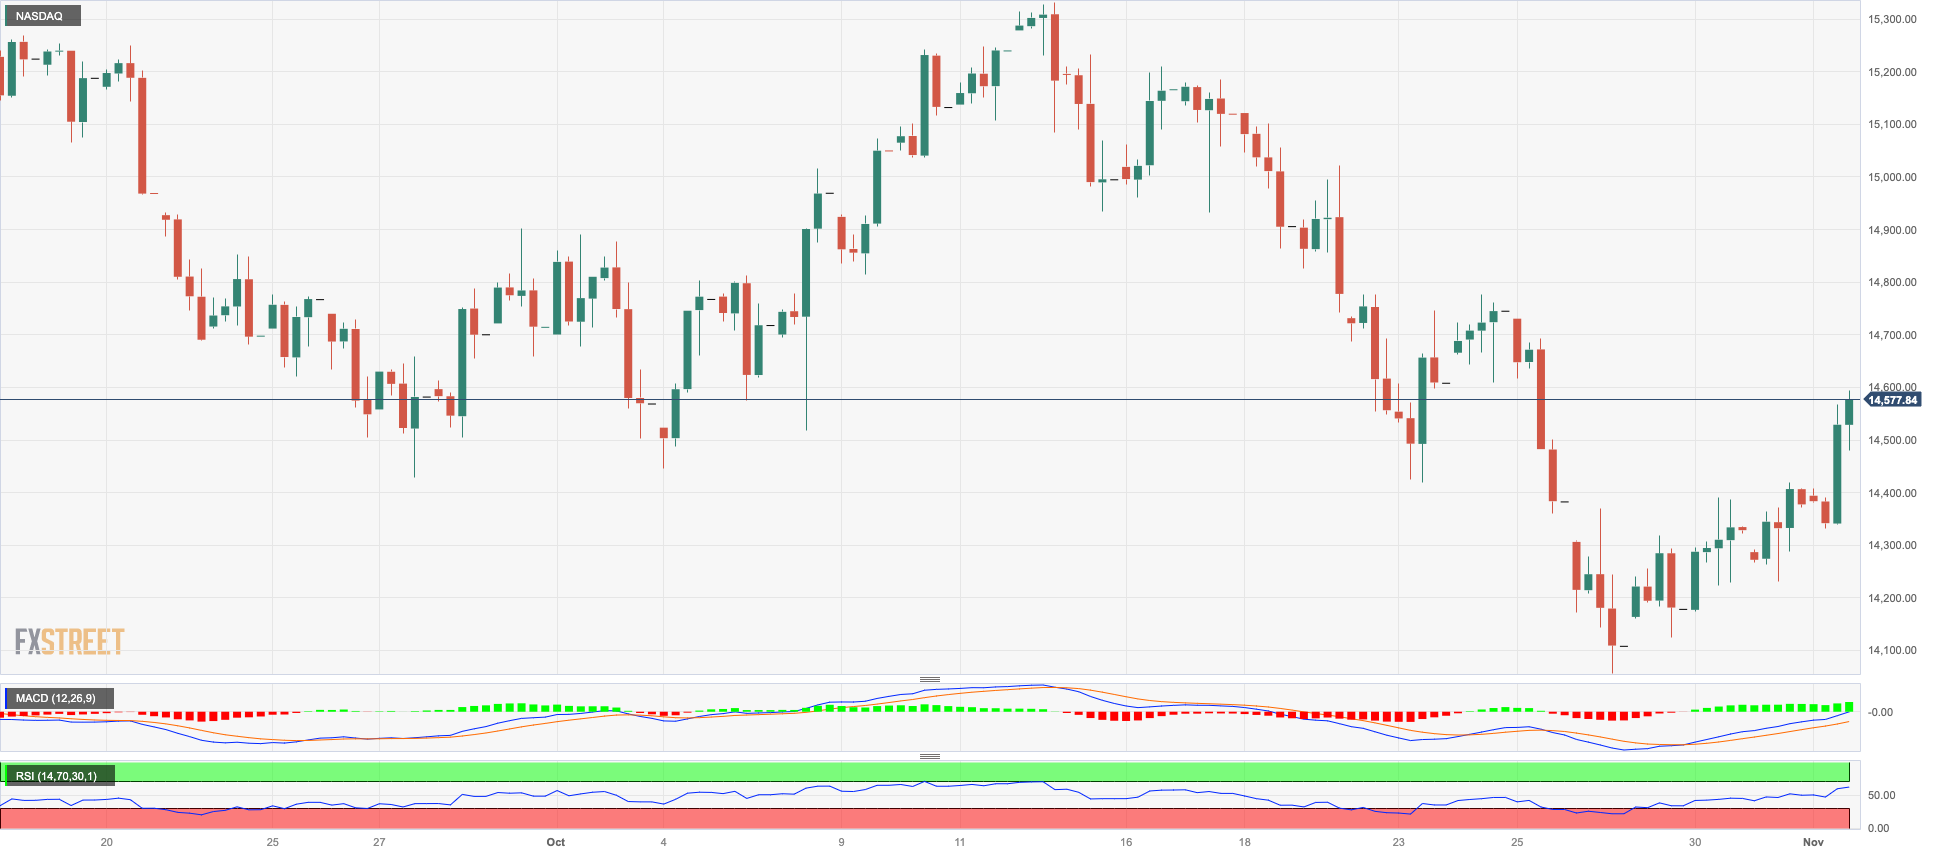
Another positive session in the US tech sector saw the benchmark Nasdaq 100 advance for the fourth consecutive session, approaching the 14600 region, or five-day peaks, on Wednesday.
Extra gains in the index, in the meantime, came despite the strong performance of the dollar and further weakness in US yields across different timeframes, all following the cautious stance from Chair Powell in the wake of the Fed’s interest rate decision.
Extra upward in the Nasdaq 100 is projected to face temporary up-barrier at the 55-day and 100-day SMAs AT 14937 and 15079, respectively, ahead of the October high of 15333 (October 12). The surpass of the latter could pave the way for a move to the September top of 15618 (September 1) and the weekly peak of 15803 (July 31). If the index advances beyond this level, it might threaten the 2023 high of 15932 (July 19). If sellers retake control, the index should find quick support at the October low of 14058 (October 26) just ahead of the significant 200-day SMA of 13970. South from here comes the April low of 12724 (April 25), followed by the March bottom of 11695 (March 13), and finally the 2023 low of 10696 (January 6). The RSI for the day rose past 45.
Top Gainers: AMD, DexCom, Kraft Heinz
Top Losers: Enphase, ADP, Paychex
Resistance levels: 14589 15078 15333 (4H chart)
Support levels: 14058 13520 12724 (4H chart)
DOW JONES
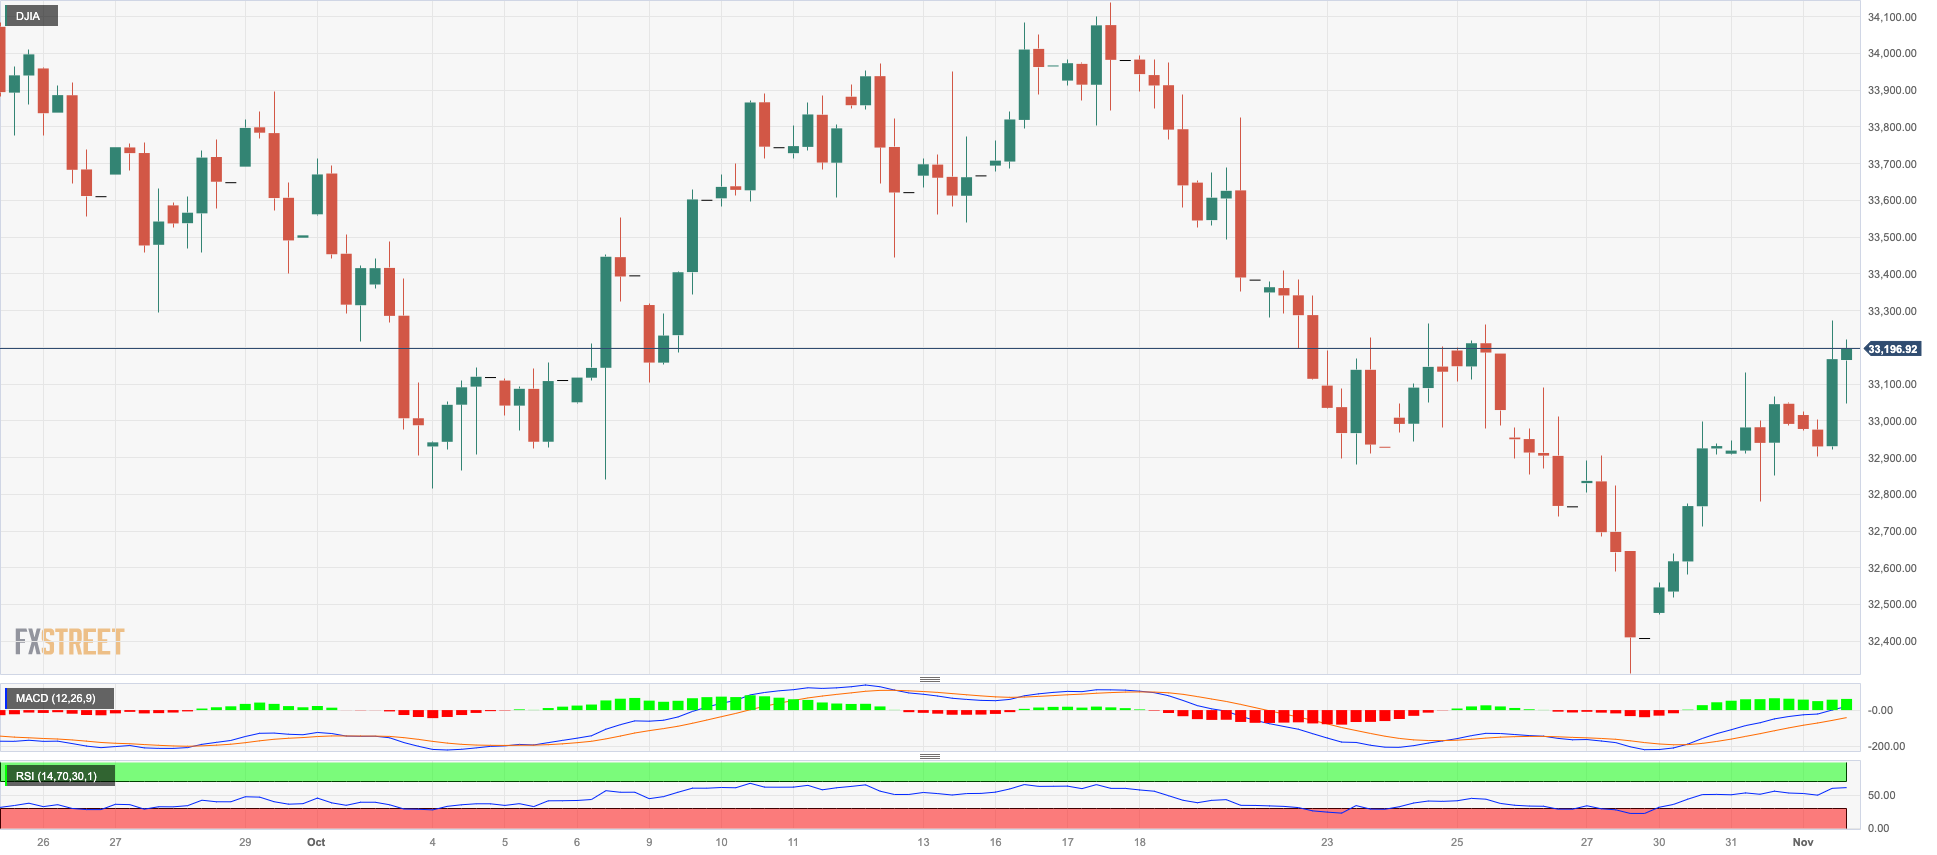
US stocks advanced modestly beyond the 33000 yardstick when tracked by the Dow Jones on Wednesday, clinching at the same time the third consecutive session of gains.
In the meantime, investors managed to keep the bid bias unchanged despite the cautious tone from the Fed’s Powell at his press conference after the Federal Reserve maintained its interest rate unchanged, as widely anticipated.
On the whole, the Dow Jones advanced 0.69% to 33281, the S&P500 rose 1.01% to 4236, and the tech-heavy Nasdaq Composite gained 1.33% to 13020.
Next on the upside for the Dow Jones comes the crucial 200-day SMA of 33796 ahead of the October high of 34147 (October 17). A rally north from here might test the intermediate 100-day SMA at 34271 before the September top of 34977 (September 14) and the weekly peak of 35070 (August 31), all of which precede the 2023 high of 35679 (August 1). On the downside, the October low of 32327 (October 27) offers early support before the 2023 bottom of 31429 (March 15) and the 2022 low of 28660 (October 13). The daily RSI improved to the 47 region.
Top Performers: Microsoft, Caterpillar, Amgen
Worst Performers: Nike, Walgreen Boots, Dow
Resistance levels: 33796 34147 34286 (4H chart)
Support levels: 32327 31429 30206 (4H chart)
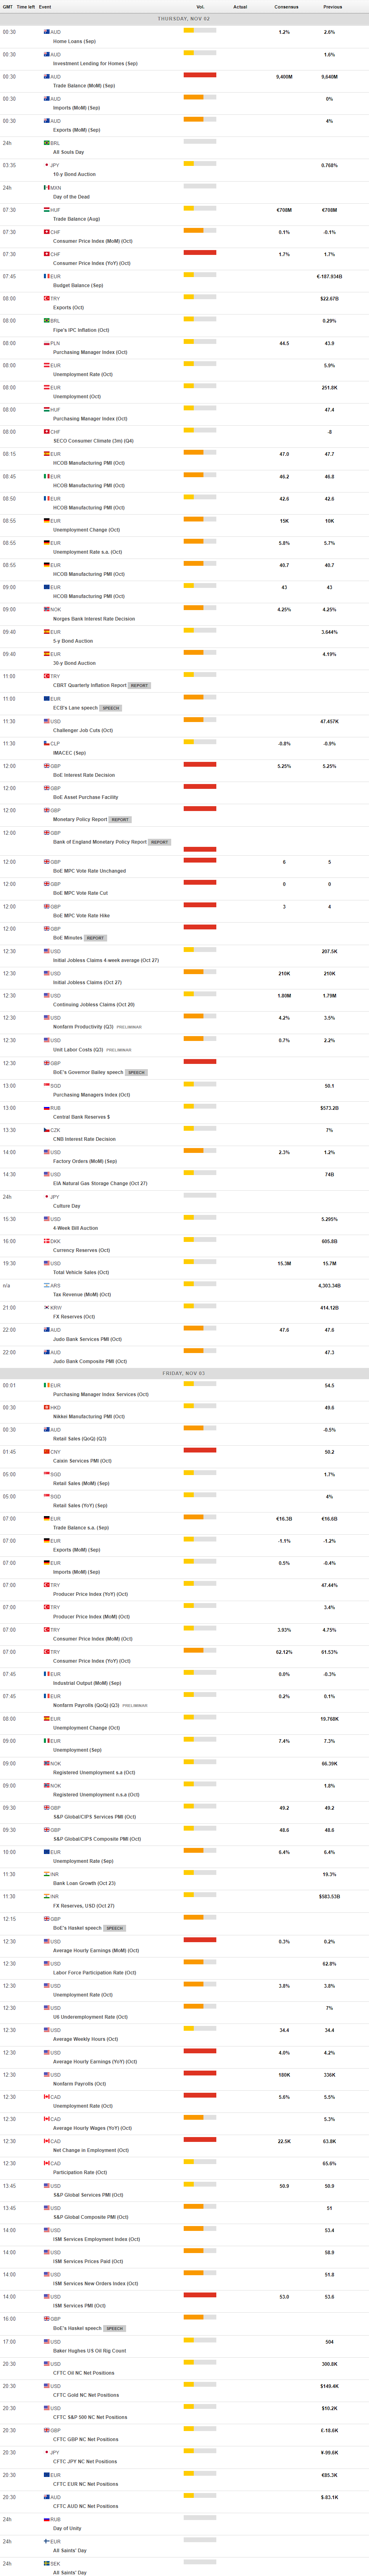
MACROECONOMIC EVENTS
All Information & Updates provided by:

All information relating to the financial markets available on this page has been prepared and issued by FXStreet (Forexstreet SL, Spain, Reg: B62498233) on the basis of publicly available information and all information believed to be reliable and does not conflict with Kuwaiti local laws, and all necessary care has been taken to before the company to ensure that the facts mentioned are correct from the source.
NCM Investment nor any of its directors or employees shall in any way be held responsible for the contents of this news, and the information contained on this page is intended only to provide clients with publicly available information and should not be construed as investment advice, report or analysis and/or constitute an offer or invitation to buy or sell financial instruments of any kind.
RISK WARNING: Forex and CFDs are highly risky leveraged products, as losses can exceed deposits. Please ensure you understand all the risks and take independent advice if necessary. NCM will segregate the clients based on the criteria of the regulator and its bylaws. NCM does not provide any advisory service; the material published does not constitute advice or a recommendation for a transaction in any financial instrument. NCM accepts no responsibility for any use of the content presented and any consequences of that use. Anyone acting on the information provided does so at their own risk.