
- Contact Us:
-

-

-

-


Daily Market Updates
03 Nov 2023
USDJPY
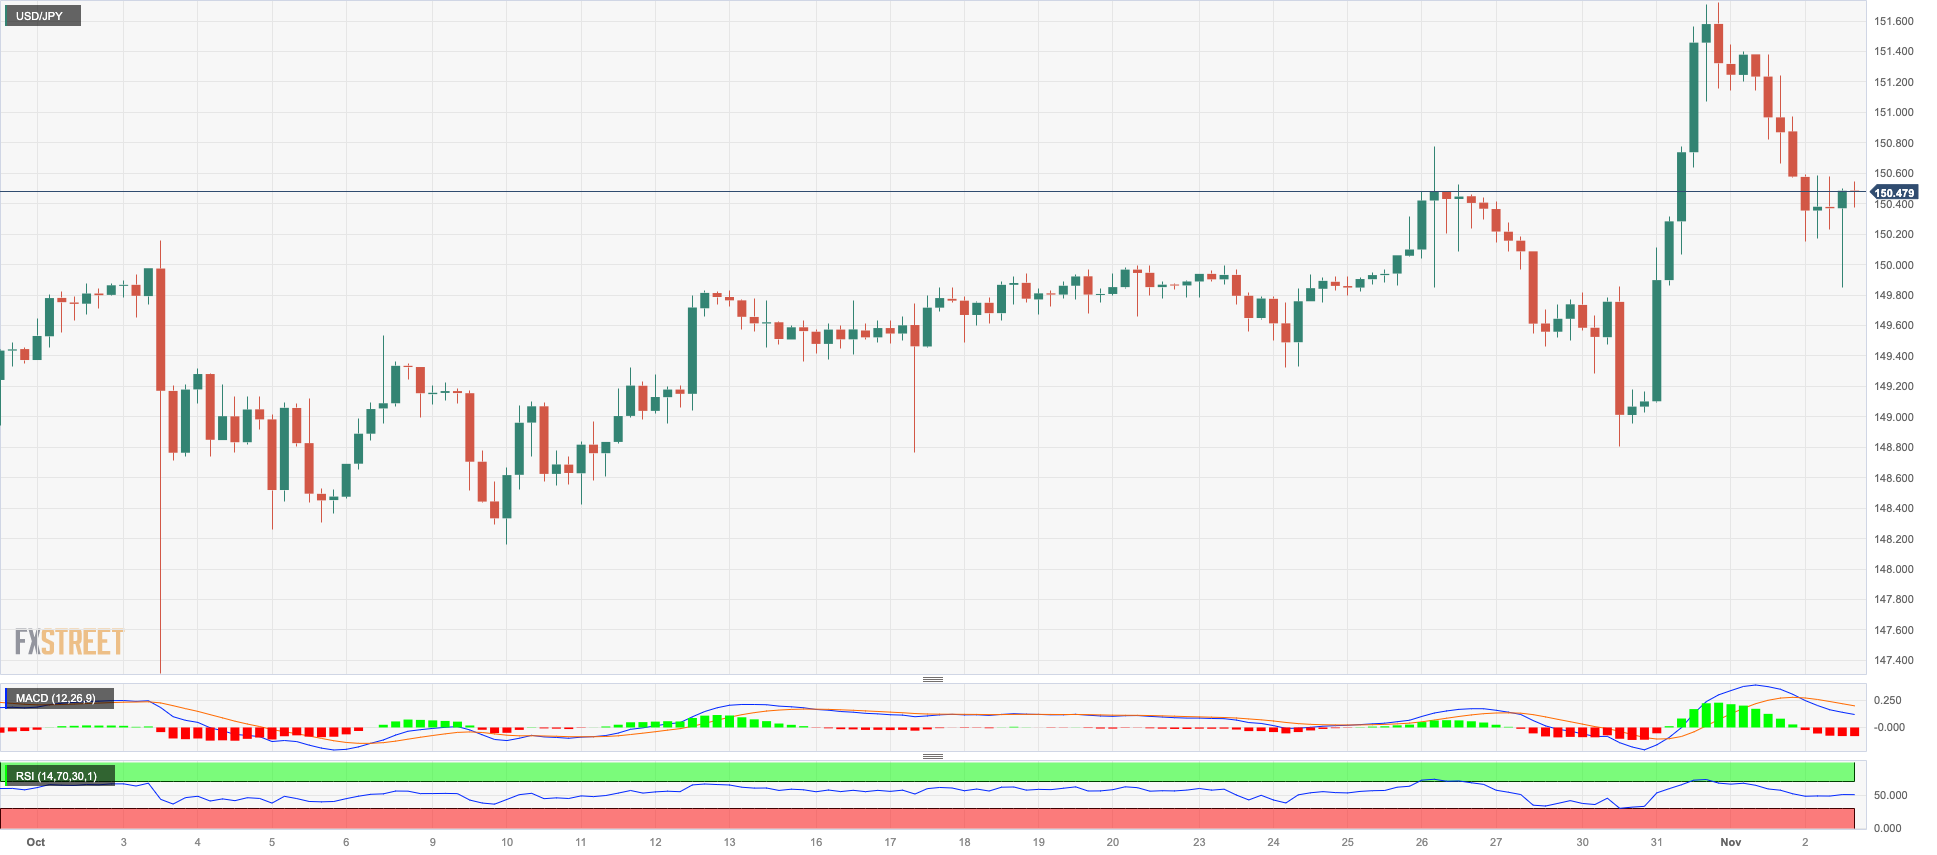
USD/JPY extended further its corrective move from recent yearly highs in the 151.70 region and briefly slipped back to the sub-150.00 zone on Thursday.
The pair’s daily retracement came on the back of the sharp sell-off in the greenback and extra weakness in US yields across different maturities, while the JGB 10-year yields retreated to the 0.92% zone.
On another front, Japan PM F. Kishida announced a stimulus package amounting to over JPY17 trillion. The measures are intended to catalyse economic expansion and provide assistance to households strained by rising inflation.
In the Japanese docket, Foreign Bond Investment increased by ¥238.5B in the week to October 28.
The break of the 2023 high of 151.72 (October 31) could send USD/JPY back to the 2022 high of 151.94 (October 21), closely followed by the round level of 152.00. The weekly low of 148.16 (October 10) appears to be supported by the transitory 55-day SMA (148.29), and it occurs before the October low of 147.27 (October 3). The next level of support appears to be the weekly low of 145.89 (September 11), followed by the September low of 144.43 (September 1). Down from here, there are no significant support levels until the August low of 141.50 (August 7), which is above the 200-day SMA of 140.26 and the July low of 137.23 (July 14). The daily RSI dropped to the proximity of 56.
Resistance levels: 151.72 151.94 152.00 (4H chart)
Support levels: 149.84 148.80 148.16 (4H chart)
GBPUSD
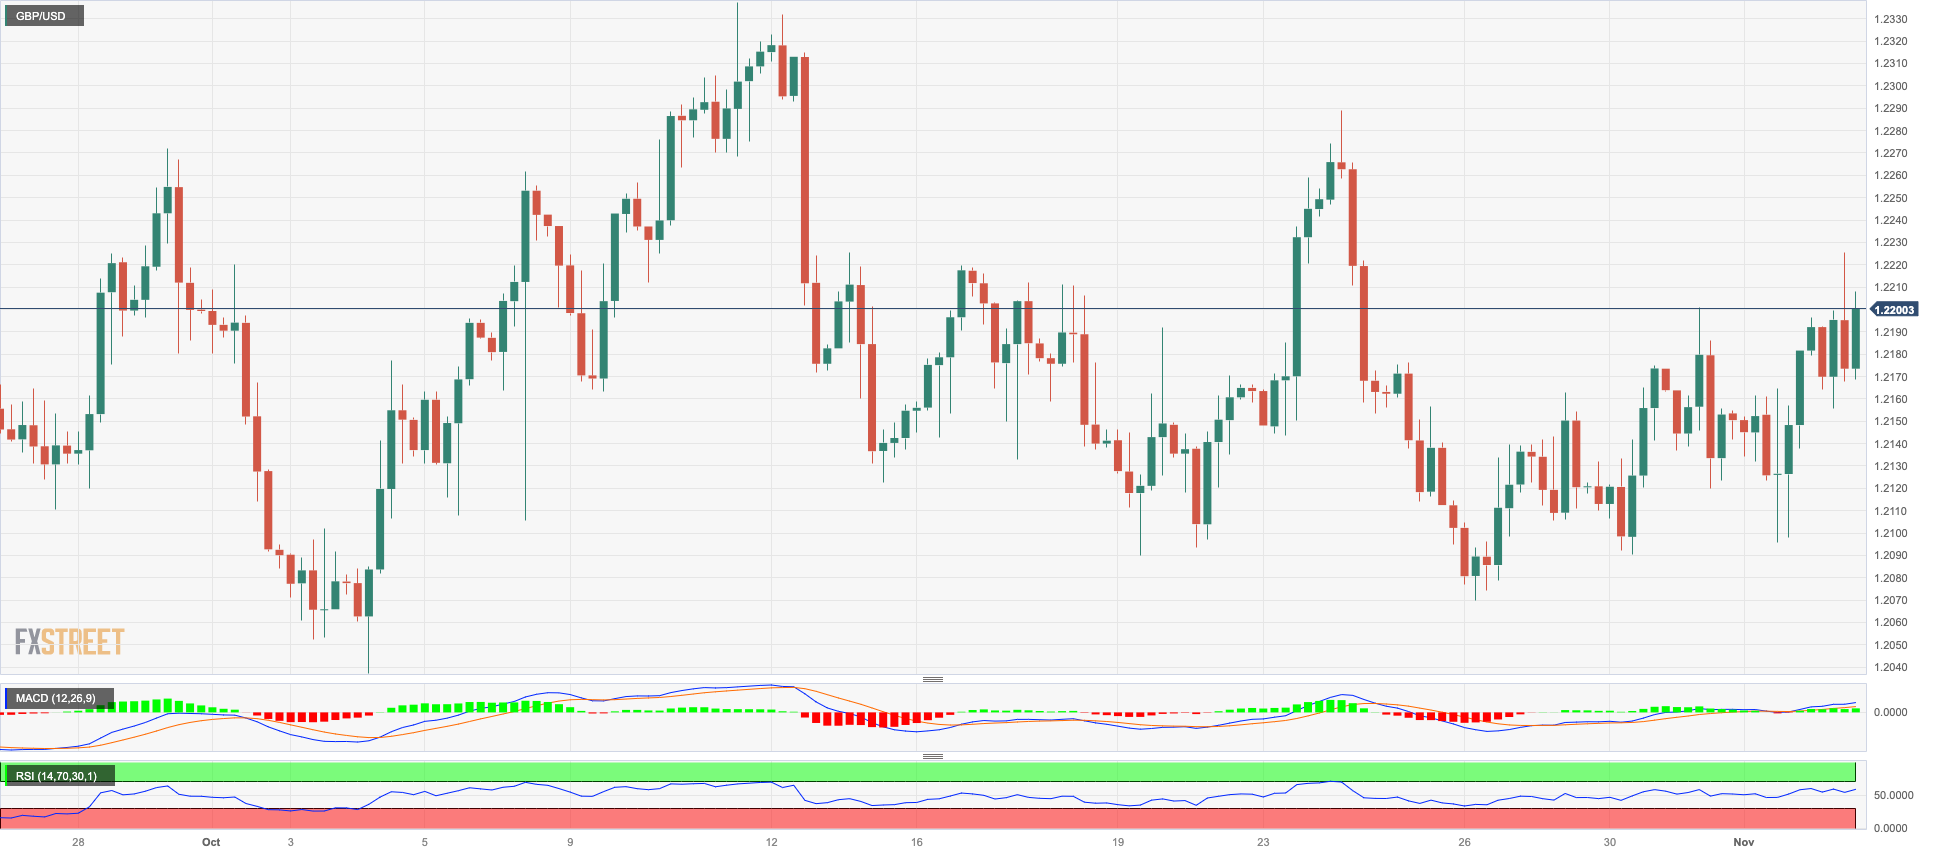
GBP/USD reversed two daily pullbacks in a row and advanced north of 1.2200 the figure on Thursday.
The daily improvement in the British pound came in response to a convincing decline in the greenback and the somewhat hawkish tilt at the BoE meeting.
On the latter, as widely anticipated, the BoE has decided to maintain its policy rate at 5.25% today, marking the second consecutive decision to keep it unchanged. The decision was supported by six members, while three members (Mann, Haskel, and Greene) expressed hawkish dissent.
The central bank revised its inflation projections and now sees the headline rate at 3.1% YoY in the fourth quarter of 2024, up from the previous rate of 2.5%, and at 1.9% YoY in the fourth quarter of 2025, compared to the previous rate of 1.6%. Some of this upward revision can be attributed to an elevated trajectory in oil and gas futures prices and their subsequent impacts on service inflation.
In addition, Governor Bailey stated that they will maintain interest rates at a sufficiently high level for a significant period of time in order to bring inflation back to the target. He mentioned that it is too early to contemplate rate cuts, but they are monitoring the situation closely to determine if rate hikes may be necessary. Bailey expressed the view that monetary policy should not be kept restrictive for an excessively long time, while acknowledging that there is still a considerable distance to go in order to suppress inflation.
If the selling trend resumes, GBP/USD may retest the October low of 1.2037 (October 3), just above the crucial 1.2000 level and before the 2023 low of 1.1802 (March 8). Just the opposite, the weekly high of 1.2288 (October 24) is the first level of resistance, followed by the October top of 1.2337 (October 11) and the 200-day SMA at 1.2433. Above this region, the weekly peak of 1.2548 (September 11) beckons, ahead of the transitory 100-day SMA at 1.2549. Following its removal, the weekly high of 1.2746 (August 30) appears, prior to the weekly highs of 1.2818 (August 10) and 1.2995 (July 27), all of which occur before to the psychological 1.3000 mark. The daily RSI advanced to the boundaries of 48
Resistance levels: 1.2225 1.2288 1.2337 (4H chart)
Support levels: 1.2095 1.2069 1.2037 (4H chart)
AUDUSD
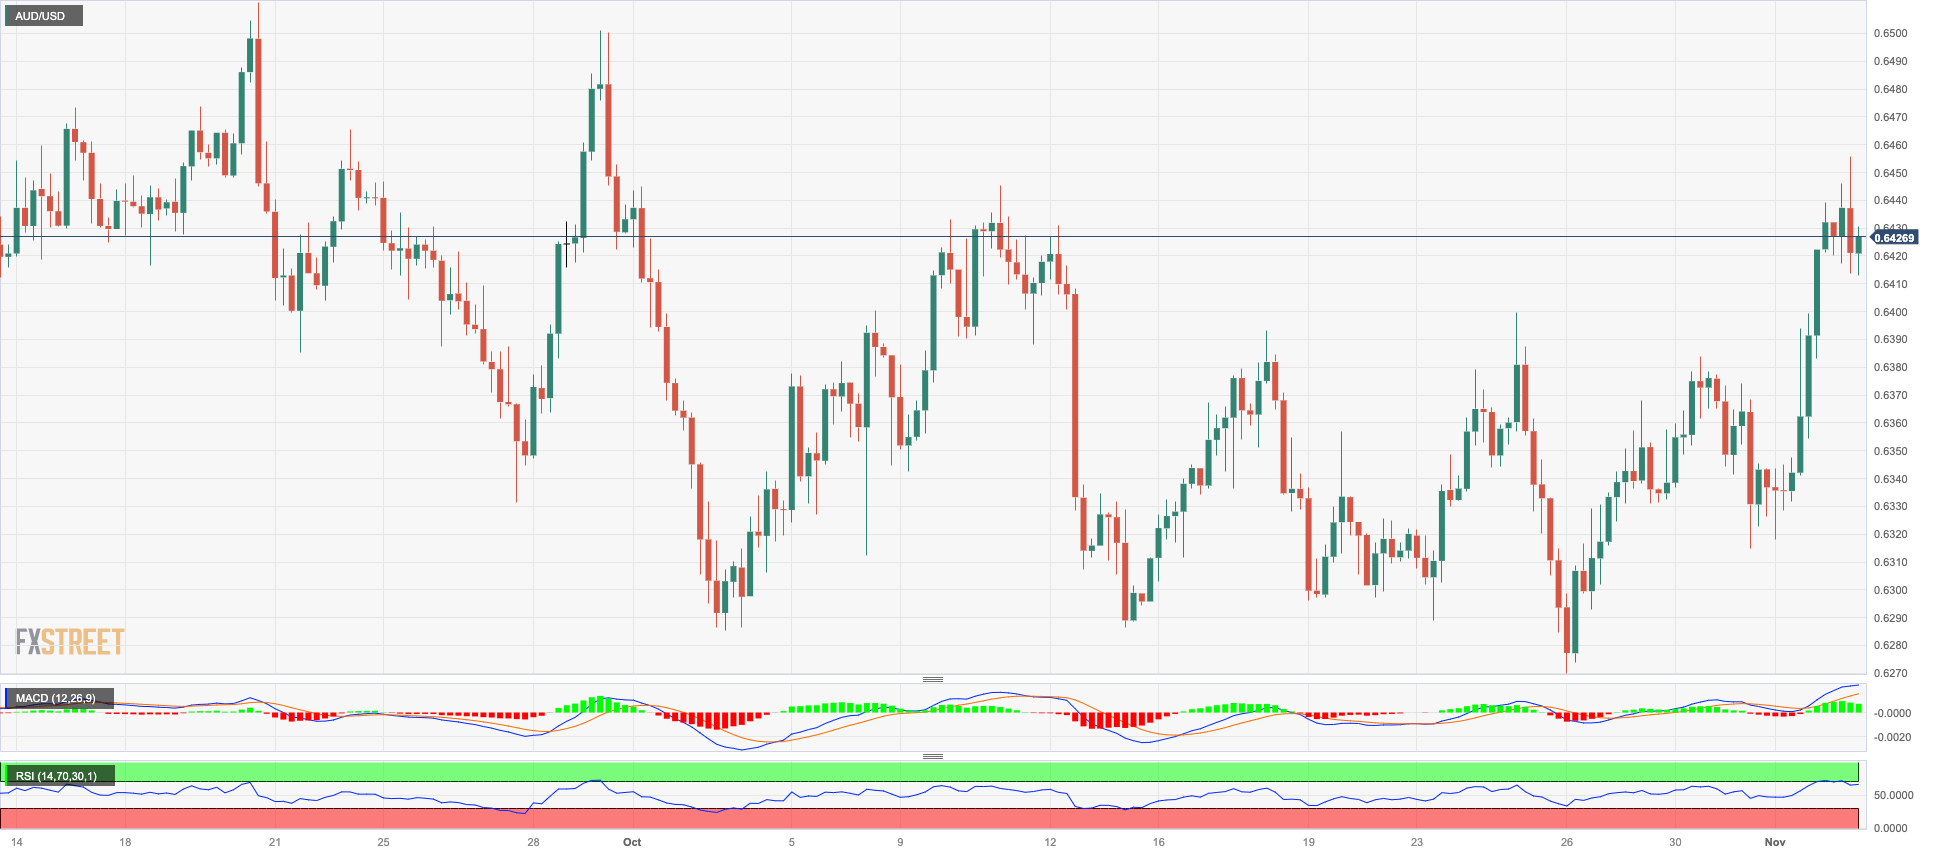
The intense decline in the greenback sponsored the second consecutive daily advance in AUD/USD, this time propelling it to new five-week tops in the mid-0.6400s on Thursday.
In addition to the dollar selling bias, the recovery in copper prices and iron ore also lent extra wings to the Aussie dollar and bolstered the daily performance.
Data-wise Down Under for the month of September, the trade surplus narrowed to A$6.786B, Home Loans contracted at a monthly 0.1%, and Investment Lending for Homes rose by 2%.
The surpass of the weekly high of 0.6455 (November 2) could prompt AUD/USD to challenge the weekly top of 0.6501 (September 29) ahead of the September peak of 0.6521 (September 1), which looks to be supported by the temporary 100-day SMA (0.6517). The weekly high of 0.6616 (August 10) and the 200-day SMA of 0.6623 are visible to the north. Further advances may push the pair to its July top of 0.6894 (July 14), then to its June peak of 0.6899 (June 16), and finally to the key 0.7000 level. If the bears retake control, the pair may reach the 2023 bottom of 0.6270 (October 26) before crashing through the round level of 0.6200 and the 2022 low of 0.6179 (October 13). The RSI on the daily chart climbed to the 56 area.
Resistance levels: 0.6455 0.6501 0.6522 (4H chart)
Support levels: 0.6314 0.6270 0.6210 (4H chart)
GOLD
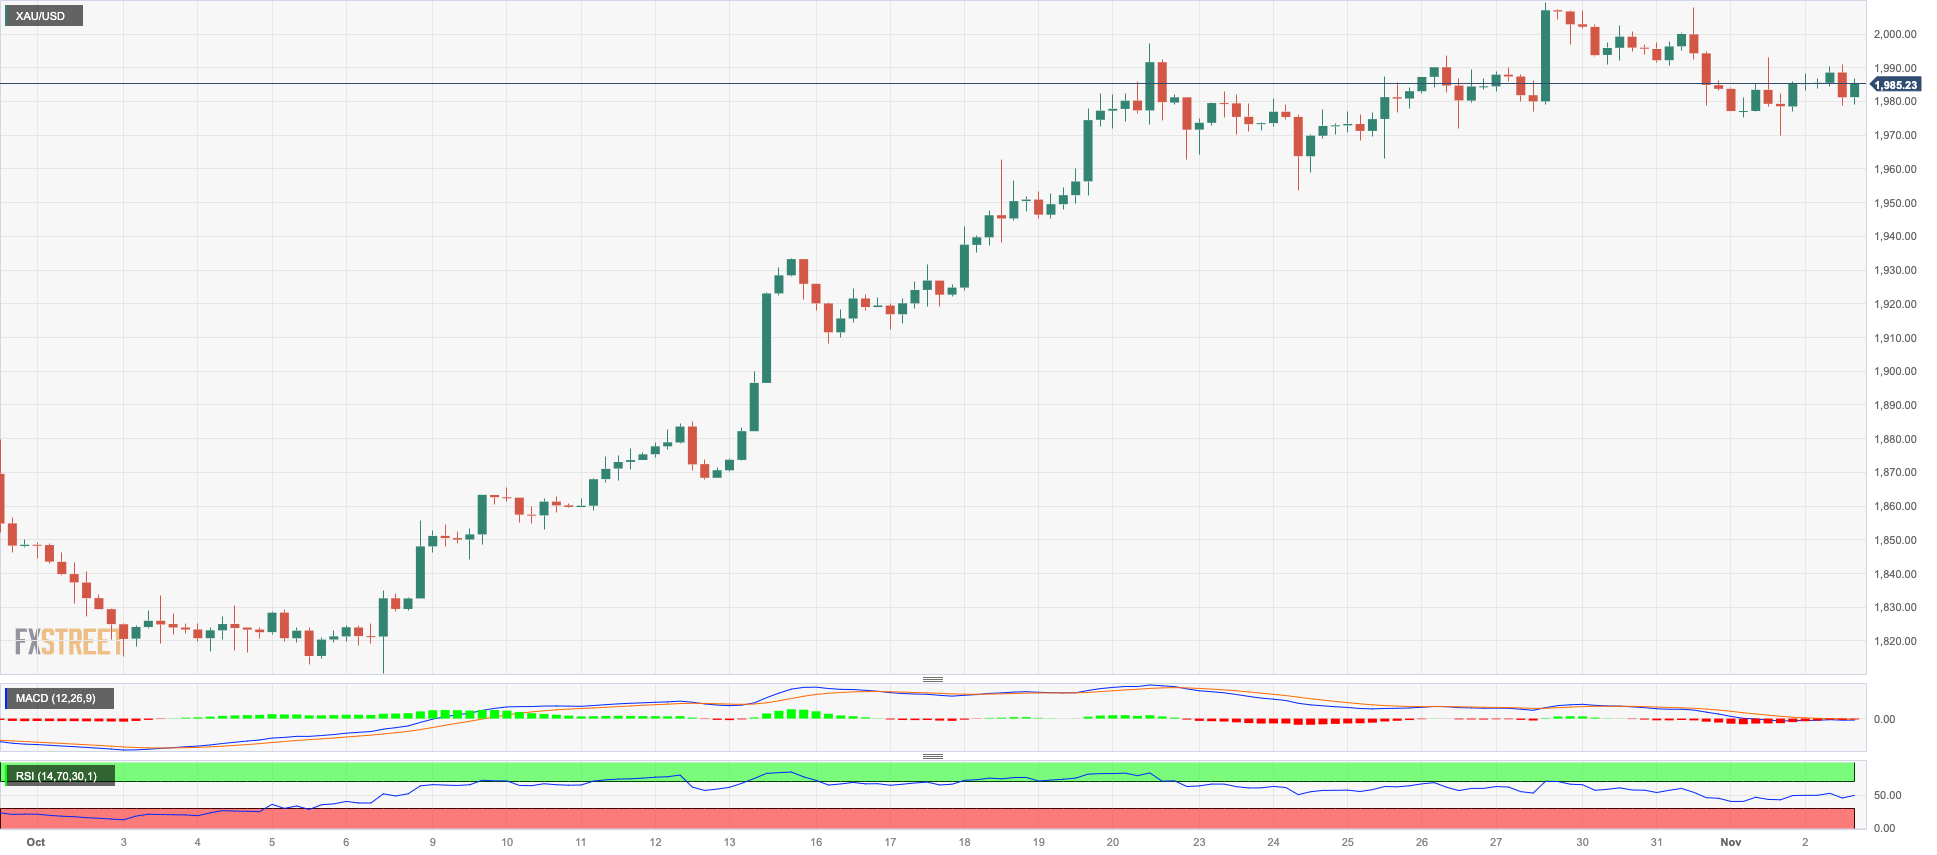
After three consecutive daily pullbacks, the yellow metal finally managed to regain its smile and advance decently on Thursday.
Indeed, the sharp retracement in the greenback in combination with further weakness in the belly and the long end of the US yield curve lent some legs to the precious metal on Thursday, as investors continued to digest Powell’s neutral message at the FOMC event on Wednesday.
On the plus side for the yellow metal, continued geopolitical concerns coming from the Middle East situation could keep it moderately supported for the time being.
Once gold has left behind the $2009 high (October 27), it might go for the 2023 top of $2067 (May 4), the 2022 peak of $2070 (March 8), and the all-time high of $2075. (August 7, 2020). On the contrary, a modest support exists around the weekly low of $1953 (October 24), ahead of the critical 200-day SMA at $1933. If the market continues to fall, the provisional 55-day SMA at $1917 may resurface on the horizon, ahead of the October low of $1810 (October 6). This level's breakdown reveals the 2023 low of $1804 (February 28) closely followed by the critical support zone of $1800.
Resistance levels: $2009 $2022 $2048 (4H chart)
Support levels: $1969 $1953 $1914 (4H chart)
CRUDE WTI
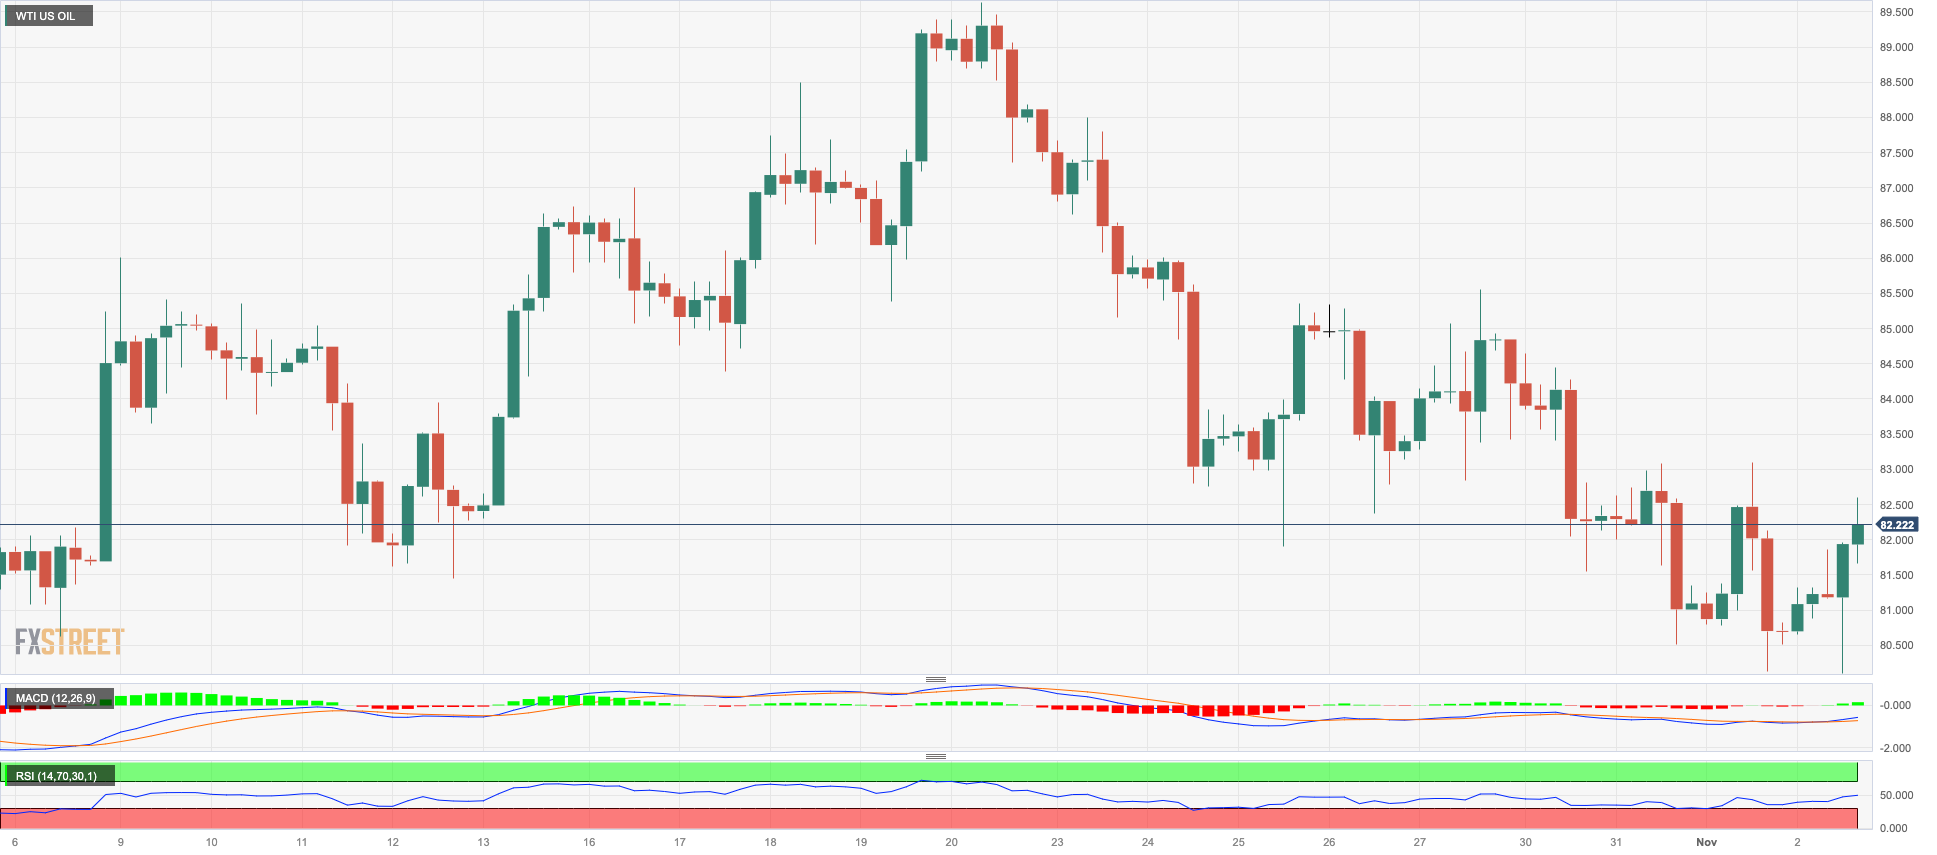
WTI prices gathered fresh steam and bounced off the proximity of the key $80.00 mark per barrel on Thursday, advancing to the vicinity of the $83.00 mark.
The steep decline in the greenback, along with traders’ perception that the Federal Reserve might refrain from raising rates, bolstered the broad-based resumption of the risk appetite and helped the commodity regain further ground.
In addition, the escalating crisis in the Middle East is expected to keep crude oil prices underpinned, as the potential spread to neighbouring regions could reignite supply disruption concerns.
Further losses might send WTI below the critical $80.00 mark, ahead of the key 200-day SMA at $78.15. If bears break through this barrier, a retest of the August low of $77.64 (August 24) could re-emerge on the horizon before a move to the weekly low of $73.89 (July 17) and the key $70.00 mark per barrel. South of here is the June low of $66.85 (June 12), ahead of the 2023 low of $63.61 (May 4) and the key $60.00 threshold. On the flip side, the weekly high of $89.83 (October 18) stands in the way of bulls' hopes to reach the 2023 peak of $94.99 (September 28). Further north, the weekly top of $97.65 (August 30, 2022) comes before the psychological $100.00 barrier per barrel.
Resistance levels: $83.38 $85.85 $87.00 (4H chart)
Support levels: $80.19 $77.56 $73.81 (4H chart)
GER40
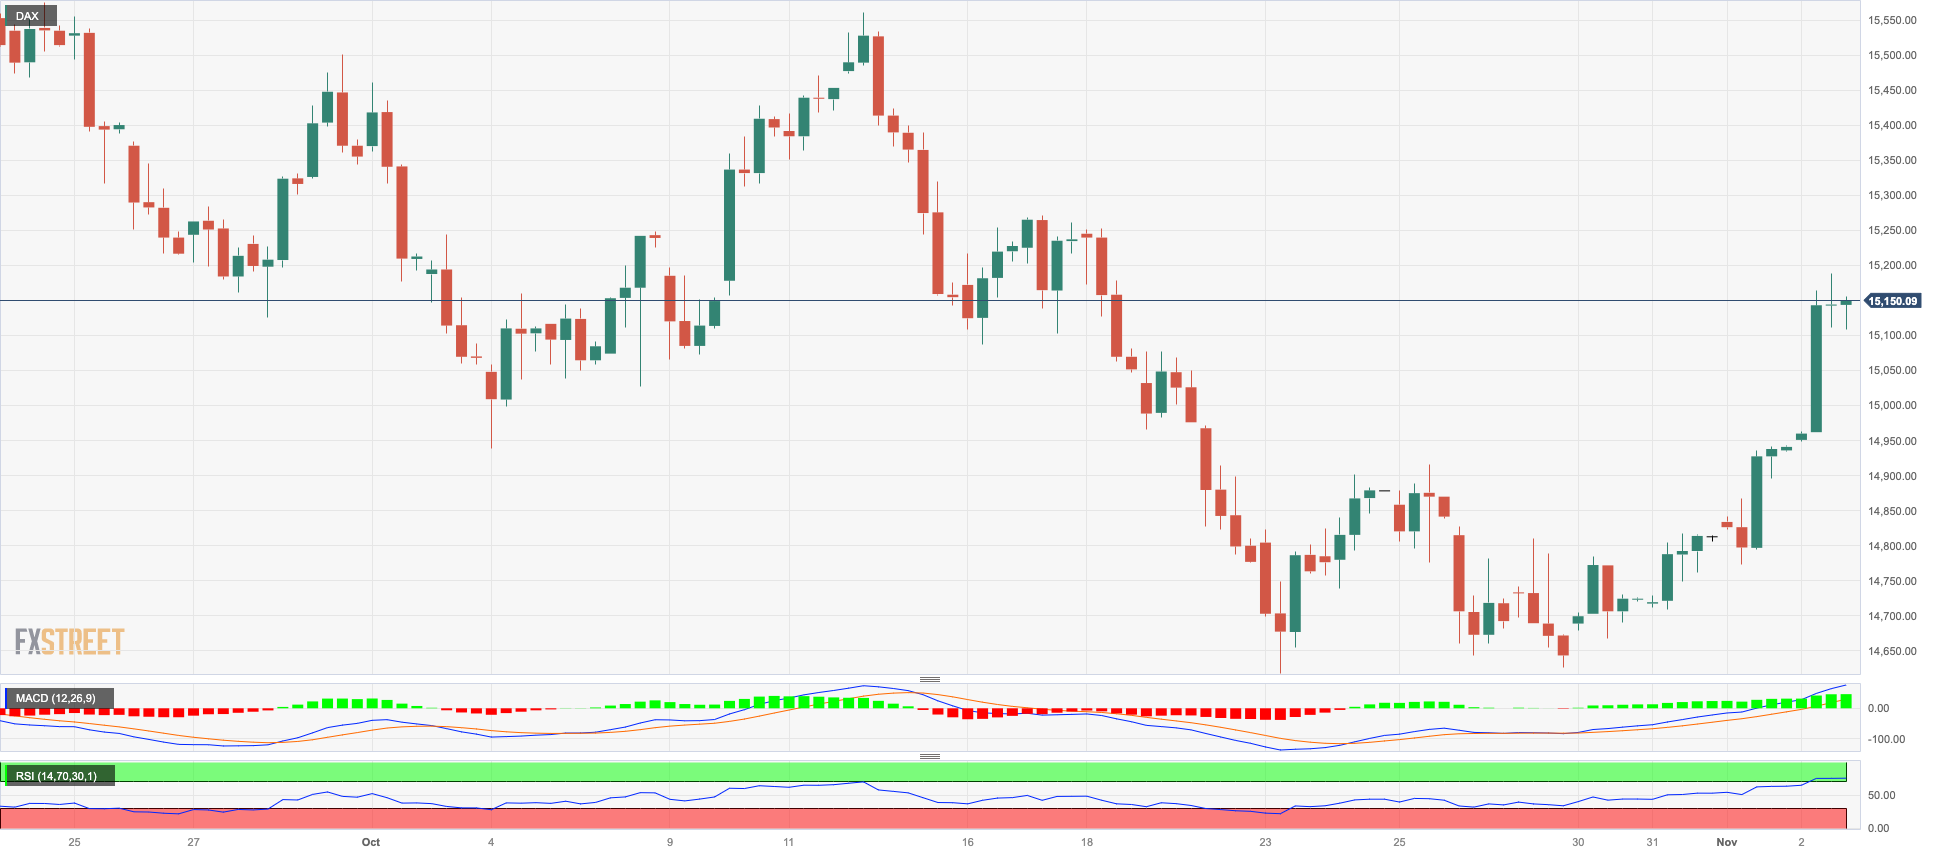
Germany’s reference DAX40 extended the march north for the fourth session in a row on Thursday, revisiting levels traded a couple of weeks above around the 15200 zone.
The extra advance in German stocks came pari passu with investors’ adjustment of the Fed’s decision to keep rates unchanged as well as firm speculation that the Fed might be done with hiking rates, all against the backdrop of an increasing appetite for riskier assets.
In addition, the BoE’s decision to leave its policy rate unchanged also collaborated with the constructive sentiment.
The move higher in stocks came in tandem with a further decline in the 10-year bund yields, this time reaching monthly lows near 2.65%.
The first upward obstacle is the October high of 15575 (October 12), followed by the crucial 200-day SMA of 15641. Further north, the DAX40 may hit the September top of 15989 (September 15), ahead of the weekly peaks of 16042 (August 31) and 16060 (August 10). If this zone is cleared, the index may try to break through to its all-time high of 16528. (July 31). Instead, if the selling trend returns, the index may fall to its October low of 14630 (October 23), before the March low of 14458 (March 20) and the December 2022 bottom of 13791 (December 20). The loss of the latter allows for a possible drop to the 2022 low of 11862 (September 28). The everyday RSI climbed to the boundaries of 52.
Best Performers: Siemens Energy AG, Fresenius SE, Dr Ing hc F Porsche Prf
Worst Performers: Zalando SE, Heidelbergcement, Rheinmetall AG
Resistance levels: 15202 15288 15575 (4H chart)
Support levels: 14630 14458 13791 (4H chart)
NASDAQ
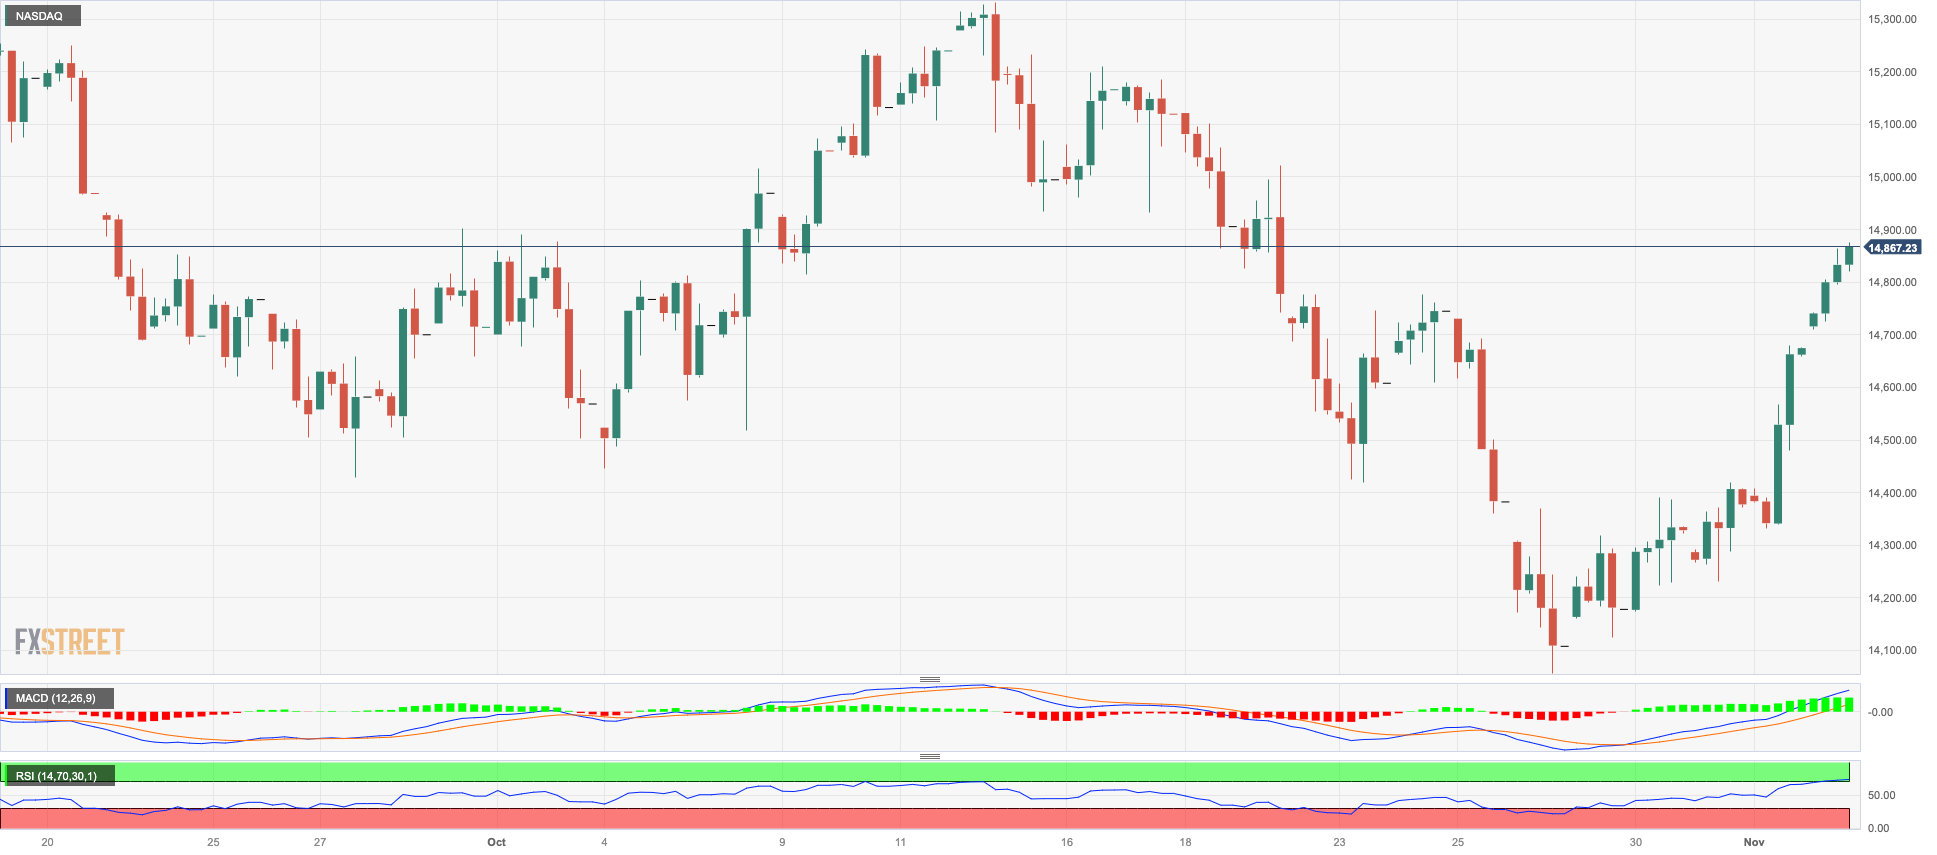
The optimism in the US tech sector remained well and sound for yet another session on Thursday.
In fact, the benchmark index Nasdaq 100 rose to two-week highs on the back of the generalized improvement in the appetite for risk-linked assets, while the weaker dollar and diminishing US yields also contributed to the fifth consecutive daily gain on Thursday.
The upbeat sentiment among market participants was also propped up by hopes of a positive earnings report from megacap Apple following the closing bell on Wall Street.
The Nasdaq 100 is expected to meet a temporary up-barrier at the 100-day SMA at 15081, ahead of the October high of 15333 (October 12). The latter's breakout might open the door to a rise to the September top of 15618 (September 1) and the weekly peak of 15803 (July 31). If the index rises over this level, it might dispute the 2023 high of 15932 (July 19). If sellers regain control, the index should find immediate support at the October low of 14058 (October 26), which is just ahead of the important 200-day SMA of 13988. The April low of 12724 (April 25) is south of here, seconded by the March low of 11695 (March 13), and finally the 2023 low of 10696 (January 6). The RSI for the day advanced to the boundaries of 55.
Top Gainers: Lucid Group, Starbucks, Warner Bros Discovery
Top Losers: Moderna, Cognizant A, ANSYS
Resistance levels: 14909 15078 15333 (4H chart)
Support levels: 14058 13520 12724 (4H chart)
DOW JONES
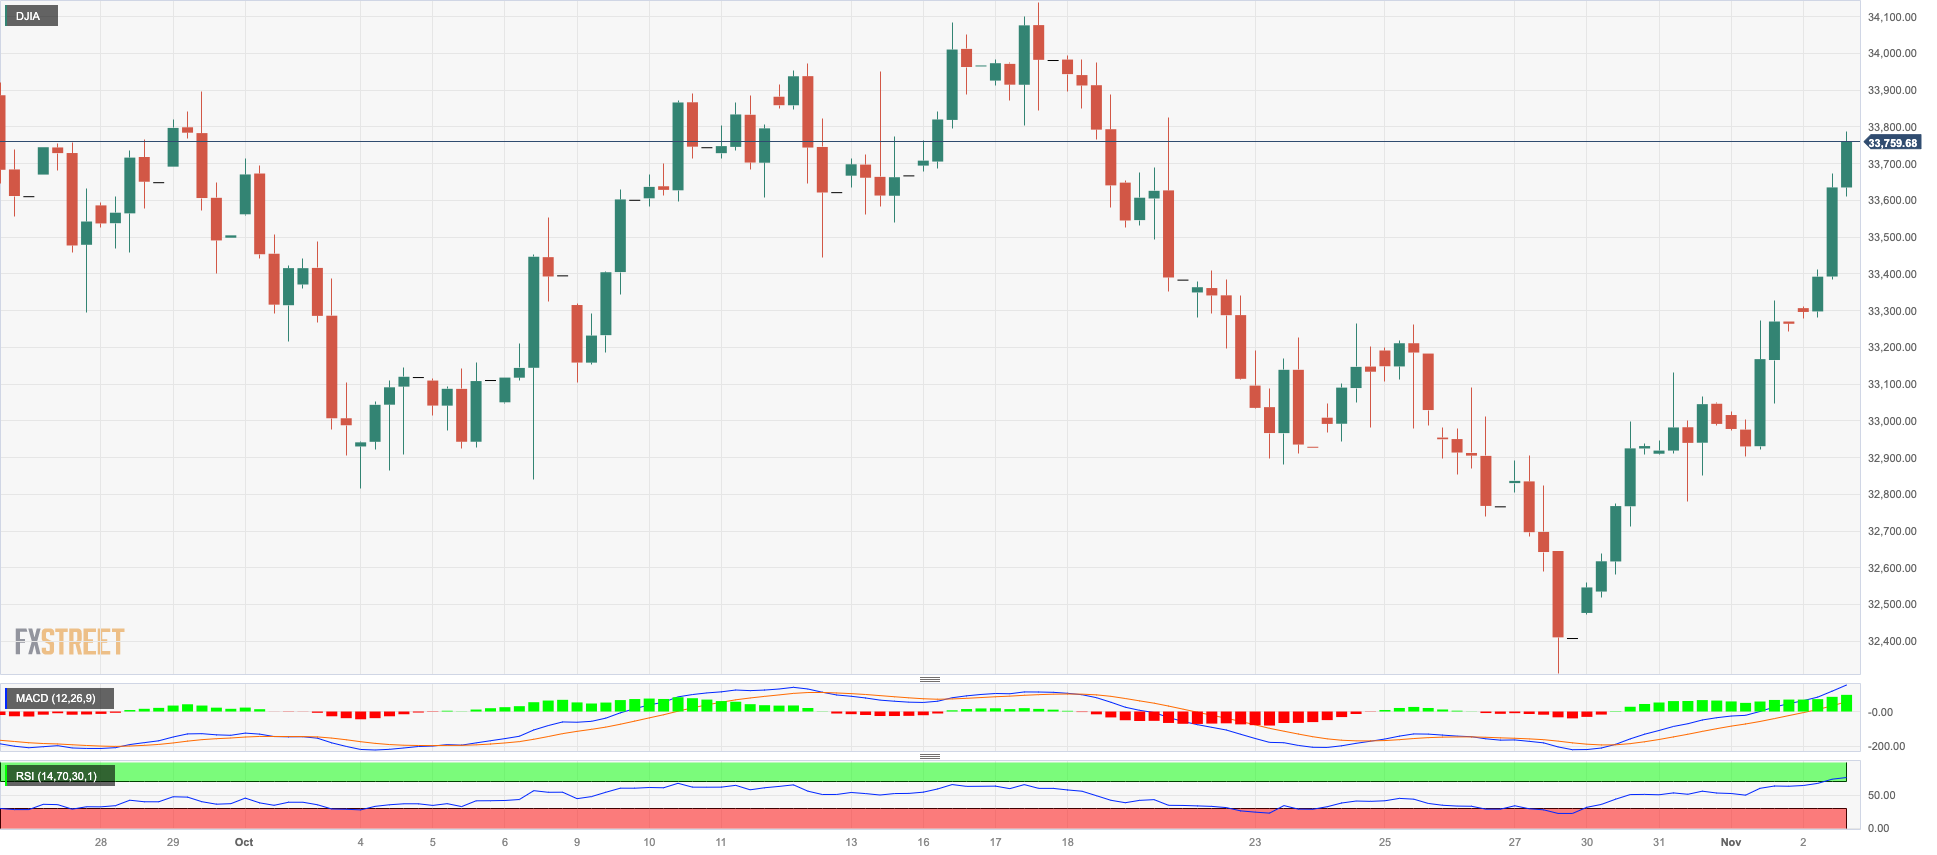
US markets navigated a “sea of green” on Thursday as investors assessed the latest FOMC event and Chair Powell’s message.
Indeed, US stocks tracked by the Dow Jones advanced for the fourth session in a row and reached new two-week highs around the 33800 region, an area also coincident with the critical 200-day SMA.
The growing feeling that the Federal Reserve will keep its rates unchanged in the next few months fed into the appetite for the risk complex and lifted the index further, while the sell-off in the greenback and shrinking US yields also added to the upbeat mood.
All in all, the Dow Jones gained 1.51% to 33776, the S&P500 advanced 1.76% to 4312, and the tech-focused Nasdaq Composite rose 1.65% to 13276.
Next up for the Dow Jones emerges the October high of 34147 (October 17) just ahead of the intermediate 100-day SMA at 34268 and the September top of 34977 (September 14). North from here comes the weekly peak of 35070 (August 31), prior to the 2023 high of 35679 (August 1). On the downside, the October low of 32327 (October 27) provides immediate support ahead of the 2023 bottom of 31429 (March 15) and the 2022 low of 28660 (October 13). The daily RSI advanced beyond 55.
Top Performers: Nike, Walgreen Boots, Chevron
Worst Performers: Travelers, Merck&Co, UnitedHealth
Resistance levels: 33775 34147 34278 (4H chart)
Support levels: 32327 31429 30206 (4H chart)
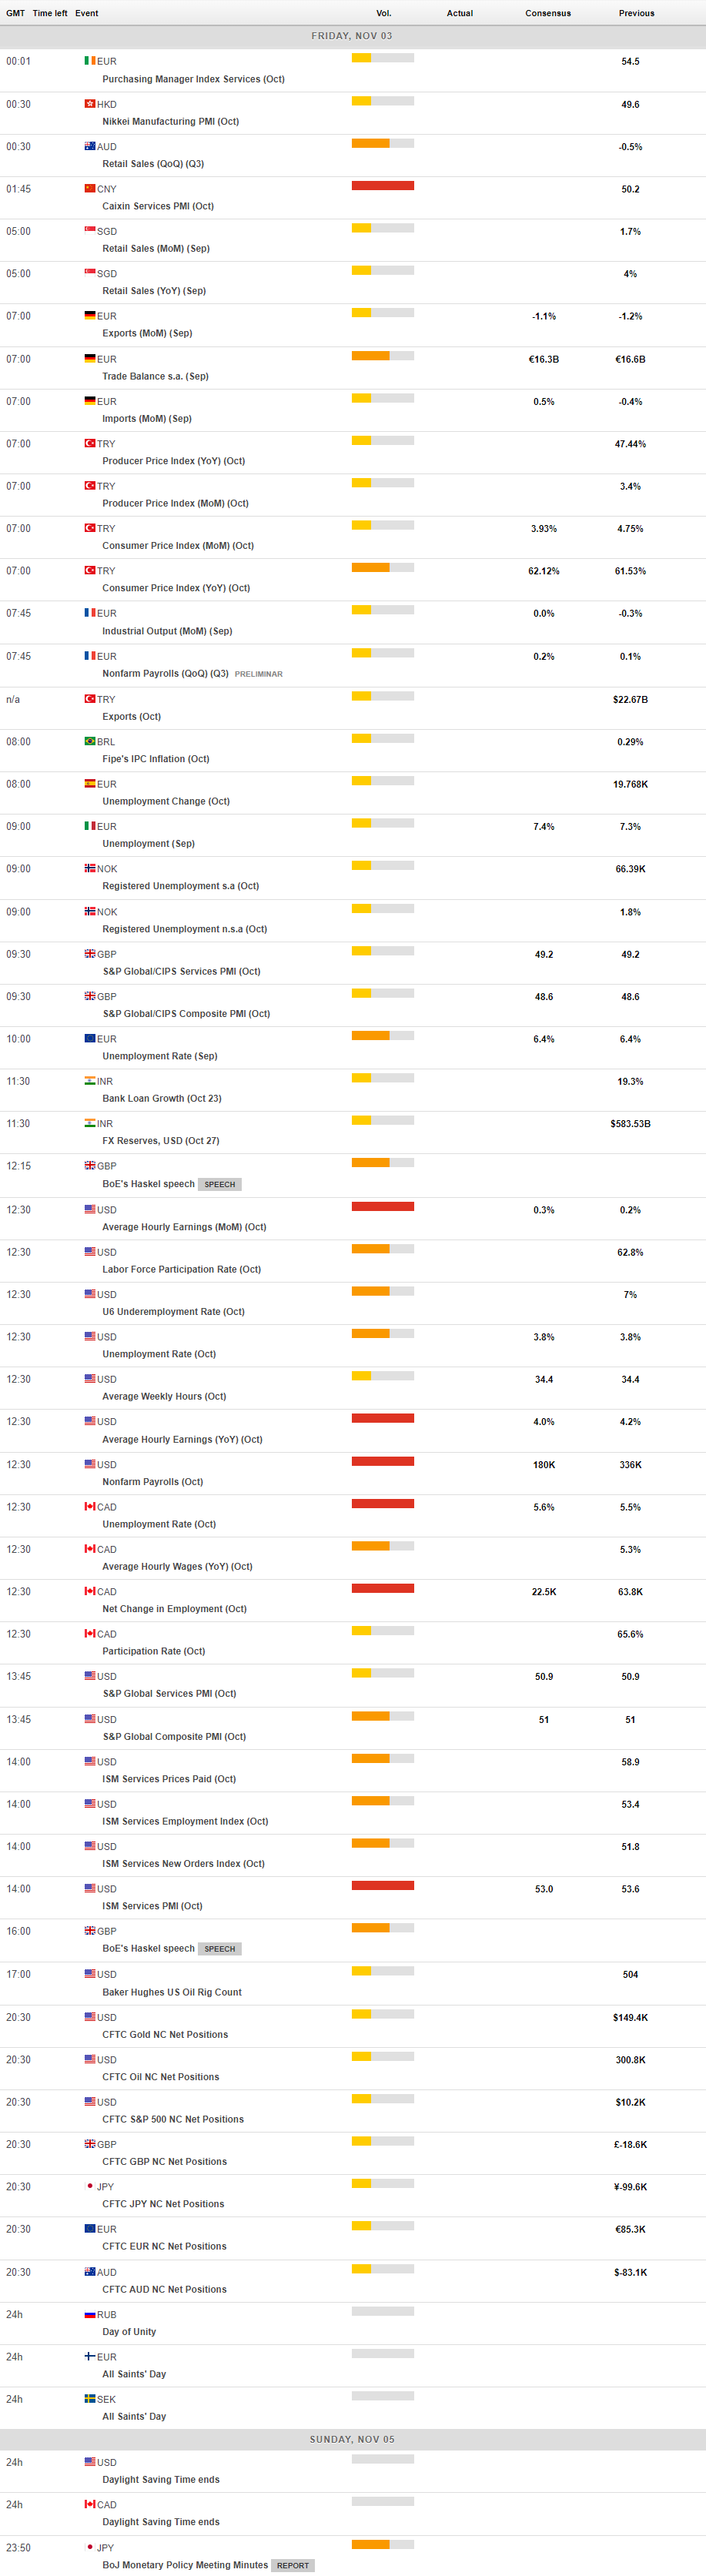
MACROECONOMIC EVENTS
All Information & Updates provided by:

All information relating to the financial markets available on this page has been prepared and issued by FXStreet (Forexstreet SL, Spain, Reg: B62498233) on the basis of publicly available information and all information believed to be reliable and does not conflict with Kuwaiti local laws, and all necessary care has been taken to before the company to ensure that the facts mentioned are correct from the source.
NCM Investment nor any of its directors or employees shall in any way be held responsible for the contents of this news, and the information contained on this page is intended only to provide clients with publicly available information and should not be construed as investment advice, report or analysis and/or constitute an offer or invitation to buy or sell financial instruments of any kind.
RISK WARNING: Forex and CFDs are highly risky leveraged products, as losses can exceed deposits. Please ensure you understand all the risks and take independent advice if necessary. NCM will segregate the clients based on the criteria of the regulator and its bylaws. NCM does not provide any advisory service; the material published does not constitute advice or a recommendation for a transaction in any financial instrument. NCM accepts no responsibility for any use of the content presented and any consequences of that use. Anyone acting on the information provided does so at their own risk.