
- Contact Us:
-

-

-

-


Daily Market Updates
06 Nov 2023
USDJPY
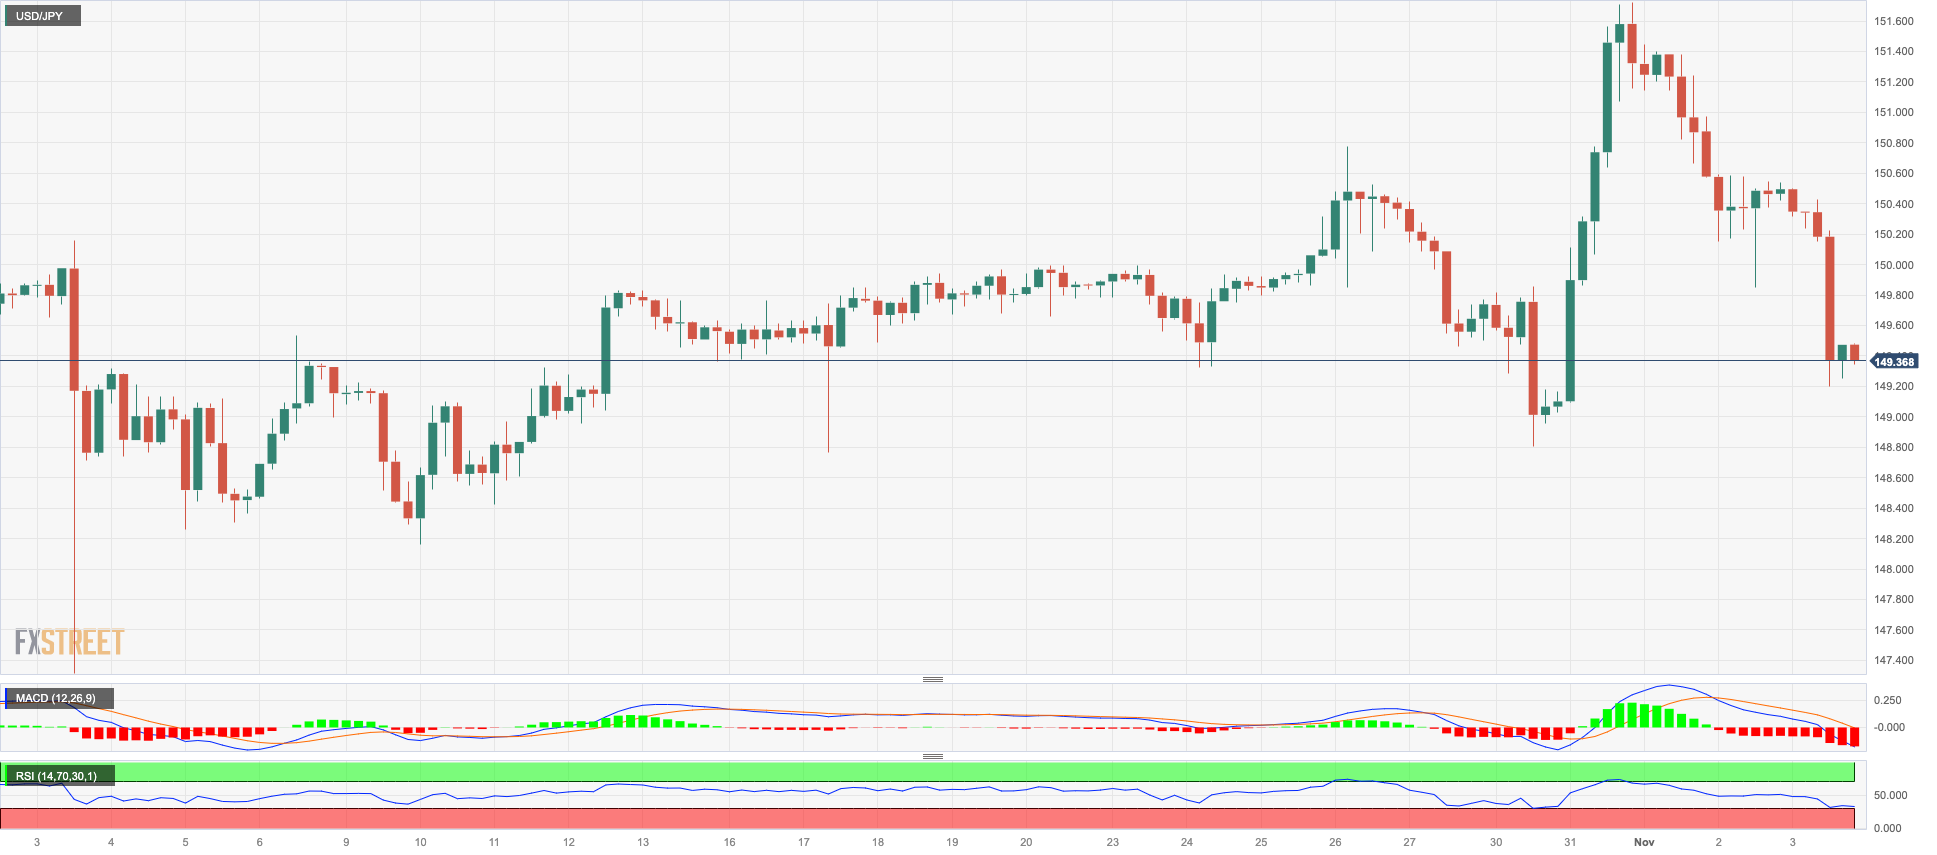
USD/JPY clinched its third consecutive daily decline on Friday, almost fully fading Tuesday’s sharp uptick and revisiting at the same time the 149.30 region.
The pair’s downside pressure gathered extra pace on the back of the NFP-driven collapse of the greenback as well as the pronounced retracement in US yields across the curve.
In the Japanese bond market, the JGB 10-year yields remained apathetic around the 0.92% level.
There were no data releases in the Japanese docket on Friday.
A breakout of the 2023 high of 151.72 (October 31) might bring USD/JPY back to the 2022 top of 151.94 (October 21), which would be quickly followed by the round level of 152.00. Just the opposite, the 55-day SMA at 148.36 emerges as transitory contention ahead of the weekly low of 148.16 (October 10), which comes before the October low of 147.27 (October 3). The weekly low of 145.89 (September 11) seems to be the next level of support, followed by the September low of 144.43 (September 1). There are no substantial support levels below this region until the August low of 141.50 (August 7), prior to the 200-day SMA of 140.36 and the July low of 137.23 (July 14). The daily RSI broke below the 50 threshold.
Resistance levels: 151.72 151.94 152.00 (4H chart)
Support levels: 149.18 148.80 148.16 (4H chart)
GBPUSD
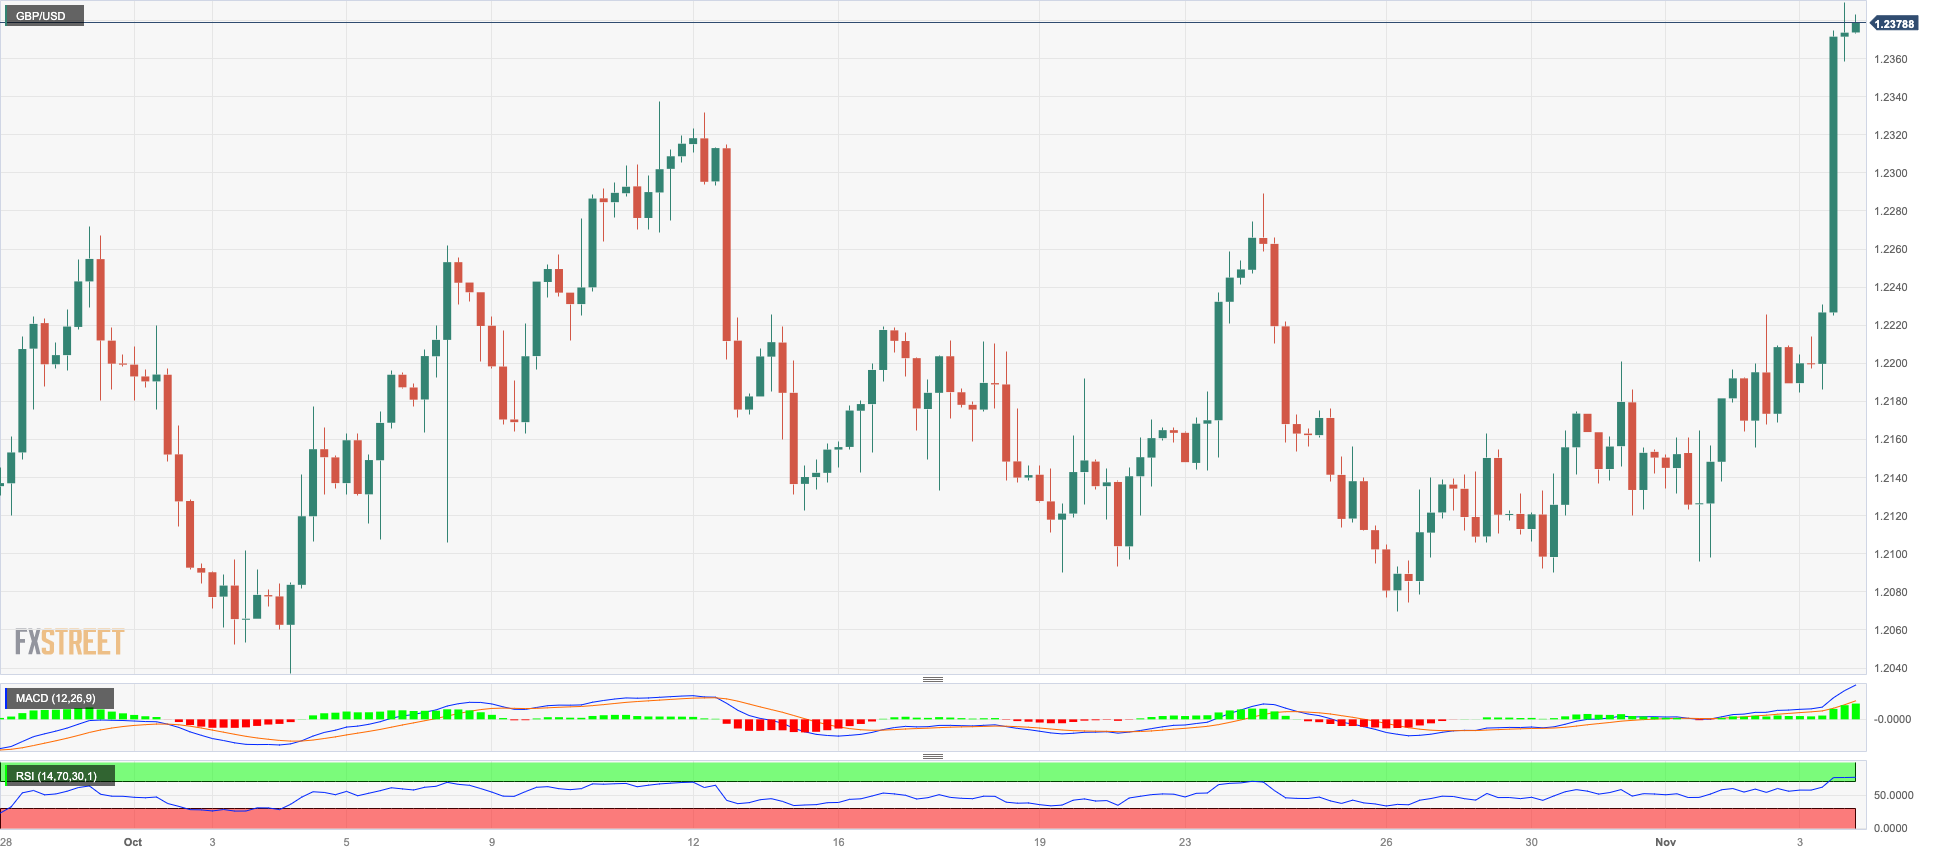
GBP/USD added to Thursday’s uptick and advanced markedly to multi-week tops near the 1.2400 barrier on Friday.
The intense advance in Cable came exclusively in response to the equally strong pullback in the greenback, which was particularly magnified after weaker-than-expected US Nonfarm Payrolls for the month of October.
In the UK, the most-watched Services PMI improved a tad to 49.5 during last month, according to final prints.
Extra gains could see GBP/USD revisit the significant 200-day SMA at 1.2433 prior to the weekly high of 1.2548 (September 11) and the temporary 100-day SMA at 1.2545. Following its removal, another weekly tops emerge at 1.2746 (August 30), 1.2818 (August 10) and 1.2995 (July 27), all of which occur before the psychological 1.3000 threshold. On the contrary, bears face initial support at the October low of 1.2037 (October 3), which is just above the critical 1.2000 barrier and before the 2023 bottom of 1.1802 (March 8). The daily RSI leapt past the 62 level.
Resistance levels: 1.2389 1.2548 1.2746 (4H chart)
Support levels: 1.2191 1.2095 1.2069 (4H chart)
AUDUSD
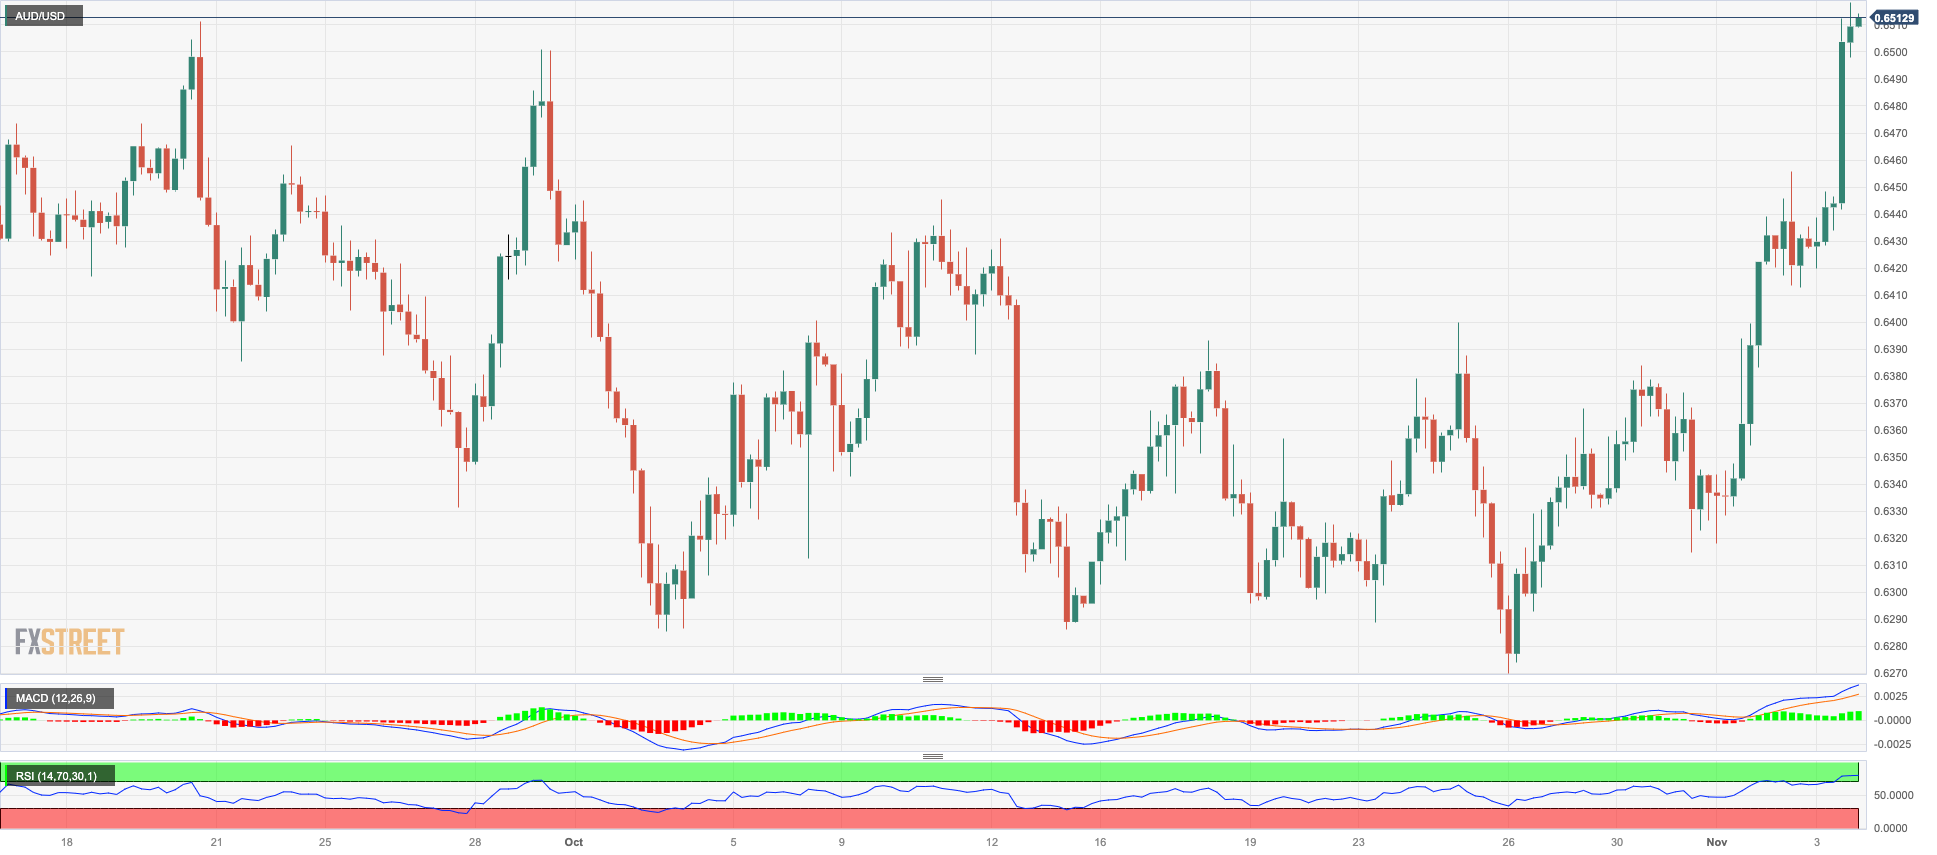
AUD/USD added to the strong weekly recovery and rose beyond the 0.6500 barrier to print new nine-week highs in the 0.6515/20 band on Friday.
The noticeable advance in the Aussie dollar came as the greenback sank to multi-week lows in response to investors’ repricing of potential interest rate cuts earlier than anticipated, all following disappointing prints from the US labour market report for the month of October.
Also contributing to the upside in the pair was the firm performance of copper prices and iron ore, all amidst a generalized constructive tone in the commodity complex.
The Australian docket was empty at the end of the week.
AUD/USD now faces the immediate up-barrier at the November high of 0.6518 (November 3), which precedes the September top of 0.6521 (September 1). North from here, the weekly peak of 0.6616 (August 10) and the 200-day SMA of 0.6620 are visible ahead of the July high of 0.6894 (July 14), the June top of 0.6899 (June 16), and eventually the critical 0.7000 barrier. Having said that, if the bears reclaim control, spot may collapse to the 2023 bottom of 0.6270 (October 26) followed by the round level of 0.6200 and the 2022 low of 0.6169 (October 13). The everyday RSI advanced to the vicinity of 65.
Resistance levels: 0.6518 0.6616 0.6739 (4H chart)
Support levels: 0.6374 0.6314 0.6270 (4H chart)
GOLD
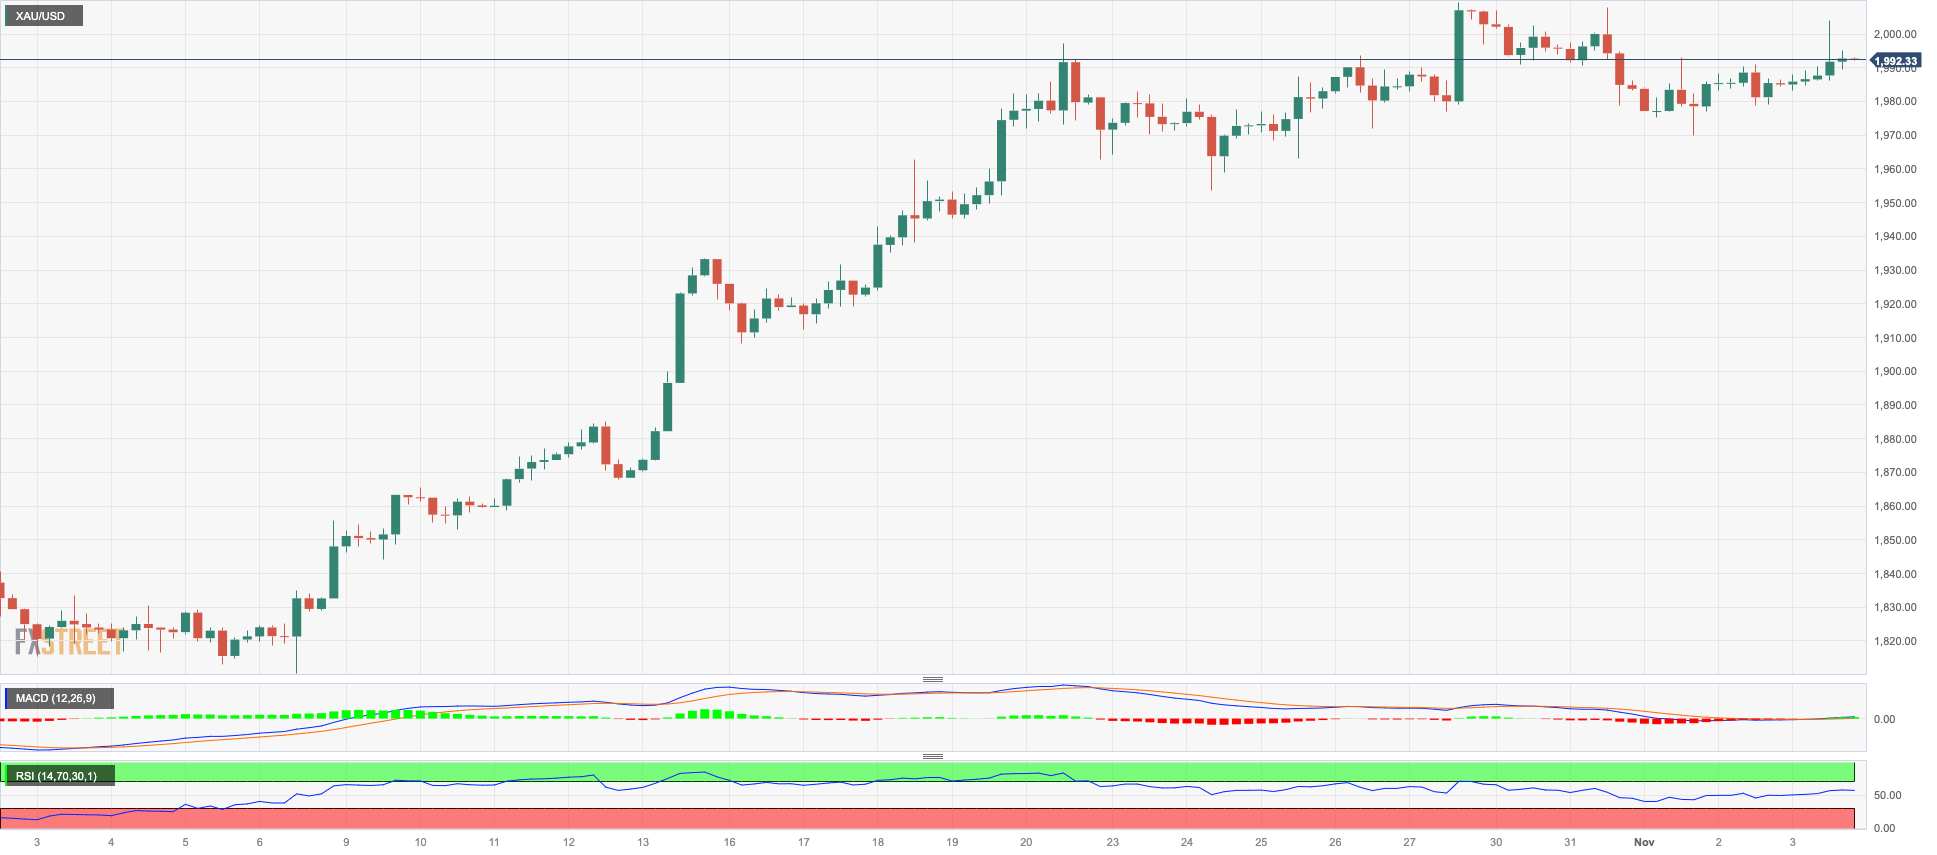
Gold prices rose for the second session in a row and managed to surpass the key $2000 barrier once again on Friday, although they closed just below that mark.
Increasing geopolitical concerns stemming from the Middle East, the sharp downside pressure in the dollar, and diminishing US yields across various timeframes all underpinned the positive sentiment around the precious metal at the end of the week.
Moving forward, rising speculation that the Fed might have ended its tightening campaign is seen as a positive driver for gold prices in the next few months.
Once gold has passed the $2009 high (October 27), it might target the 2023 top of $2067 (May 4), followed by the 2022 peak of $2070 (March 8), and the all-time high of $2075 (7 August 2020). On the contrary, there is some support at the weekly low of $1953 (October 24), just ahead of the crucial 200-day SMA at $1933. If the market falls further, the provisional 55-day SMA at $1919 may reappear on the horizon, ahead of the October low of $1810 (October 6). The breakdown of the latter exposes the 2023 low of $1804 (February 28), followed by the key support zone of $1800.
Resistance levels: $2009 $2022 $2048 (4H chart)
Support levels: $1969 $1953 $1917 (4H chart)
CRUDE WTI
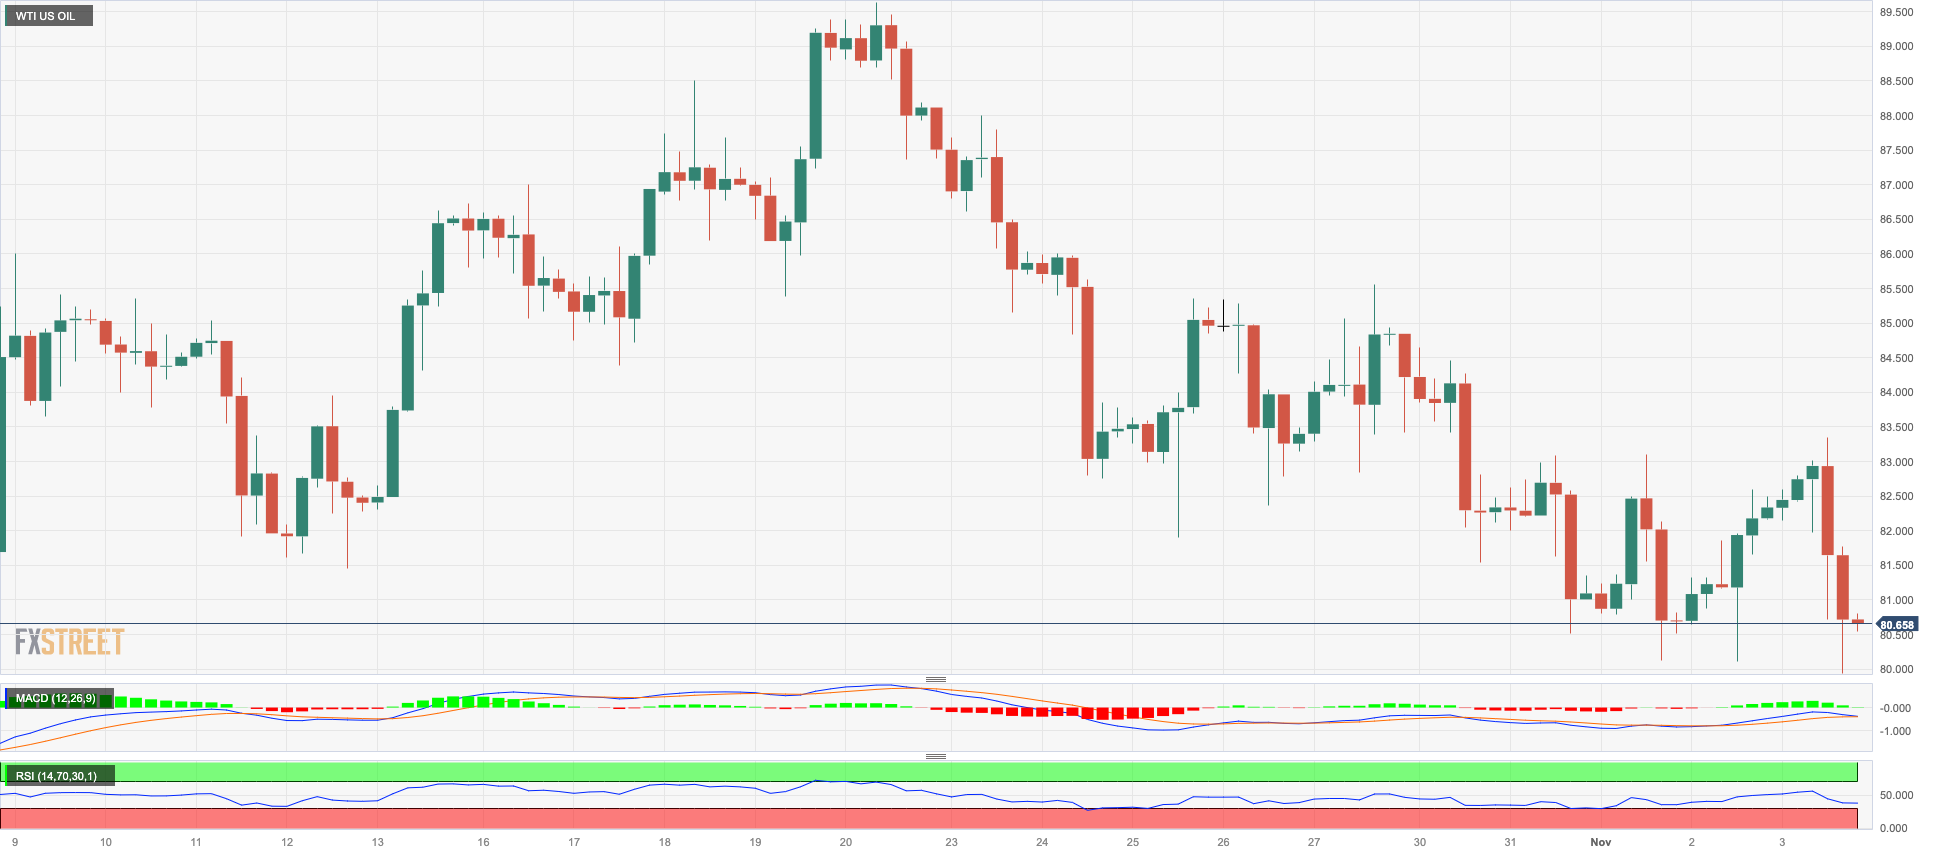
Prices of WTI resumed the downtrend and flirted once again with the key contention area of the $80.00 mark per barrel at the end of the week. Against that, WTI closed the second consecutive week of losses, revisiting levels last seen in late August.
In fact, diminishing concerns that the Middle East crisis could disrupt the supply of crude oil took centre stage and prevented crude oil from capitalizing on the strong downward bias of the greenback on Friday.
In the docket, driller Baker Hughes reported a drop of 8 oil rig counts in the week to November 3, taking the US total active oil rigs to 496.
Further losses might send WTI below the critical $80.00 barrier, just ahead of the 200-day SMA at $78.15. If bears breach this level, a retest of the August low of $77.64 (August 24) is possible, followed by a move to the weekly low of $73.89 (July 17) ahead of the key $70.00 mark per barrel. The June low of $66.85 (June 12) is south of here, ahead of the 2023 low of $63.61 (May 4) and the critical $60.00 threshold. The weekly high of $89.83 (October 18), on the flip side, is hampering bulls' hopes of reaching the 2023 top of $94.99 (September 28) for the time being. Further north, comes the weekly peak of $97.65 (August 30, 2022) before the psychological barrier of $100.00.
Resistance levels: $83.38 $85.85 $87.00 (4H chart)
Support levels: $80.15 $77.56 $73.81 (4H chart)
GER40
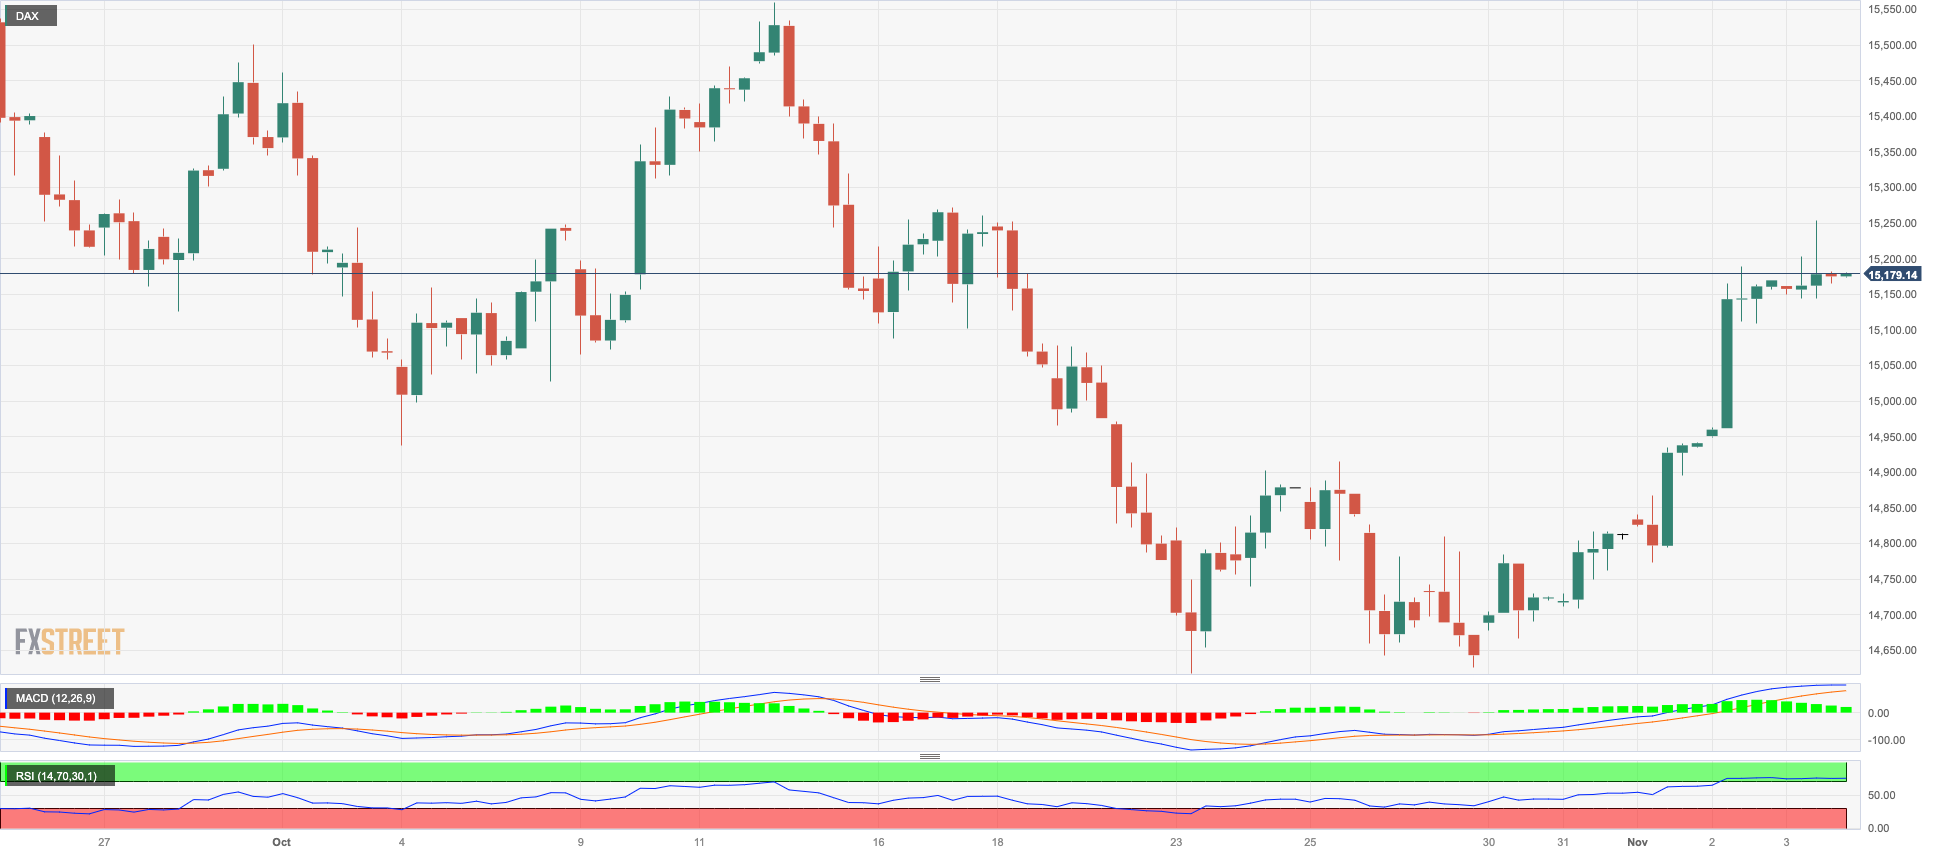
Another positive performance saw the German benchmark index DAX40 advance for the fifth session in a row on Friday, this time clinching two-week peaks near the 15300 region.
The broad-based risk-on sentiment among traders was propped up by the increasing perception that the Fed could now enter a protracted pause of its normalization programme that could eventually end in interest rate cuts at some point in H2 2024.
The above added to traders’ view that the ECB could also pause its hiking campaign until Q3 2024, while recent positive results from the German GDP seem to have also bolstered the upside momentum.
The initial upward barrier is the November high of 15269 (November 3) ahead of the October top of 15575 (October 12), and the critical 200-day SMA of 15641. Further north, the DAX40 might reach the September peak of 15989 (September 15), before the weekly highs of 16042 (August 31) and 16060 (August 10). If this zone is breached, the index may attempt to reach its all-time top of 16528 (July 31). Instead, if the selling trend resumes, the index may deflate to its October low of 14630 (October 23), before falling to the March low of 14458 (March 20) and the December 2022 low of 13791 (December 20). The loss of the latter allows for a probable retracement to the 2022 low of 11862 (September 28). The daily RSI increased past the 53 barrier.
Best Performers: Siemens Energy AG, Zalando SE, Vonovia
Worst Performers: Hannover Rueck SE, Munich Re Group, Fresenius SE
Resistance levels: 15269 15575 15989 (4H chart)
Support levels: 14630 14458 13791 (4H chart)
NASDAQ
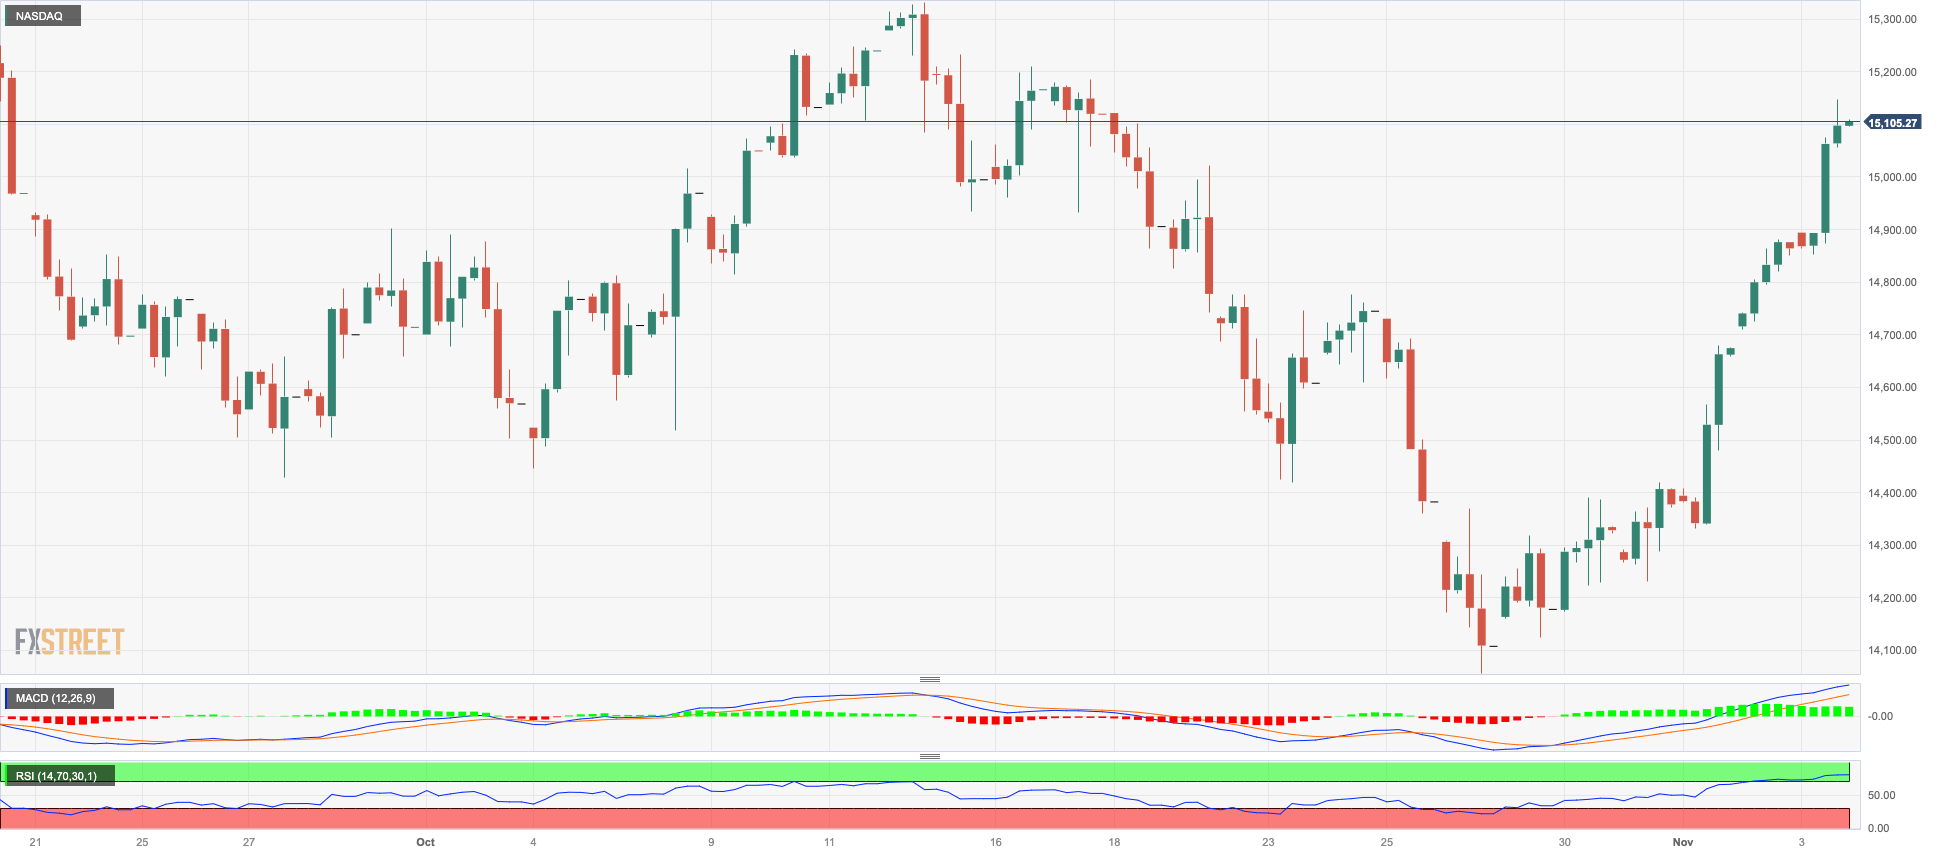
Further upside momentum lifted the tech reference Nasdaq 100 to two-week highs around 15100 on Friday.
The generalized risk-on trade, the weaker dollar, and declining US yields across the curve were all underpinned by the rising market chatter of the Fed’s pause in its tightening campaign, particularly in response to further cooling of the US labour market, as per October’s Nonfarm Payrolls results.
The above seems to have been enough to offset mixed news from megacap Apple. On this, shares of the i-Phone maker declined by 0.5%, even though the company posted a more robust quarterly profit than what analysts had anticipated. The mover lower in Apple was likely due to investor disappointment with the company’s revenue forecast for the final quarter of 2023.
The Nasdaq 100 is projected to encounter initial resistance at the October high of 15333 (October 12). The surpass of this level might pave the way for a rally to the September top of 15618 (September 1) ahead of the weekly peak of 15803 (July 31). If the index advances above the latter, it might dispute the 2023 high of 15932 (July 19). If sellers retake control, the index should find quick support at the October low of 14058 (October 26), which is just ahead of the 200-day SMA of 14007. South of here is the April low of 12724 (April 25), seconded by the March low of 11695 (March 13), and lastly the 2023 low of 10696 (January 20).
Top Gainers: Moderna, Sirius XM, Warner Bros Discovery
Top Losers: Fortinet, Palo Alto Networks, Atlassian Corp Plc
Resistance levels: 15149 15333 15618 (4H chart)
Support levels: 14058 13520 12724 (4H chart)
DOW JONES
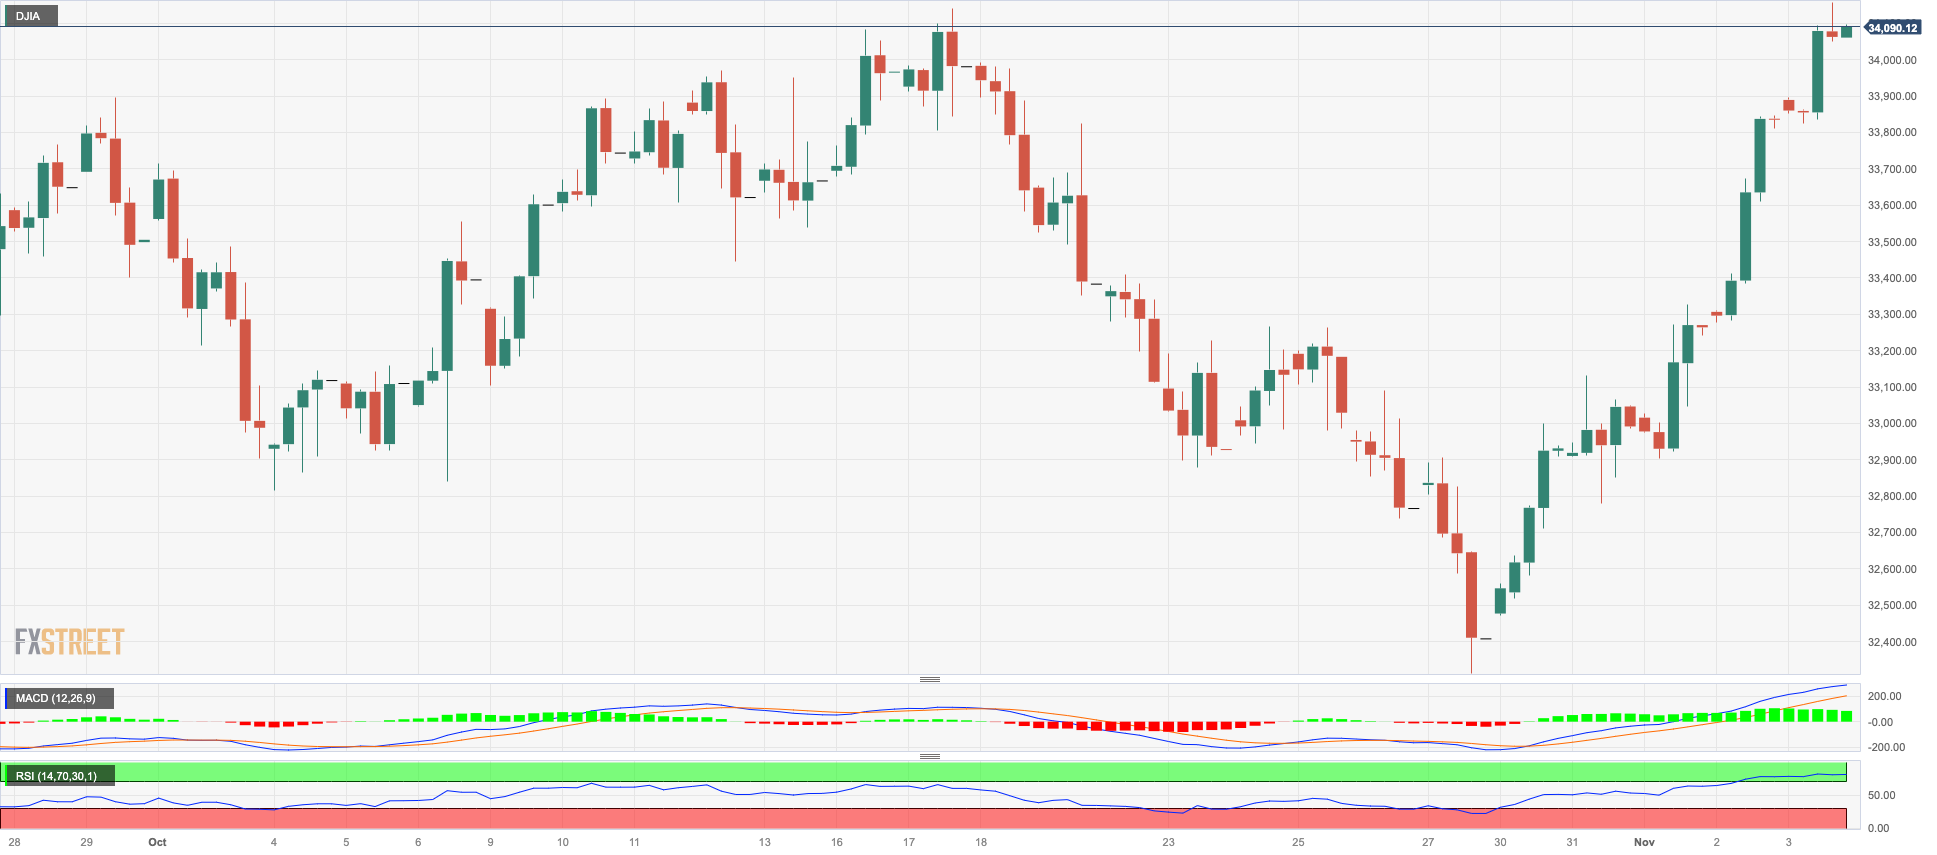
US equities tracked by the Dow Jones rose uninterruptedly since Monday, ending Friday’s session just above the 34000 threshold after an early advance to six-week tops around 34200.
In fact, hopes that the Fed might have concluded its hiking cycle rose in response to the softer-than-expected Nonfarm Payrolls figures for the month of October, boosting the risk appetite pari passu with incipient speculation of the Fed’s rate cuts around June–July 2024.
All in all, the Dow Jones rose 0.66% to 34061, the S&P500 gained 0.94% to 4358, and the tech-reference Nasdaq Composite advanced 1.38% to 13478.
The November high of 34163 (November 3) is up next for the Dow Jones, just ahead of the intermediate 100-day SMA at 34267 and prior to the September top of 34977 (September 14). North of here is the weekly high of 35070 (August 31), seconded by the 2023 peak of 35679 (August 1). On the downside, the October low of 32327 (October 27) provides immediate support ahead of the 2023 bottom of 31429 (March 15) and the 2022 low of 28660 (October 13). The daily RSI climbed to the proximity of 60.
Top Performers: Goldman Sachs, Walgreen Boots, Walt Disney
Worst Performers: UnitedHealth, Procter&Gamble, Chevron
Resistance levels: 34163 34277 35070 (4H chart)
Support levels: 32327 31429 30206 (4H chart)
MACROECONOMIC EVENTS

All Information & Updates provided by:

All information relating to the financial markets available on this page has been prepared and issued by FXStreet (Forexstreet SL, Spain, Reg: B62498233) on the basis of publicly available information and all information believed to be reliable and does not conflict with Kuwaiti local laws, and all necessary care has been taken to before the company to ensure that the facts mentioned are correct from the source.
NCM Investment nor any of its directors or employees shall in any way be held responsible for the contents of this news, and the information contained on this page is intended only to provide clients with publicly available information and should not be construed as investment advice, report or analysis and/or constitute an offer or invitation to buy or sell financial instruments of any kind.
RISK WARNING: Forex and CFDs are highly risky leveraged products, as losses can exceed deposits. Please ensure you understand all the risks and take independent advice if necessary. NCM will segregate the clients based on the criteria of the regulator and its bylaws. NCM does not provide any advisory service; the material published does not constitute advice or a recommendation for a transaction in any financial instrument. NCM accepts no responsibility for any use of the content presented and any consequences of that use. Anyone acting on the information provided does so at their own risk.