
- Contact Us:
-

-

-

-


Daily Market Updates
07 Nov 2023
USDJPY
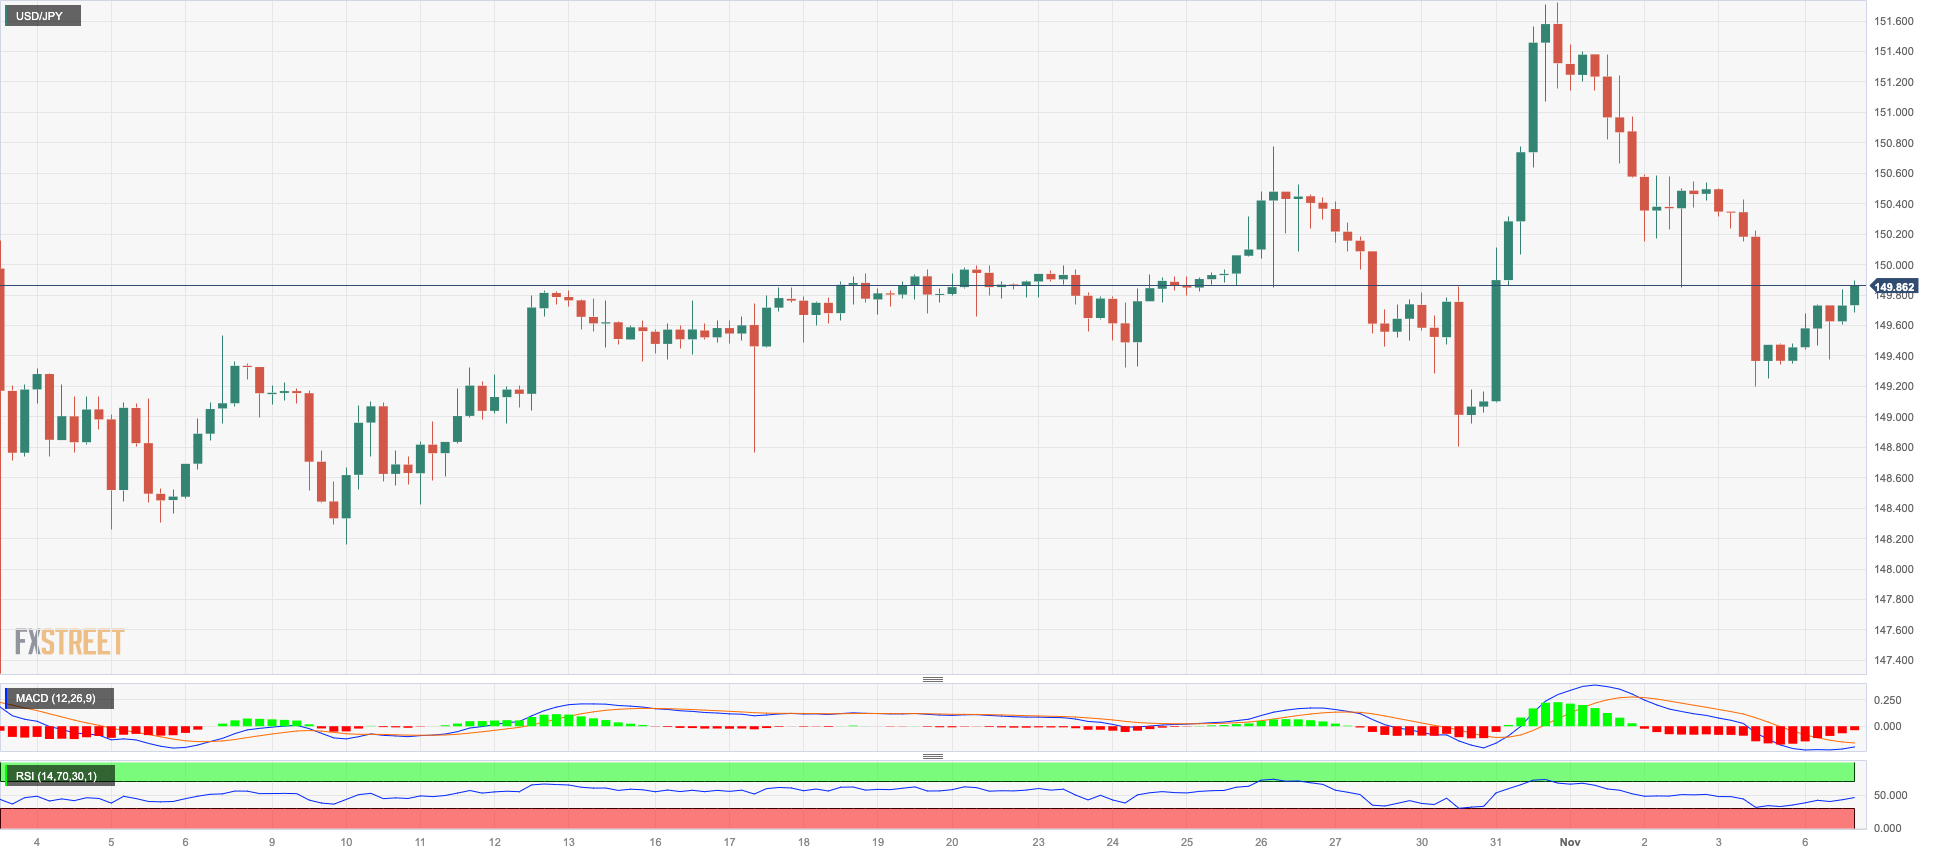
USD/JPY reversed three consecutive daily declines and advanced to the boundaries of the key barrier at 150.00 on Monday.
The move higher in the pair was underpinned by the positive environment around the risk complex, while the dovish message from BoJ Governor K. Ueda also contributed to the selling pressure in the Japanese currency.
On the latter, Ueda mentioned that there are still uncertainties regarding the prospects of achieving a virtuous cycle of inflation and wages. He stated that the central bank will maintain a patient approach to monetary easing. Ueda also expressed his belief that the 10-year JGB yield is not expected to significantly move well beyond 1%, and he noted that financial conditions remain accommodative even after the adjustments made to the YCC programme.
In Japan, the final Jibun Bank Services PMI surpassed the flash prints at 51.6 for the month of October.
A break over the 2023 high of 151.72 (October 31) might send USD/JPY back to the 2022 top of 151.94 (October 21), which would be followed by the round level of 152.00. The 55-day SMA at 148.43, on the other hand, appears to be in temporary contest ahead of the weekly low of 148.16 (October 10), which comes before the October low of 147.27 (October 3). The next level of support appears to be the weekly low of 145.89 (September 11), followed by the September low of 144.43. (September 1). There are no significant support levels below this zone until the August low of 141.50 (August 7), which is just below the 200-day SMA of 140.46 and the July low of 137.23 (July 14). The daily RSI rebounded to the 52 area.
Resistance levels: 151.72 151.94 152.00 (4H chart)
Support levels: 149.18 148.80 148.16 (4H chart)
GBPUSD
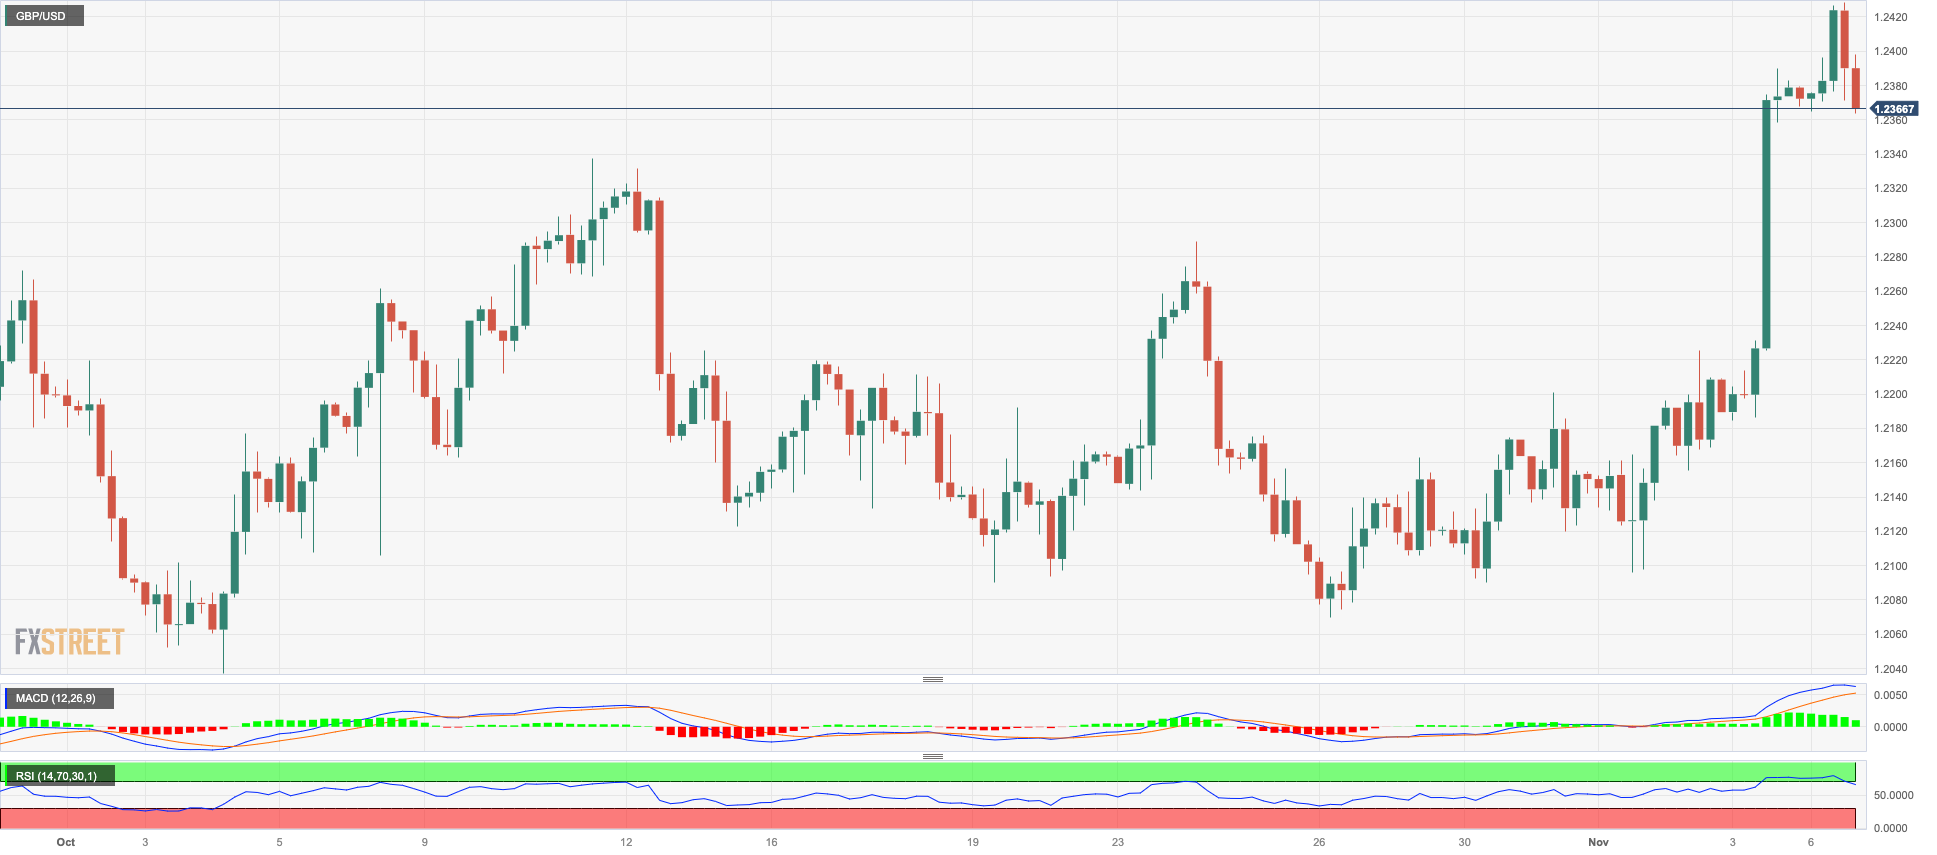
Further upside saw GBP/USD advance to new multi-week tops near 1.2430, an area also coincident with the critical 200-day SMA, at the beginning of the week. The move, however, fizzled out towards the end of the NA session and left sterling with modest losses near 1.2370 vs. the greenback.
The persistent march north in Cable came under pressure in tandem with the late recovery in the US dollar as investors continued to assess October’s Nonfarm Payrolls published on Friday and got ready for the slew of Fed speakers due throughout the week.
In the UK docket, the Construction PMI edged higher to 45.6 during last month and New Car Sales increased 14.3% in the year to October.
Immediately to the upside for GBP/USD comes the November high at 1.2428, which appears reinforced by the key 200-day SMA at 1.2433 and comes ahead of the weekly top of 1.2548 (September 11) and the temporary 100-day SMA at 1.2541. Following its removal, new weekly peaks appear at 1.2746 (August 30), 1.2818 (August 10), and 1.2995 (July 27), all of which are below the psychological 1.3000 level. Bears, on the other hand, will find first support at the October low of 1.2037 (October 3), which is just above the crucial 1.2000 barrier and before the 2023 bottom of 1.1802 (March 8). The daily RSI rose to the 63 region.
Resistance levels: 1.2428 1.2548 1.2746 (4H chart)
Support levels: 1.2191 1.2095 1.2069 (4H chart)
AUDUSD
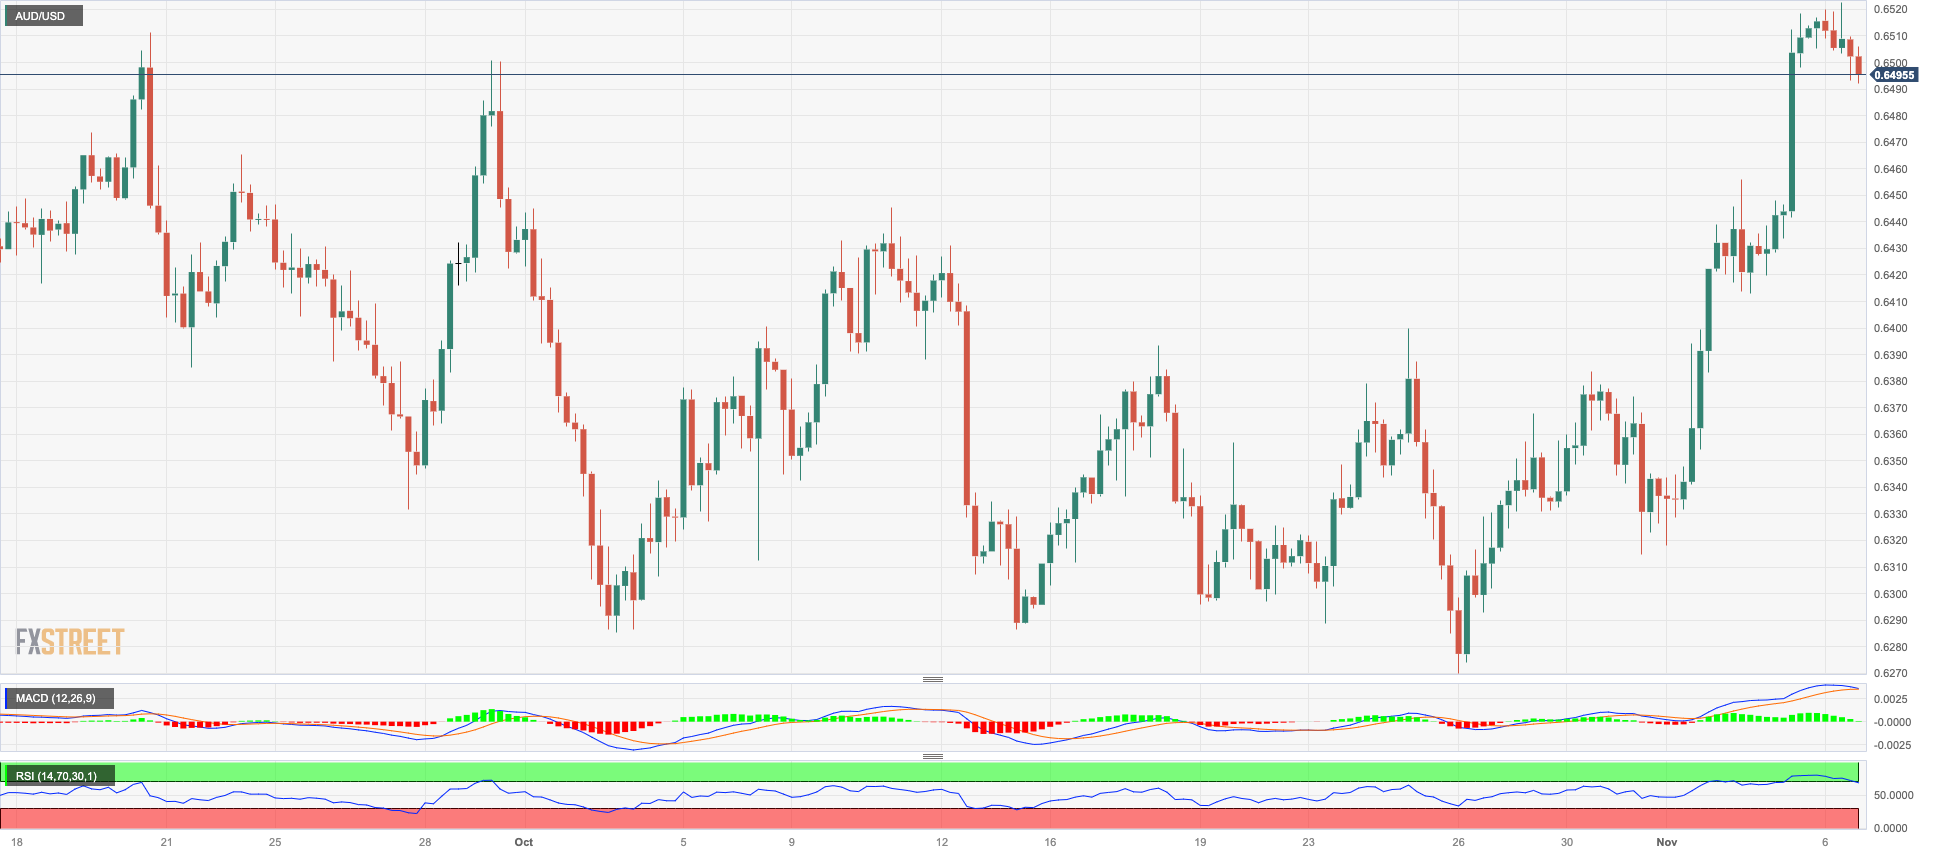
AUD/USD met some selling pressure and saw its three-day rebound trimmed as the week kicked off on Monday.
The Aussie dollar could not capitalize on an inconclusive session in the greenback, while the positive performance of copper and iron ore did not help the currency either.
The Australian docket was empty on Monday, leaving all attention to the key RBA meeting on November 7, where the central bank is expected to hike the OCR by 25 bps.
AUD/USD is presently facing an imminent up-barrier at the November high of 0.6522 (November 6), prior to the weekly top of 0.6616 (August 10) and the 200-day SMA of 0.6617. North from here comes the July peak of 0.6894 (July 14), the June high of 0.6899 (June 16), and finally the important 0.7000 threshold. Instead, if bears regain control, spot may fall to the 2023 low of 0.6270 (October 26), seconded by the round level of 0.6200 and the 2022 low of 0.6169 (October 13). The everyday RSI receded to the sub-62 region.
Resistance levels: 0.6522 0.6616 0.6739 (4H chart)
Support levels: 0.6412 0.6314 0.6270 (4H chart)
GOLD
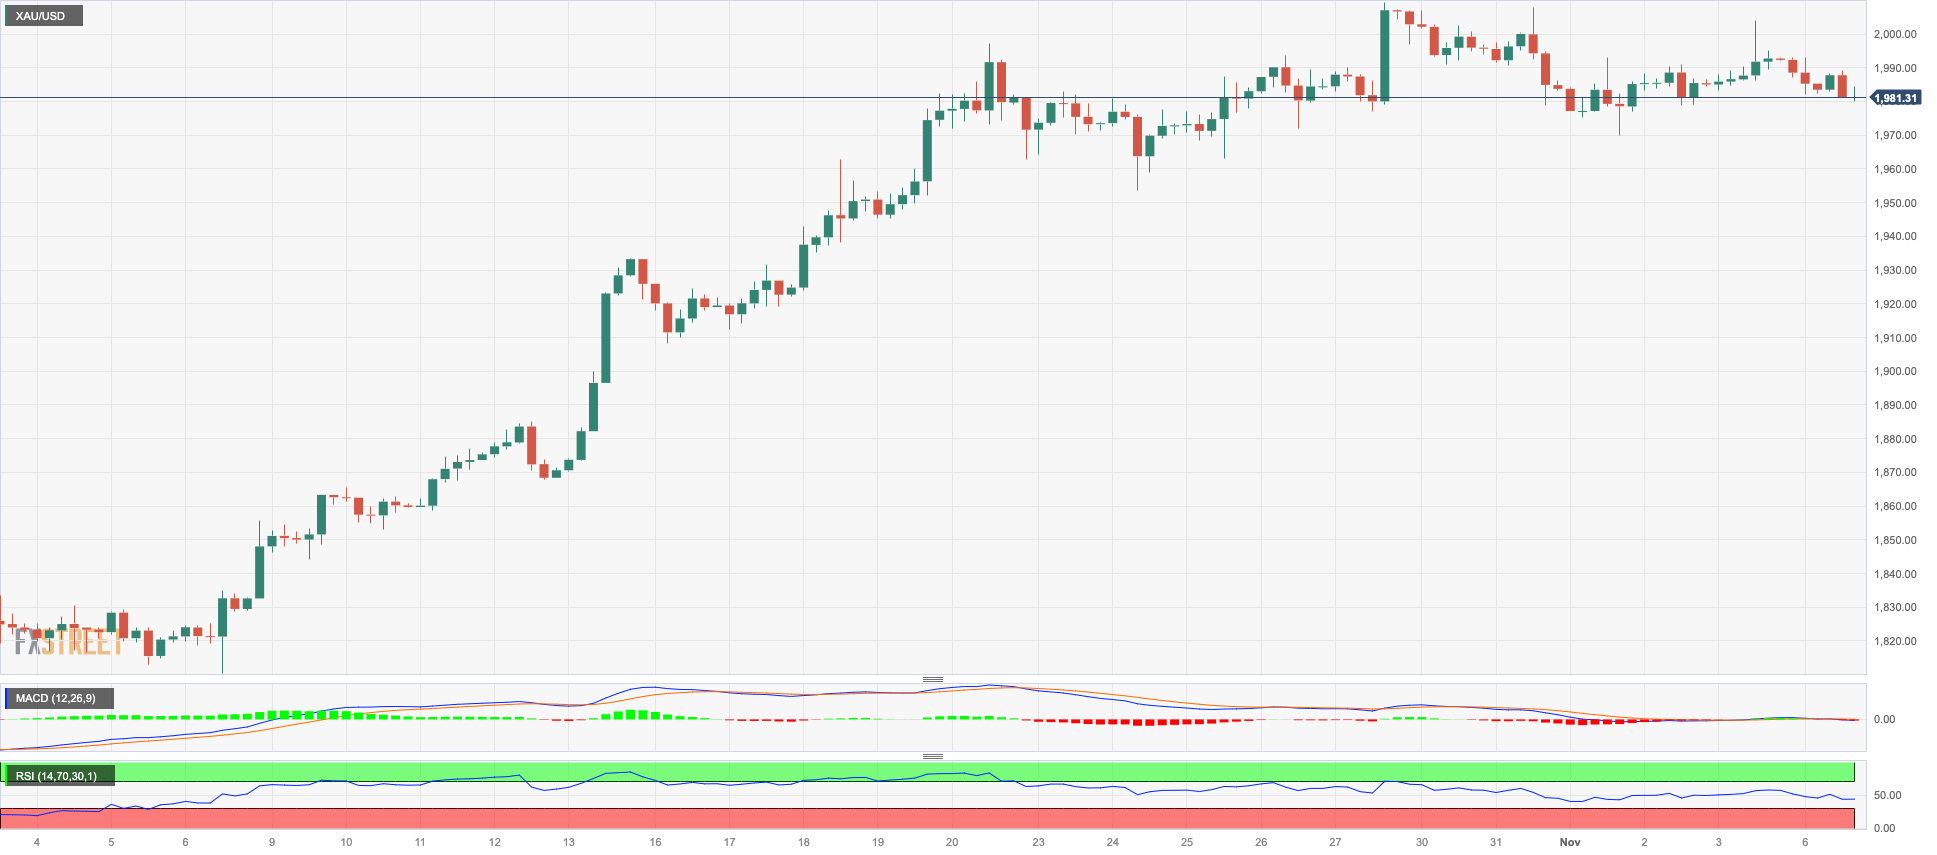
Prices of the troy ounce of gold met some selling pressure and retreated to the $1980 region following two consecutive daily advances at the beginning of the week.
In fact, the knee-jerk in the precious metal came in tandem with a decent recovery in US yields across different timeframes, while the greenback managed to recoup part of the ground lost after Friday’s NFP-driven steep retracement.
Looking ahead, increasing speculation that the Fed may have concluded its tightening efforts is regarded as a favourable factor contributing to the rise in gold prices. Additionally, mounting geopolitical tensions in the Middle East further contribute to this positive outlook.
The surpass of the October high of $2009 (October 27) might prompt gold to challenge the 2023 top of $2067 (May 4), followed by the 2022 peak of $2070 (March 8), and the all-time high of $2075 (7 August 2020). On the contrary, there is some support around the weekly low of $1953 (October 24), which is just above the critical 200-day SMA of $1934. If the market continues to collapse, the provisional 55-day SMA at $1921 may resurface on the horizon, just ahead of the October low of $1810 (October 6). The latter's breakdown reveals the 2023 low of $1804 (February 28), followed by the critical support zone of $1800.
Resistance levels: $2009 $2022 $2048 (4H chart)
Support levels: $1969 $1953 $1917 (4H chart)
CRUDE WTI
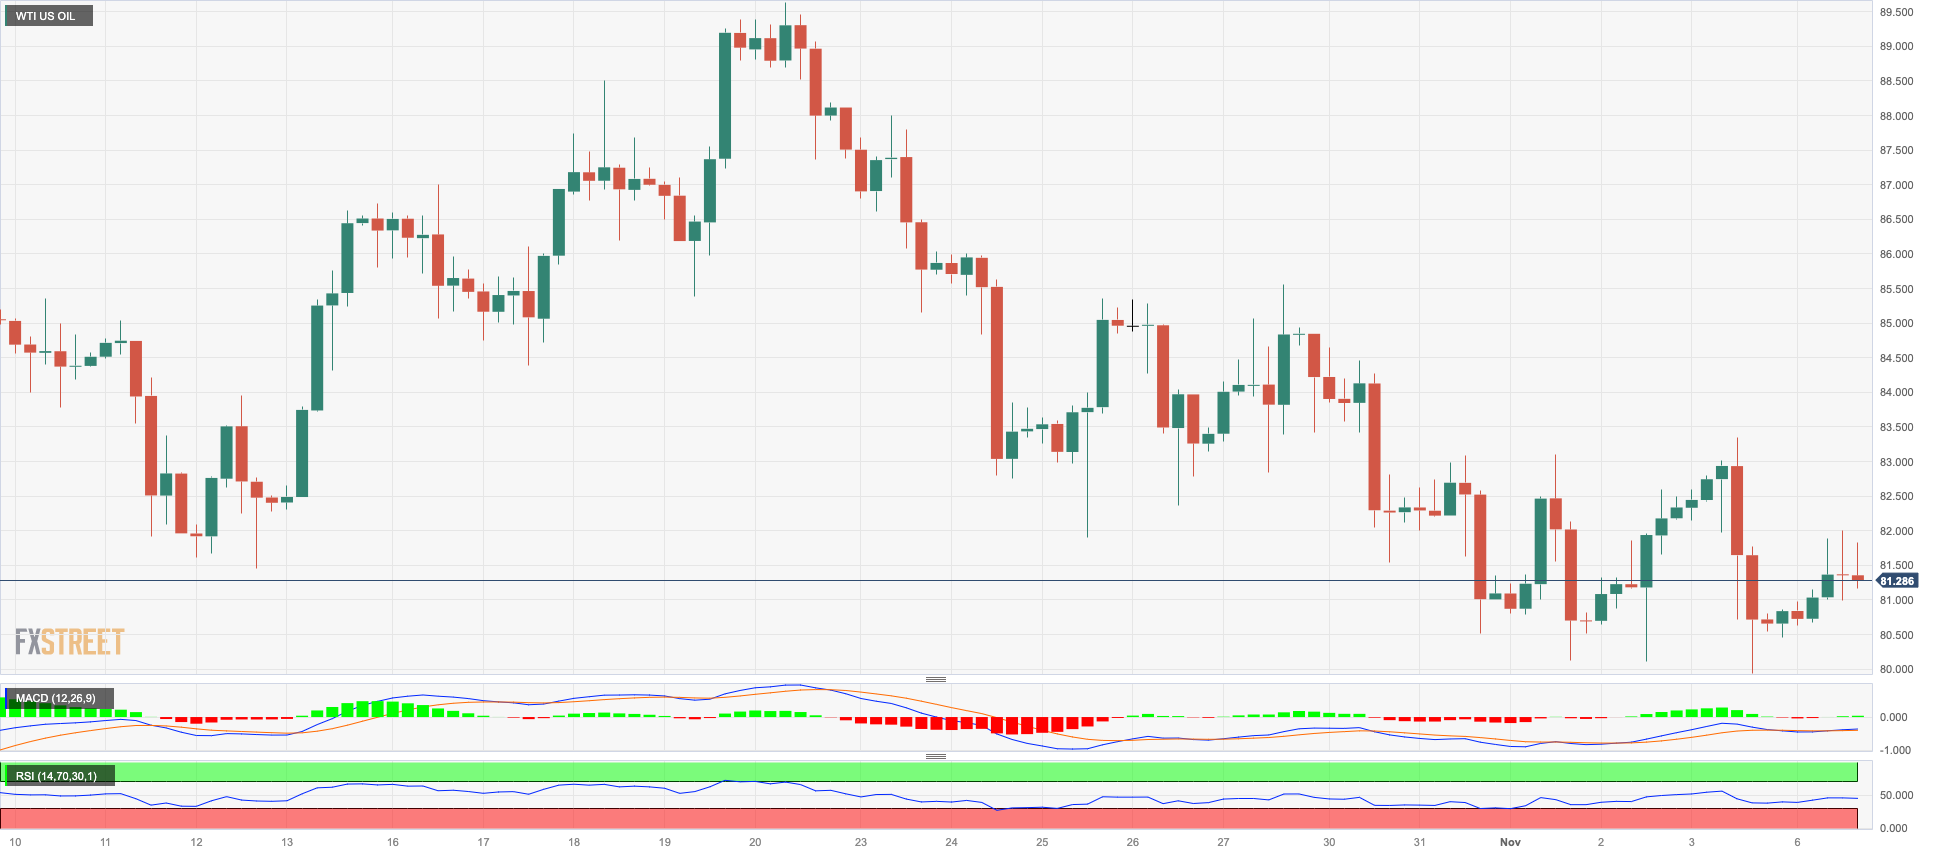
WTI prices extended the erratic performance on Monday, partially recovering Friday’s pullback and briefly trespassing the $82.00 mark per barrel.
The move higher in prices of the commodity came on the back of traders’ assessments of announcements made over the weekend by Saudi Arabia and Russia that they will continue implementing their current supply cuts until the end of the year, which seem to have reignited the tight supply narrative surrounding oil markets.
Later in the week, the API and the EIA will report on US crude oil inventories in the week to November 3 on Tuesday and Wednesday, respectively.
Further losses might push WTI below the crucial $80.00 level, where is located the key 200-day SMA at $78.15. If bears break through this level, a retest of the August low of $77.64 (August 24) is conceivable, followed by a move to the weekly low of $73.89 (July 17) and the critical $70.00 barrier per barrel. The June low of $66.85 (June 12) is south of here, ahead of the crucial $60.00 level and the 2023 low of $63.61 (May 4). Just the opposite, the weekly high of $89.83 (October 18) is impeding bulls' chances of hitting the 2023 top of $94.99 (September 28) for the time being. Further north, there is a weekly peak at $97.65 (August 30, 2022), prior to the psychological barrier of $100.00.
Resistance levels: $83.56 $85.85 $86.44 (4H chart)
Support levels: $80.15 $77.56 $73.81 (4H chart)
GER40
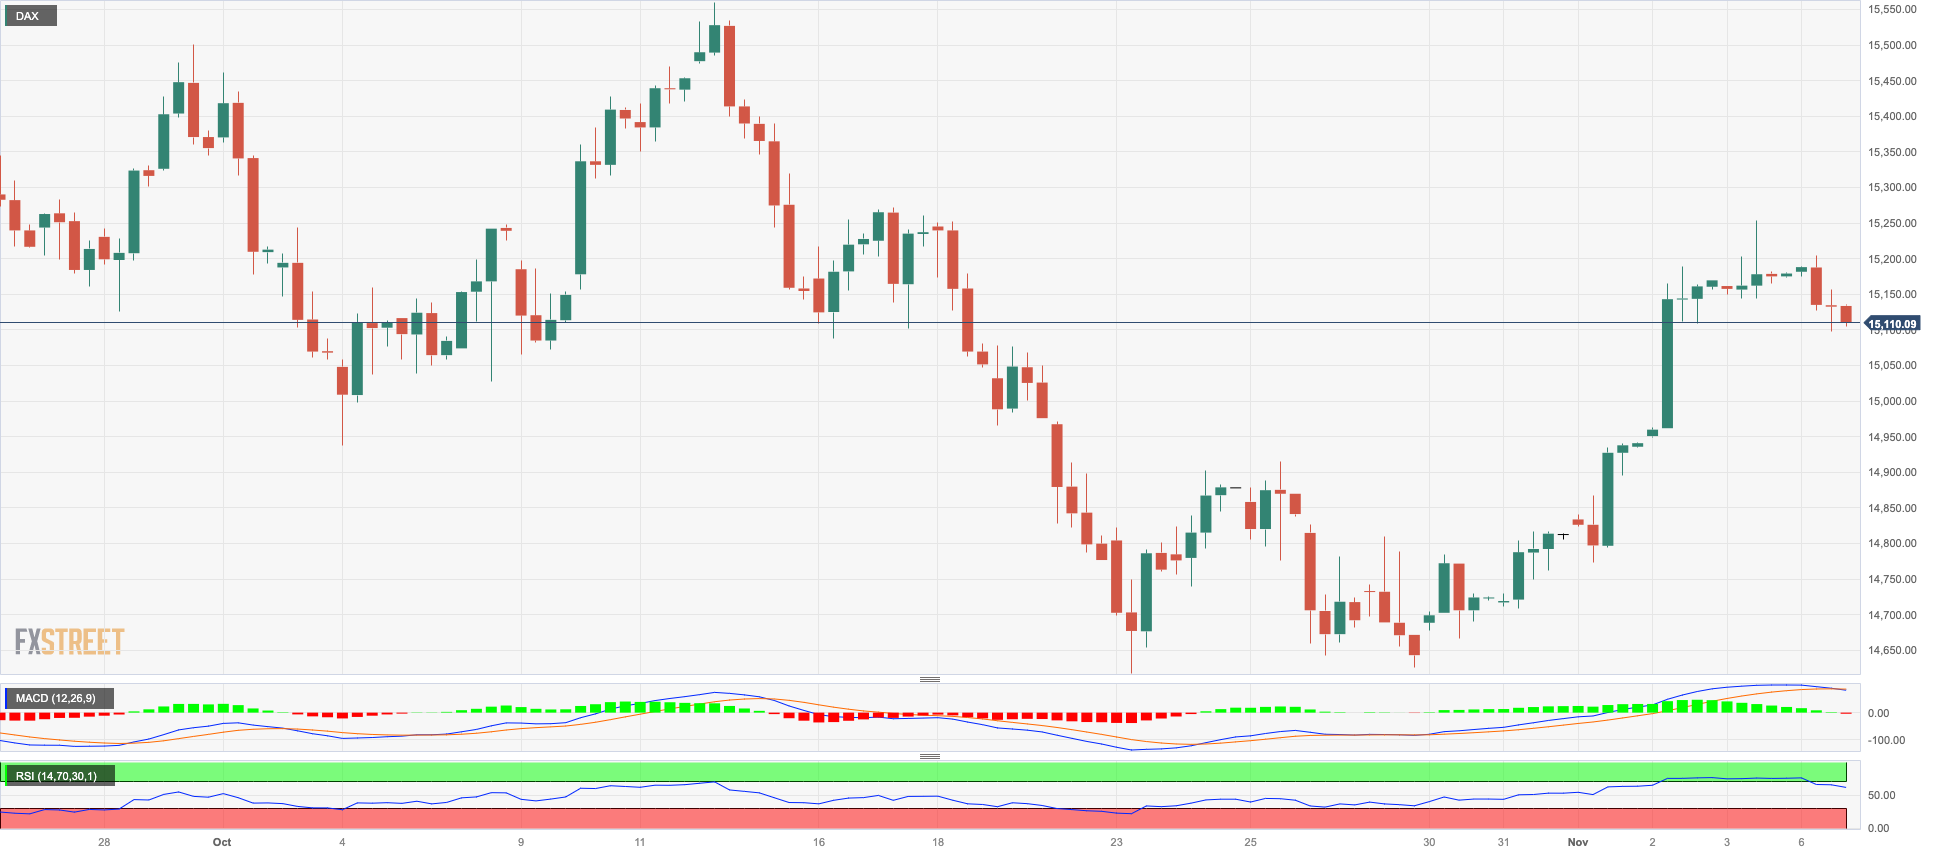
A negative kick-off of the new trading week pushed German equities to negative territory for the first time after five consecutive daily advances when tracked by the DAX40 on Monday.
In fact, the knee-jerk in the index was accompanied by a marked pullback in the 10-year bund yields pari passu with investors’ adjustments to further cooling of the US labour market and renewed speculation of potential interest rate cuts by the Fed at some point by mid-2024, a view that might coincide with intentions by the ECB.
The November high of 15269 (November 3) is the first upward hurdle for the DAX40, followed by the October top of 15575 (October 12) and the important 200-day SMA of 15642. Further north, the index may hit a September peak of 15989 (September 15), before hitting weekly highs of 16042 (August 31) and 16060 (August 10). If this zone is crossed, the index may attempt to break through to its all-time top of 16528 (July 31). By contrast, the index may fall to its October low of 14630 (October 23), before sliding to the March low of 14458 (March 20) and the December 2022 low of 13791 (December 20). The loss of the latter provides for a possible pullback to the 2022 low of 11862 (September 28). The daily RSI breached the 52 level.
Best Performers: Adidas, Siemens AG, Rheinmetall AG
Worst Performers: Vonovia, BASF, Heidelbergcement
Resistance levels: 15269 15575 15989 (4H chart)
Support levels: 14630 14458 13791 (4H chart)
NASDAQ
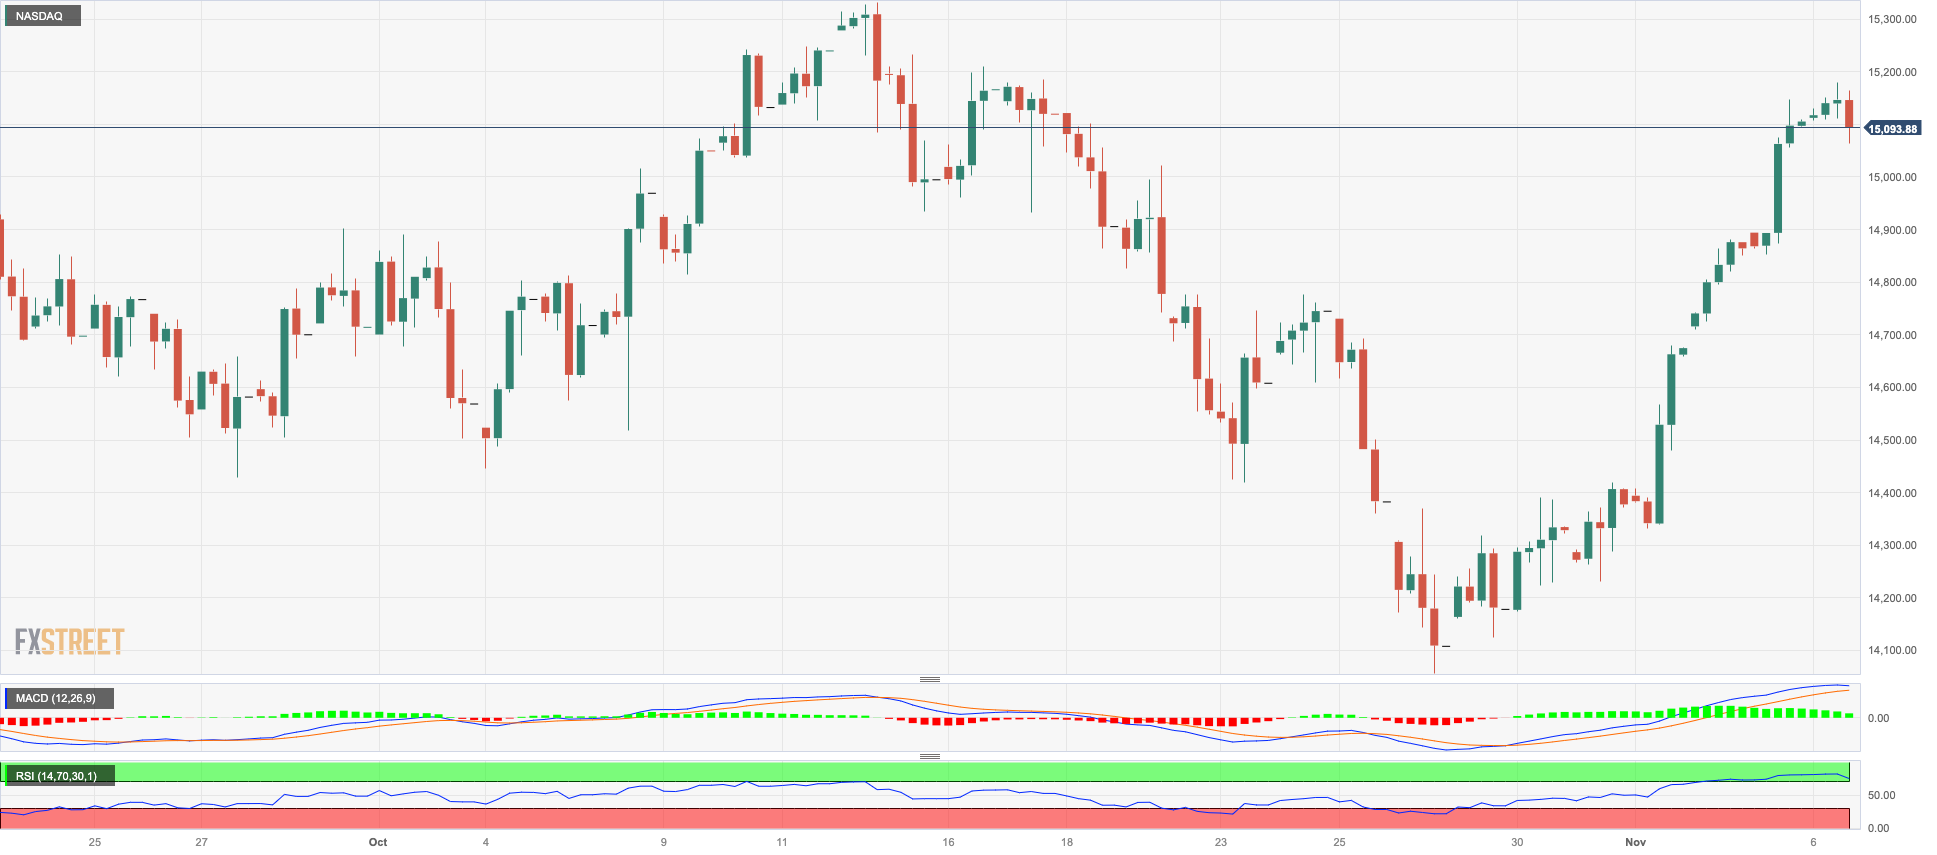
In line with its US peers, the tech benchmark Nasdaq 100 kicked off the week in a vacillating fashion, just above the 15000 threshold.
Indeed, the index navigated a tight range amidst increasing prudence in light of upcoming Fedspeak, the recovery in US yields across the curve, and the weaker greenback, all surrounded by speculation of rate cuts by the Fed in June–July 2024.
The Nasdaq 100 is expected to face early resistance at the October high of 15333 (October 12). If this level is cleared, it may open the way for a rally to the September top of 15618 (September 1), ahead of the weekly peak of 15803 (July 31). If the index rises above the latter, it may challenge the 2023 high of 15932 (July 19). If sellers regain control, the index should find immediate support at the October low of 14058 (October 26), which is slightly ahead of the 200-day SMA of 14025. The April low of 12724 (April 25) lies south of here, followed by the March low of 11695 (March 13), and finally the 2023 low of 10696 (January 20). The RSI on the daily chart looked stable around 58.
Top Gainers: Constellation Energy, Booking, Vertex
Top Losers: Moderna, Lucid Group, Enphase
Resistance levels: 15180 15333 15618 (4H chart)
Support levels: 14058 13520 12724 (4H chart)
DOW JONES
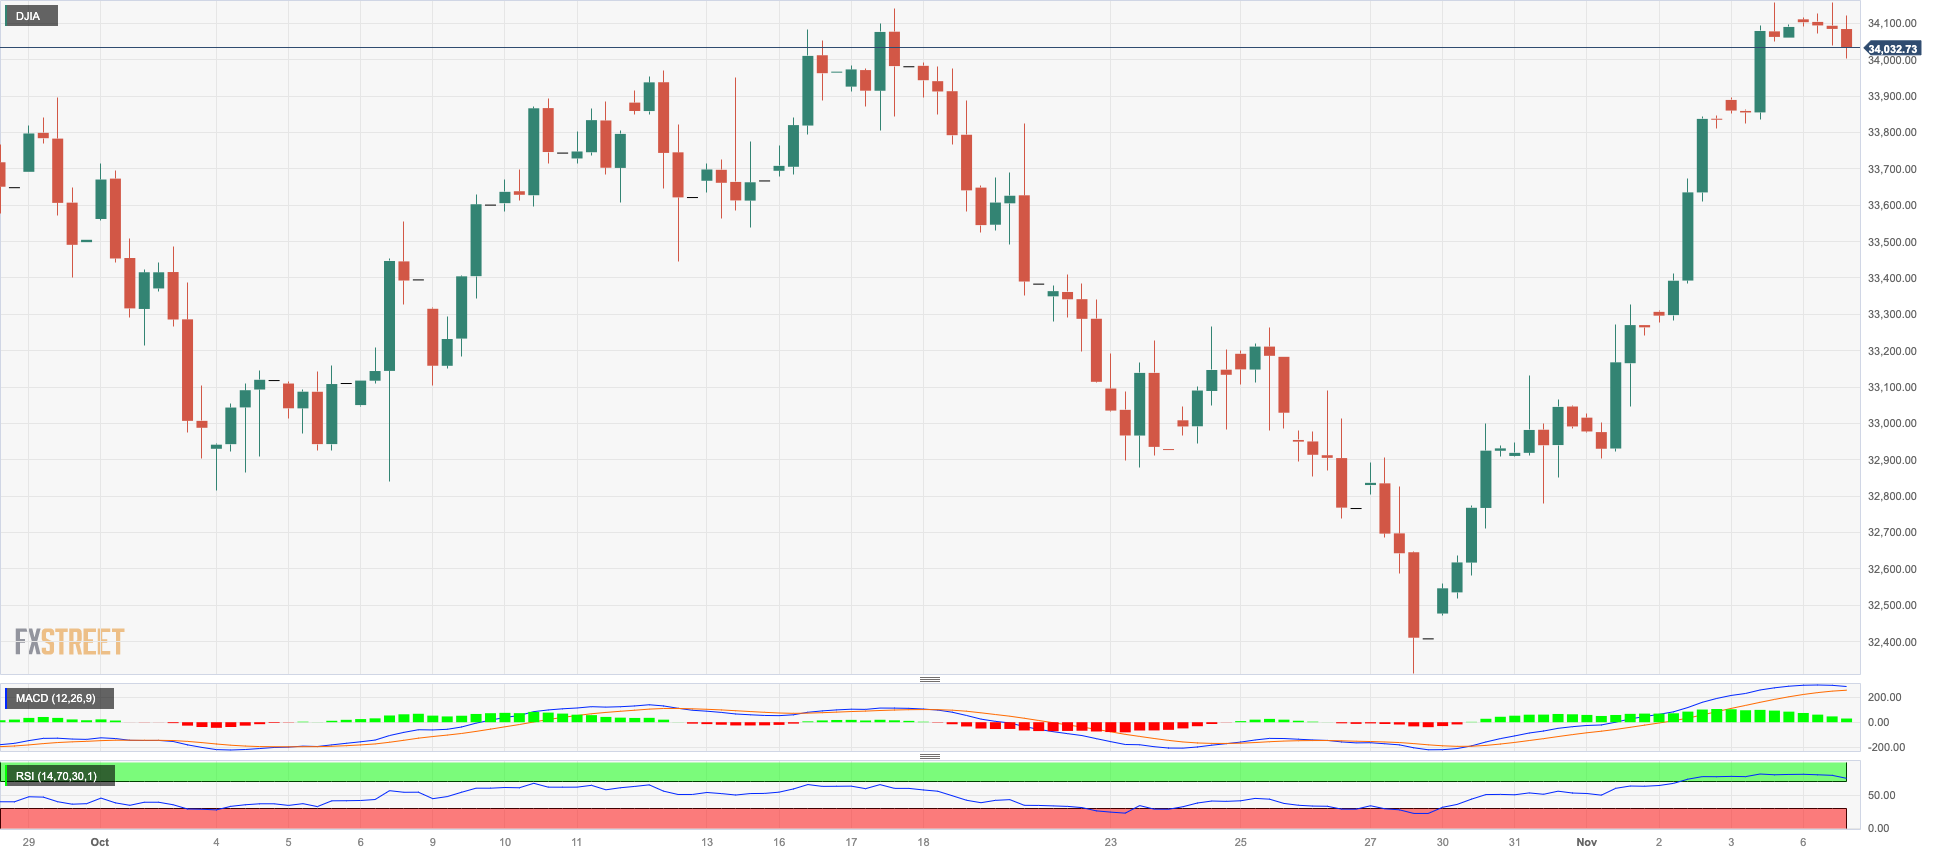
US stocks measured by the Dow Jones saw their first session in red figures after five consecutive daily gains on Monday.
In light of the above, some profit-taking sentiment prevailed at the beginning of the week, as speculation that the Fed might have concluded its hiking cycle remained on the rise, along with incipient chatter pointing to potential interest rate cuts as soon as in the summer of 2024.
Furthermore, a sense of caution also emerged as the release of quarterly earnings reports draws to a close and Fed speakers are expected to take centre stage.
On the whole, the Dow Jones dropped 0.02% to 34057, the S&P500 retreated 0.10% to 4353, and the tech-focused Nasdaq Composite deflated 0.10% to 13463.
Immediately to the upside for the Dow Jones emerges the November high of 34167 (November 6), slightly ahead of the intermediate 100-day SMA at 34269 and before the September top of 34977 (September 14). The weekly peak of 35070 (August 31) lies north of here, followed by the 2023 high of 35679 (August 1). On the downside, the October low of 32327 (October 27) provides immediate support ahead of the 2023 bottom of 31429 (March 15) and the 2022 low of 28660 (October 13). The daily RSI receded below the 60 level.
Top Performers: Amgen, Apple, Coca-Cola
Worst Performers: Walgreen Boots, Caterpillar, Goldman Sachs
Resistance levels: 34167 34276 35070 (4H chart)
Support levels: 32327 31429 30206 (4H chart)
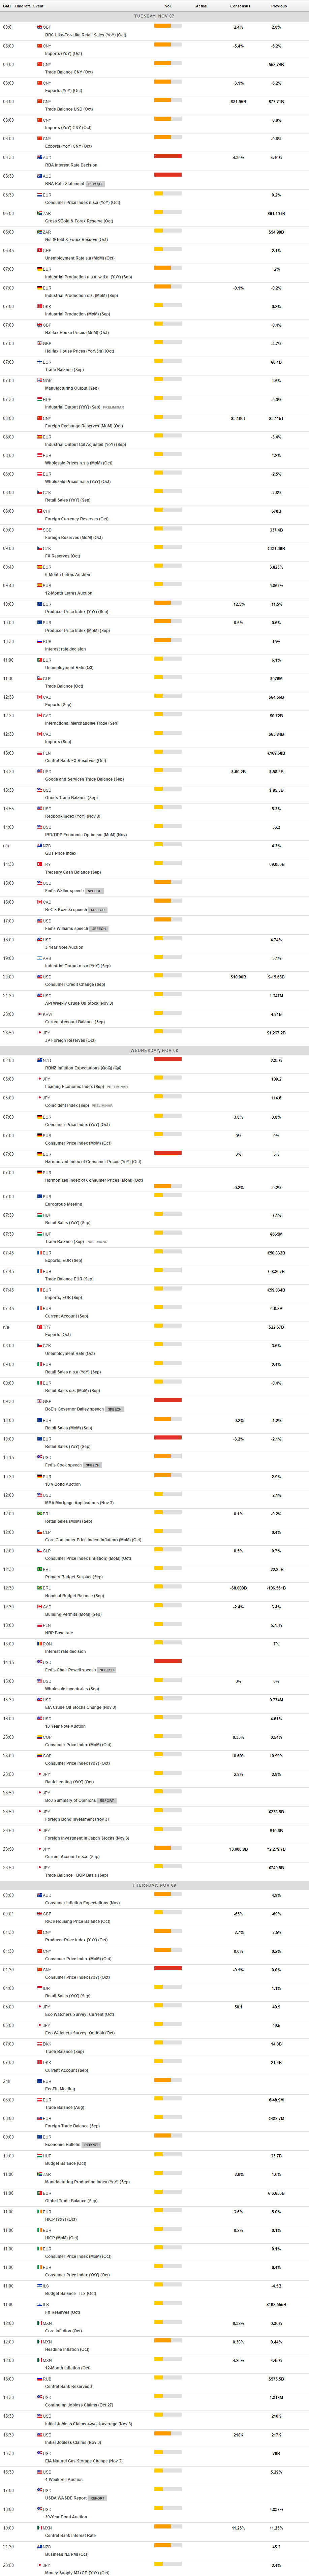
MACROECONOMIC EVENTS
All Information & Updates provided by:

All information relating to the financial markets available on this page has been prepared and issued by FXStreet (Forexstreet SL, Spain, Reg: B62498233) on the basis of publicly available information and all information believed to be reliable and does not conflict with Kuwaiti local laws, and all necessary care has been taken to before the company to ensure that the facts mentioned are correct from the source.
NCM Investment nor any of its directors or employees shall in any way be held responsible for the contents of this news, and the information contained on this page is intended only to provide clients with publicly available information and should not be construed as investment advice, report or analysis and/or constitute an offer or invitation to buy or sell financial instruments of any kind.
RISK WARNING: Forex and CFDs are highly risky leveraged products, as losses can exceed deposits. Please ensure you understand all the risks and take independent advice if necessary. NCM will segregate the clients based on the criteria of the regulator and its bylaws. NCM does not provide any advisory service; the material published does not constitute advice or a recommendation for a transaction in any financial instrument. NCM accepts no responsibility for any use of the content presented and any consequences of that use. Anyone acting on the information provided does so at their own risk.