
- Contact Us:
-

-

-

-


Daily Market Updates
08 Nov 2023
USDJPY
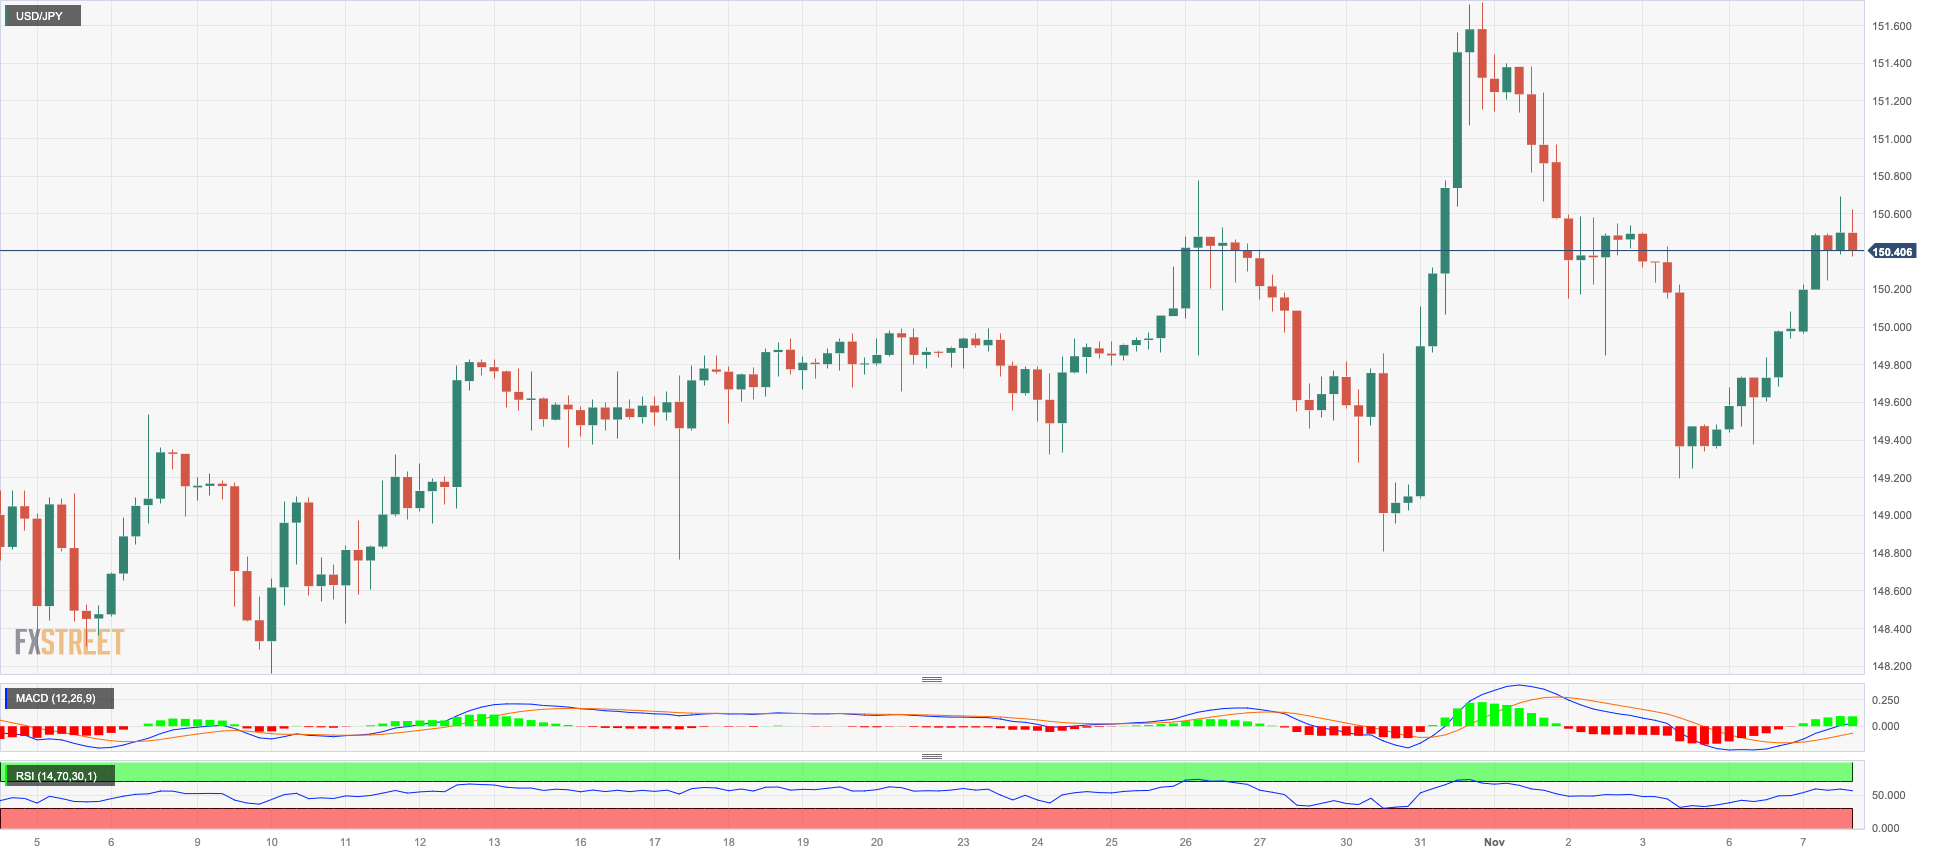
USD/JPY added to the optimism seen on Monday and reclaimed the area beyond the critical hurdle of 150.00 the figure on Tuesday.
In fact, the continuation of the march north in the greenback contributed to the upside momentum in spot, while the corrective decline in US and Japanese bond yields also helped with the selling bias in the yen.
In Japan, Household Spending contracted at an annualized 2.8% in September and expanded by 0.3% vs. the previous month.
A break over the 2023 high of 151.72 (October 31) might drive USD/JPY back to the 2022 top of 151.94 (October 21), just ahead of the round level of 152.00. On the flip side, the 55-day SMA, at 148.52, looks to be a temporary contention ahead of the weekly low of 148.16 (October 10), which comes before the October low of 147.27 (October 3). The weekly low of 145.89 (September 11) seems to be the next level of support, seconded by the September low of 144.43 (September 1). Below this zone, there are no meaningful support levels until the August low of 141.50 (August 7), which is slightly below the 200-day SMA of 140.56 and the July low of 137.23 (July 14). The everyday RSI ticked higher to the proximity of 56.
Resistance levels: 150.49 151.72 151.94 152.00 (4H chart)
Support levels: 149.18 148.80 148.16 (4H chart)
GBPUSD
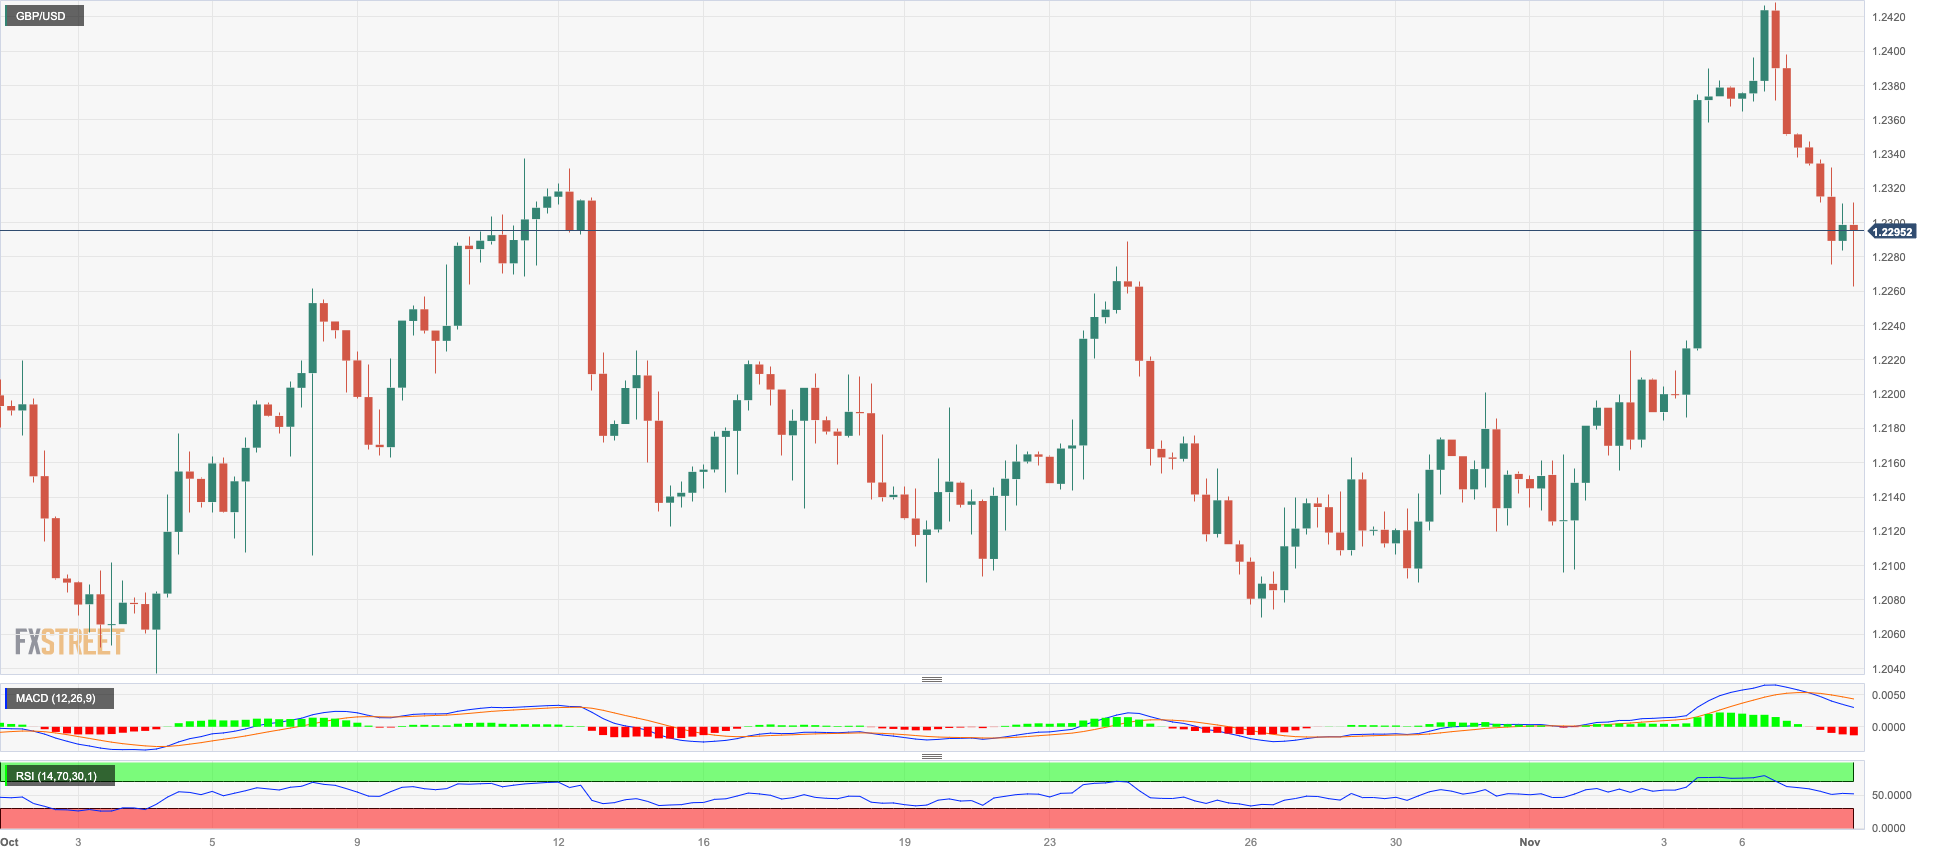
GBP/USD added to losses seen at the beginning of the week and receded to the proximity of the 1.2260 region on Tuesday.
Further weakness in Cable came on the back of an extra rebound in the greenback and the loss of momentum in the appetite for risk-linked assets, particularly in response to discouraging trade results in the Chinese docket.
Across the Channel, BRC Retail Sales Monitor rose at an annualized 2.6% in October, while house prices tracked by Halifax rose 1.1% MoM in October and dropped 3.2% from a year earlier.
The November high at 1.2428 looks to be supported by the crucial 200-day SMA at 1.2433, and it comes ahead of the weekly top of 1.2548 (September 11). Following its removal, fresh weekly peaks at 1.2746 (August 30), 1.2818 (August 10), and 1.2995 (July 27) arise, all of which are prior to the psychological 1.3000 threshold. Bears, on the other side, will find first support at the October low of 1.2037 (October 3), which is just above the important 1.2000 barrier and before the 2023 low of 1.1802 (March 8). The daily RSI dropped below the 55 level.
Resistance levels: 1.2428 1.2548 1.2746 (4H chart)
Support levels: 1.2190 1.2095 1.2069 (4H chart)
AUDUSD
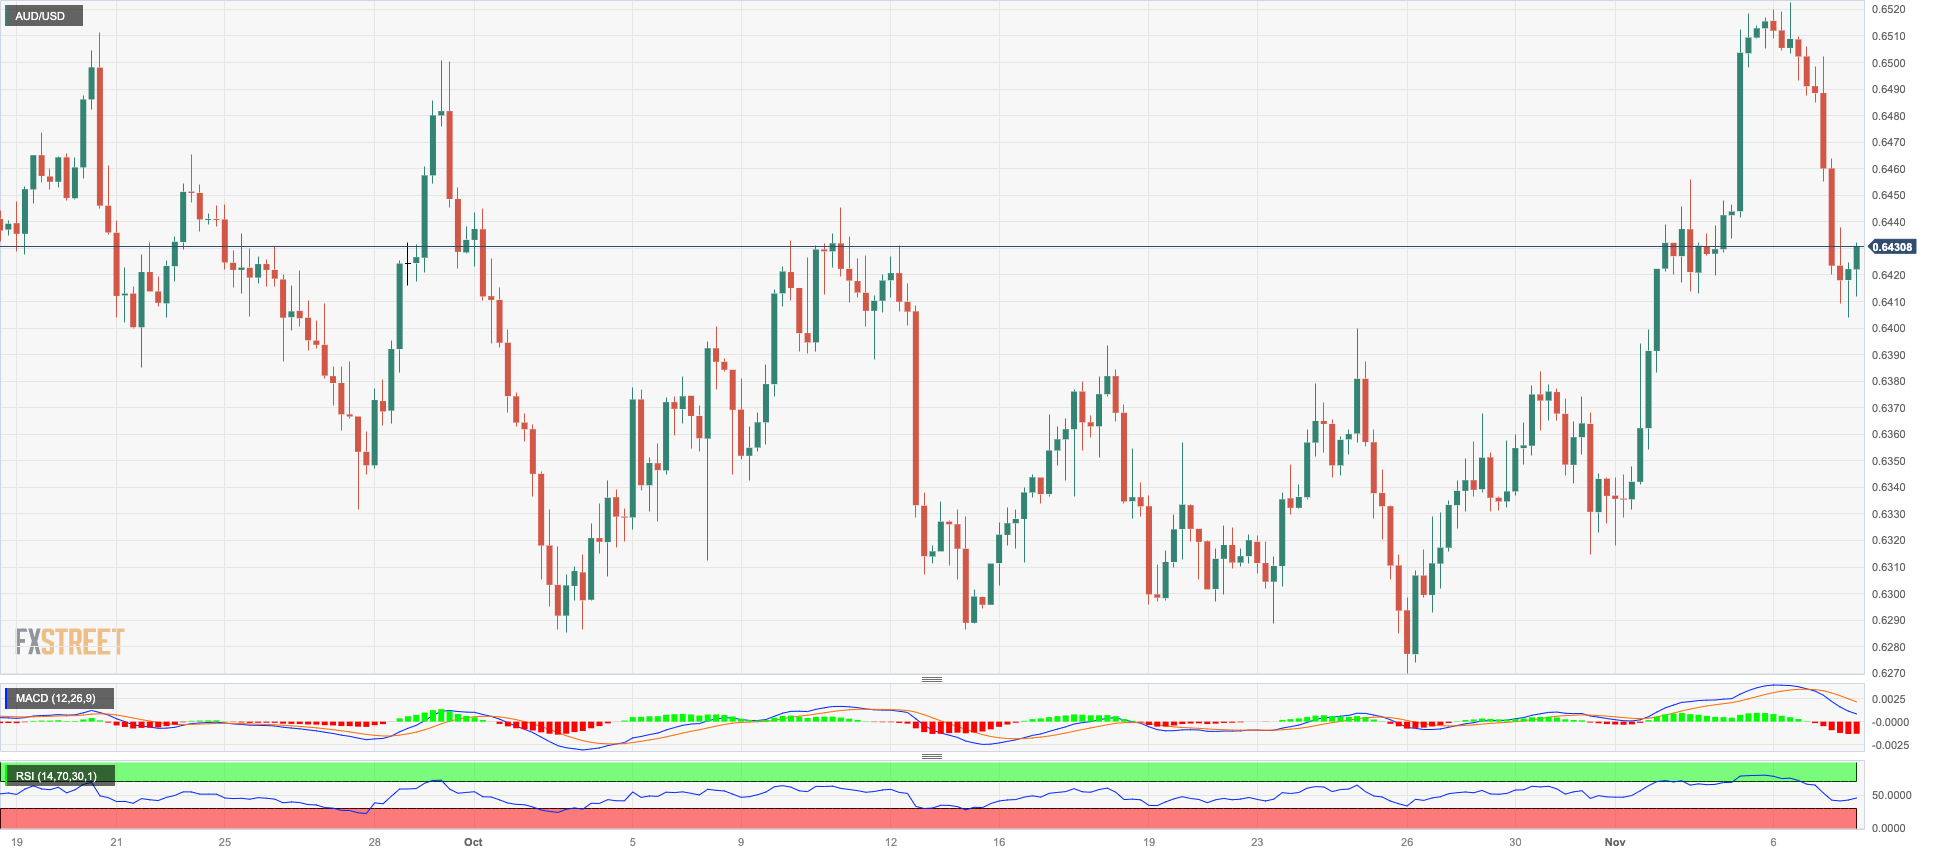
The firm bias in the greenback put the Aussie dollar and the rest of the risk-associated universe under extra pressure, dragging AUD/USD to three-day lows in the boundaries of the 0.6400 neighbourhood on Tuesday.
In addition, poor prints from Chinese trade results, in combination with the generalized poor performance of the commodity complex, weighed further on the AUD.
Additionally, further weakness came from the RBA’s dovish hike after the central bank matched consensus and raised its OCR by 25 bps to 4.35% at its event on Tuesday. The central bank’s decision came on the back of the perception that inflation might take longer to return to the target while the domestic labour market remains tight despite some cooling as of late. Regarding forward guidance, the RBA stated that whether additional tightening of monetary policy is necessary to achieve the target inflation rate within a reasonable timeframe will be contingent on the data and the evolving assessment of risks.
If bulls regain the upper hand, AUD/USD should initially revisit the November high of 0.6522 (November 6), prior to the weekly top of 0.6616 (August 10) and the 200-day SMA of 0.6614. From here, the July peak of 0.6894 (July 14), the June high of 0.6899 (June 16), and the crucial 0.7000 level are all to the north. Just the opposite, there is an interim support at the 55-day SMA at 0.6397 ahead of the 2023 low of 0.6270 (October 26), followed by the round level of 0.6200 and the 2022 low of 0.6169 (October 13). The daily RSI tumbled to the 54 region.
Resistance levels: 0.6522 0.6616 0.6739 (4H chart)
Support levels: 0.6409 0.6314 0.6270 (4H chart)
GOLD
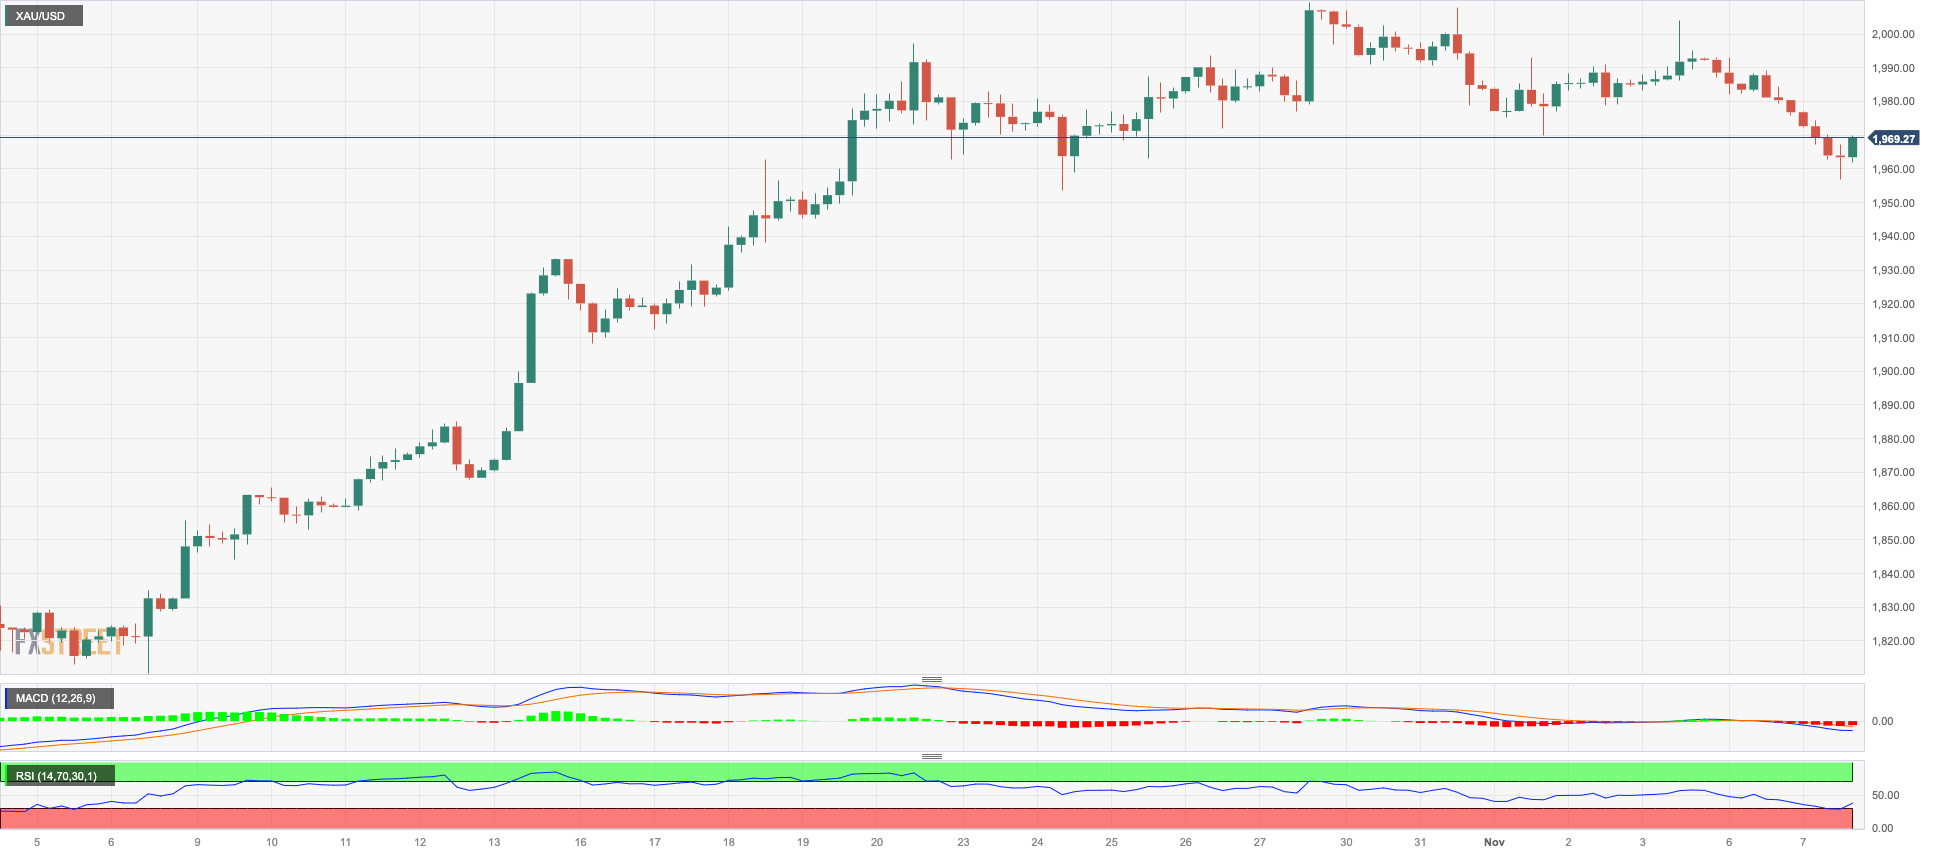
The continuation of the upside bias in the greenback put the precious metal under further downside pressure, dragging it to new two-week lows near $1960 per troy ounce on turnaround Tuesday.
Indeed, the loss of momentum in the risk appetite motivated the USD Index (DXY) to rebound further and reclaim the upper 105.00s, while small gains in the short end and the belly of the US yield curve also seem to have contributed to the downward trend in bullion.
On contemplating the path ahead, there is intensifying speculation that the Fed may have concluded that its restrictive efforts are viewed as a beneficial factor contributing to the ascent in gold prices. Additionally, mounting geopolitical strains in the Middle East further contribute to this auspicious outlook.
If the selling pressure accelerates, gold might revisit the weekly low of $1953 (October 24), which is just above the crucial 200-day SMA of $1934. If the yellow metal continues to tumble, the provisional 55-day SMA of $1922 comes next ahead of the October low of $1810 (October 6). The loss of the latter exposes the 2023 low of $1804 (February 28), seconded by the critical support zone of $1800. On the upside, the immediate up barrier emerges at the October peak of $2009 (October 27) prior to the 2023 high of $2067 (May 4), ahead of the 2022 top of $2070 (March 8), and the all-time high of $2075 (August 7, 2020).
Resistance levels: $2009 $2022 $2048 (4H chart)
Support levels: $1956 $1953 $1920 (4H chart)
CRUDE WTI
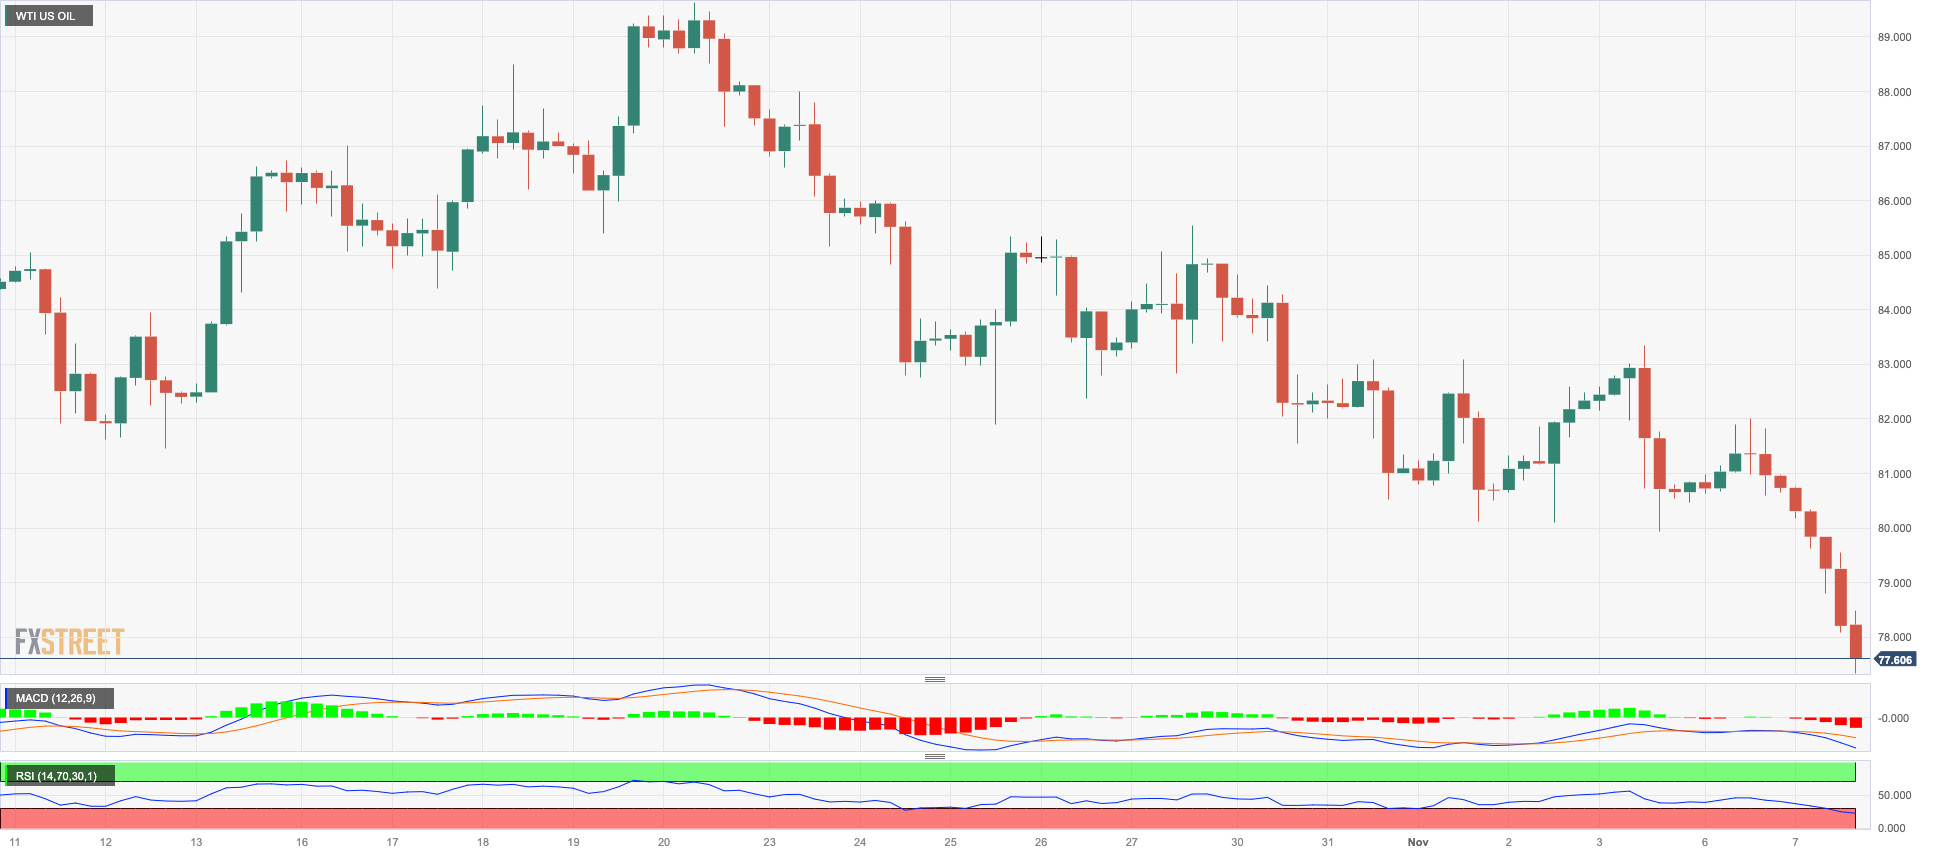
Prices of the barrel of the American reference for the sweet light crude oil dropped sharply to the proximity of the $77.00 mark on Tuesday, or fresh four-month lows.
The steep pullback in prices of the commodity came in tandem with rising demand concerns, which were particularly exacerbated following poor results from the Chinese docket, which in turn further deteriorated the country’s short-term economic outlook.
In addition, the strong dollar also collaborated with the downtrend in WTI as well as somewhat dwindling jitters over the possibility that the crisis in the Middle East could spread to neighbouring regions.
Further losses might prompt WTI to retest the weekly low of $73.89 (July 17) ahead of the crucial $70.00 barrier per barrel. The June low of $66.85 (June 12) is farther south, prior to the 2023 bottom of $63.61 (May 4) and the key $60.00 yardstick. Instead, the 55-day SMA at $85.88 is expected to offer an interim hurdle ahead of the weekly high of $89.83 (October 18) and the 2023 top of $94.99 (September 28). North from here aligns the weekly peak of $97.65 (August 30, 2022), which is seen as the last defence for a potential visit to the psychological $100.00 mark.
Resistance levels: $83.56 $86.15 $89.82 (4H chart)
Support levels: $77.52 $73.81 $70.18 (4H chart)
GER40
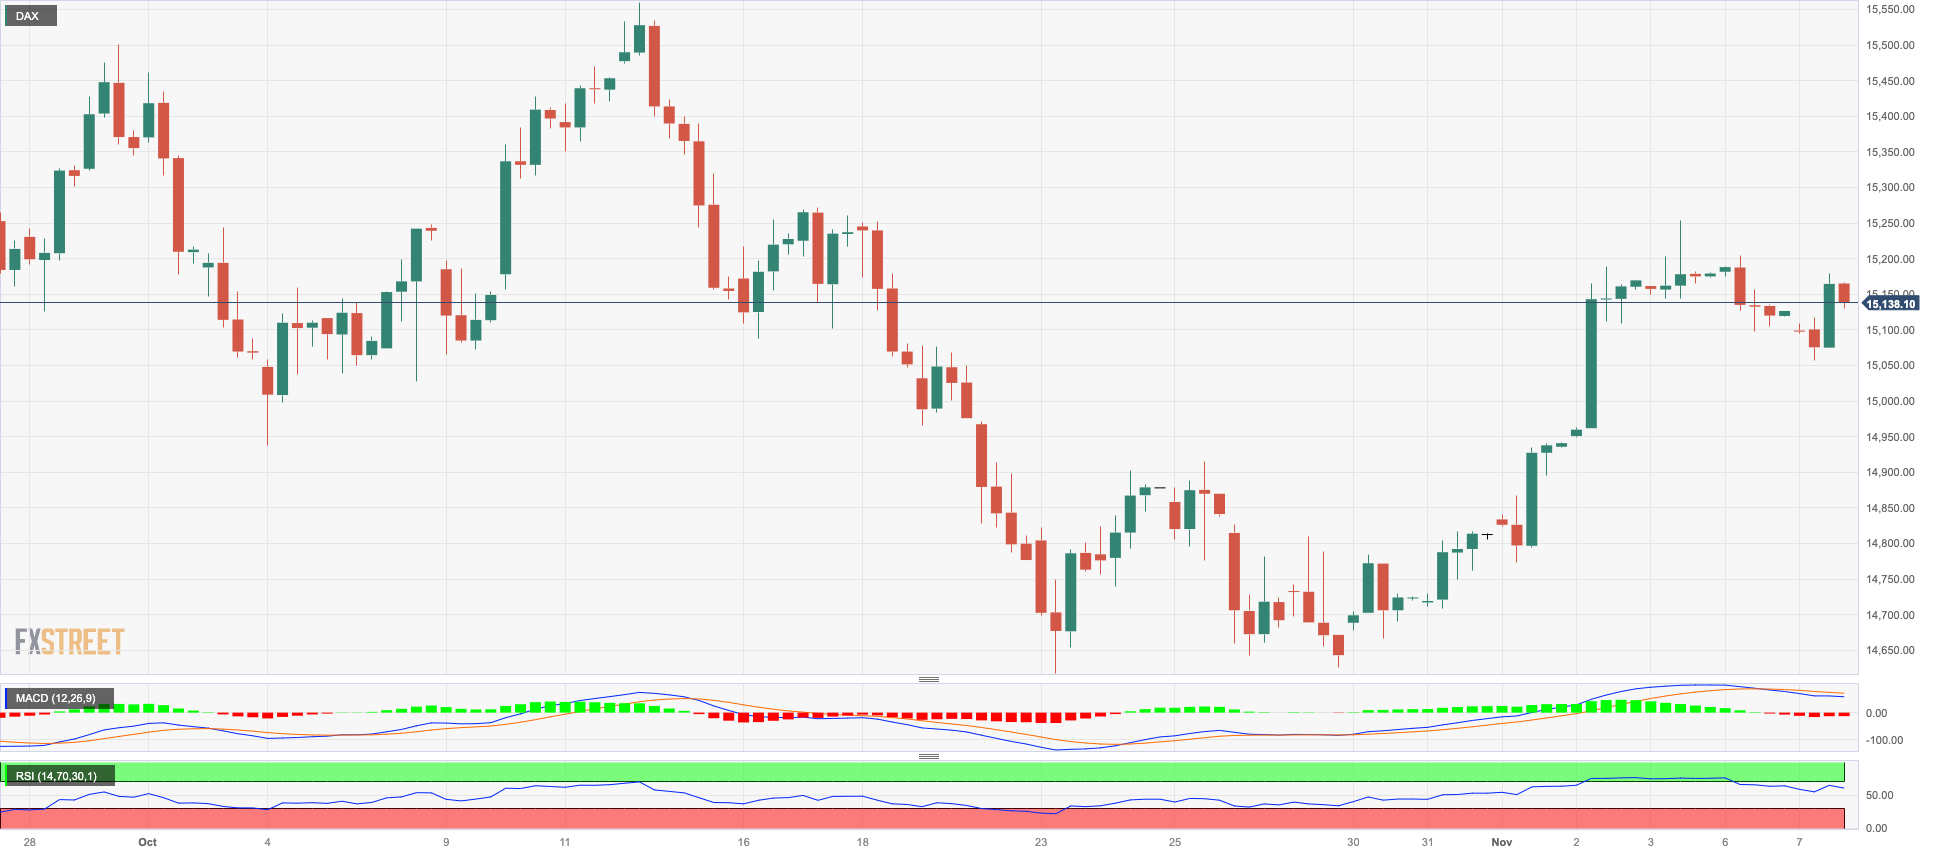
Germany’s blue-chip reference DAX40 rapidly left behind Monday’s negative price action and managed to advance decently on Tuesday.
The recovery in the index came despite the generalized downbeat tone in the risk-linked galaxy, especially after another poor result from the Chinese docket, which signalled that a convincing rebound in that economy will have to wait longer.
In the meantime, occasional bullish attempts in the index appear to follow expectations of a protracted pause of the ECB’s tightening campaign. Tuesday’s move higher also came in contrast to another negative session in the 10-year bund yields.
The DAX40's initial upward hurdle is the November high of 15269 (November 3), followed by the October top of 15575 (October 12) and the crucial 200-day SMA of 15642. Further north, the index may reach a September peak of 15989 (September 15), seconded by weekly highs of 16042 (August 31) and 16060 (August 10). If this zone is cleared, the index may aim to reach its all-time top of 16528. (July 31).The index, on the other hand, may fall to its October low of 14630 (October 23), before the March low of 14458 (March 20) and the December 2022 low of 13791 (December 20). The loss of the latter could prompt a drop to the 2022 low of 11862 (September 28) to emerge on the horizon. The daily RSI settled around 52.
Best Performers: Deutsche Boerse, SAP, Vonovia
Worst Performers: Daimler Truck Holding, BMW ST, Porsche
Resistance levels: 15269 15575 15989 (4H chart)
Support levels: 14630 14458 13791 (4H chart)
NASDAQ
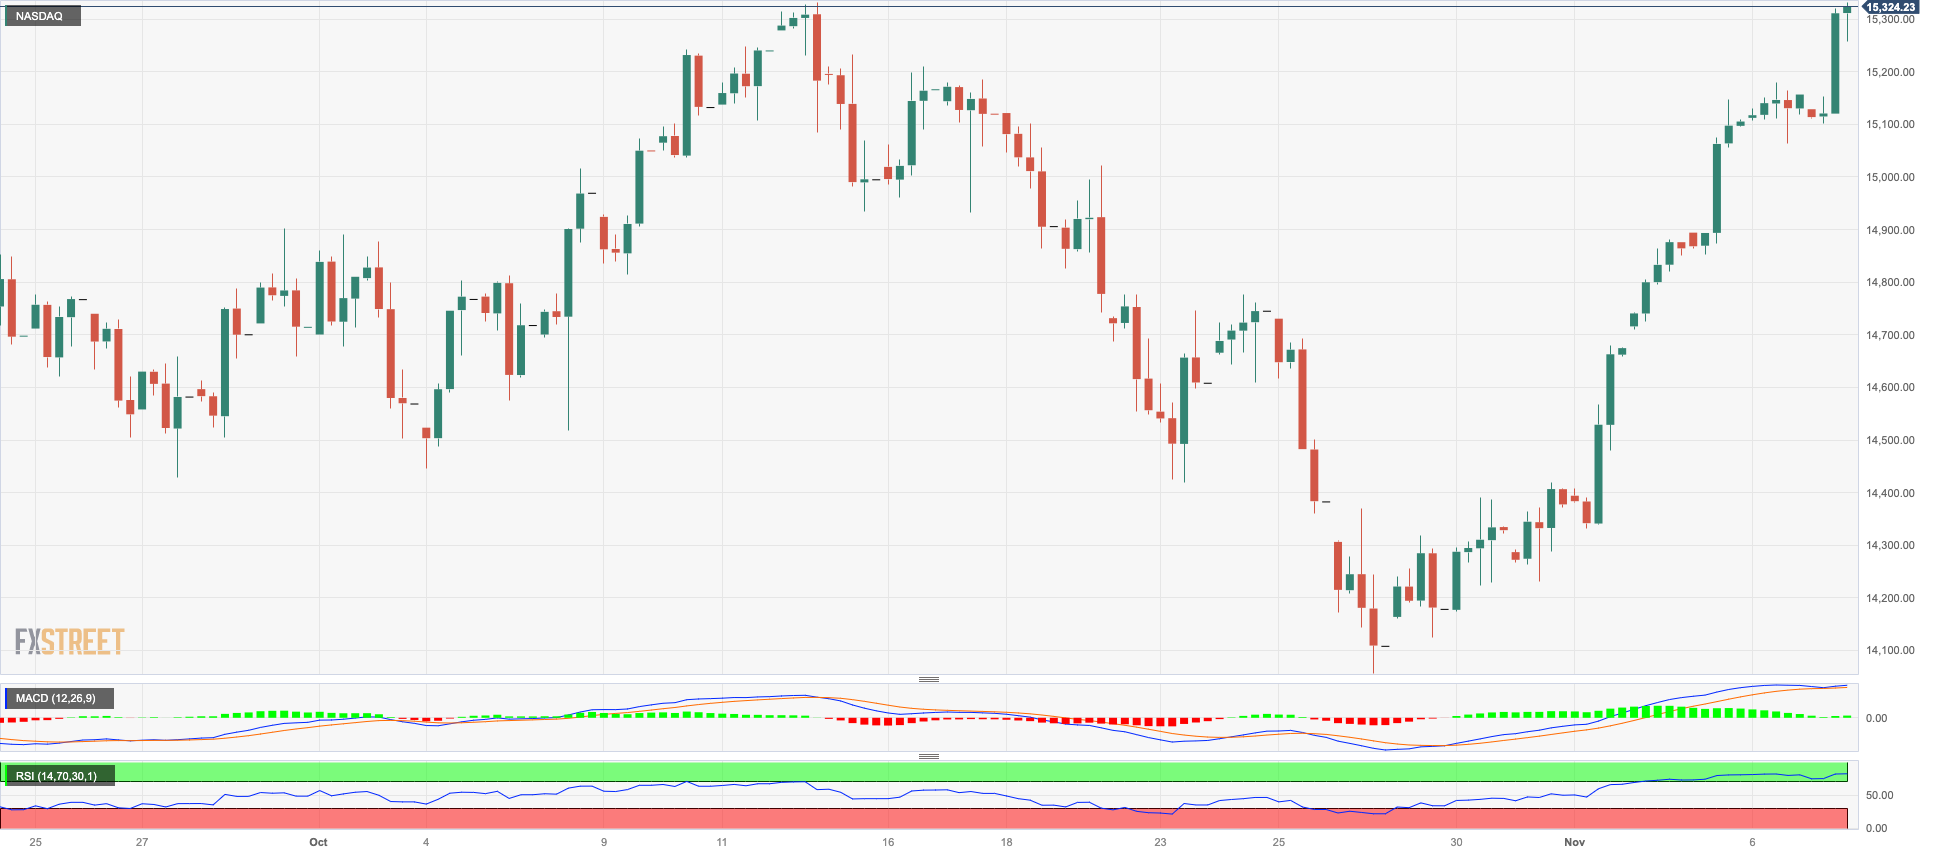
Further upside momentum pushed the tech index Nasdaq 100 to new two-month peaks north of the 15300 level on turnaround Tuesday.
The improved sentiment among traders appears to have been supported by firmer anticipation that the Fed might keep its interest rates unchanged for the foreseeable future, despite some Fed speakers reiterated the view that the Fed has still work to do when it comes to tackling inflation.
The mover higher in the index came despite the pronounced rebound in the greenback and the advance in the 2-year/10-year segment of the US yield curve.
Further gains in the Nasdaq might confront the September high of 15618 (September 1) prior to the YTD top of 15932 (July 19), which precedes the round level of 16000. In contrast, the immediate contention emerges at the October low of 14058 (October 26), which appears reinforced by the key 200-day SMA at 14042. The breach of this region could put a potential visit to the April low of 12724 (April 25) back on the radar prior to the March low of 11695 (March 13) and the 2023 low of 10696 (January 3). The day-to-day RSI rose past the 62 yardstick.
Top Gainers: Datadog, Globalfoundries, Zscaler
Top Losers: Constellation Energy, Baker Hughes, Lucid Group
Resistance levels: 15325 15618 15803 (4H chart)
Support levels: 14058 13520 12724 (4H chart)
DOW JONES
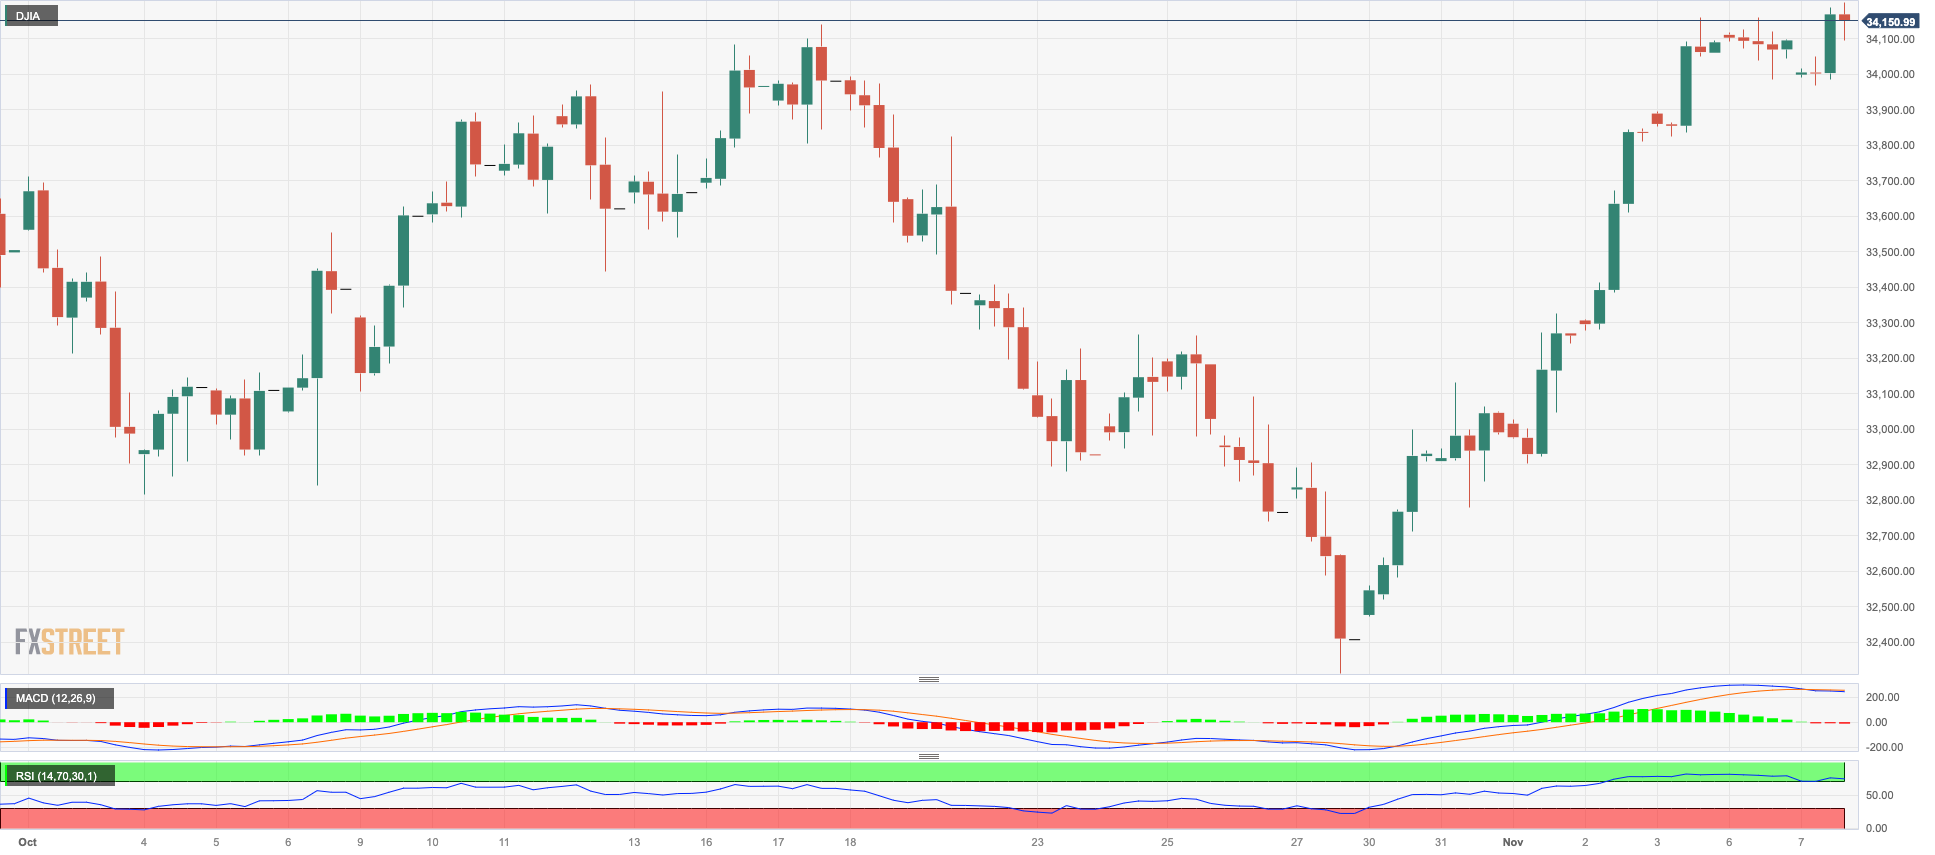
US equities extended the march north on Tuesday, lifting the benchmark Dow Jones to new two-month tops around the 34200 region.
In fact, investors managed to keep the ongoing optimism well and sound for yet another session on the back of rising hopes that the Federal Reserve might have ended its hiking cycle.
In the meantime, some cautiousness is also expected to arise ahead of the slew of Fed speakers due later in the week, including Chair Powell,
All in all, the Dow Jones gained 0.19% to 34159, the S&P500 gained 0.36% to 4381, and the tech-benchmark Nasdaq Composite advanced 1.03% to 13658.
The Dow Jones immediately to the upside is the November high of 34206 (November 7), which is slightly ahead of the intermediate 100-day SMA at 34266 and before the September high of 34977 (September 14). The weekly top of 35070 (August 31) is located to the north, seconded by the 2023 peak of 35679 (August 1). On the downside, the October low of 32327 (October 27) provides immediate support ahead of the 2023 bottom of 31429 (March 15) and the 2022 low of 28660 (October 13). The daily RSI climbed beyond 60.
Top Performers: Salesforce Inc, Intel, Microsoft
Worst Performers: Chevron, Dow, Caterpillar
Resistance levels: 34206 34277 35070 (4H chart)
Support levels: 33410 32327 31429 (4H chart)
MACROECONOMIC EVENTS
All Information & Updates provided by:

All information relating to the financial markets available on this page has been prepared and issued by FXStreet (Forexstreet SL, Spain, Reg: B62498233) on the basis of publicly available information and all information believed to be reliable and does not conflict with Kuwaiti local laws, and all necessary care has been taken to before the company to ensure that the facts mentioned are correct from the source.
NCM Investment nor any of its directors or employees shall in any way be held responsible for the contents of this news, and the information contained on this page is intended only to provide clients with publicly available information and should not be construed as investment advice, report or analysis and/or constitute an offer or invitation to buy or sell financial instruments of any kind.
RISK WARNING: Forex and CFDs are highly risky leveraged products, as losses can exceed deposits. Please ensure you understand all the risks and take independent advice if necessary. NCM will segregate the clients based on the criteria of the regulator and its bylaws. NCM does not provide any advisory service; the material published does not constitute advice or a recommendation for a transaction in any financial instrument. NCM accepts no responsibility for any use of the content presented and any consequences of that use. Anyone acting on the information provided does so at their own risk.