
- Contact Us:
-

-

-

-


Daily Market Updates
09 Nov 2023
USDJPY
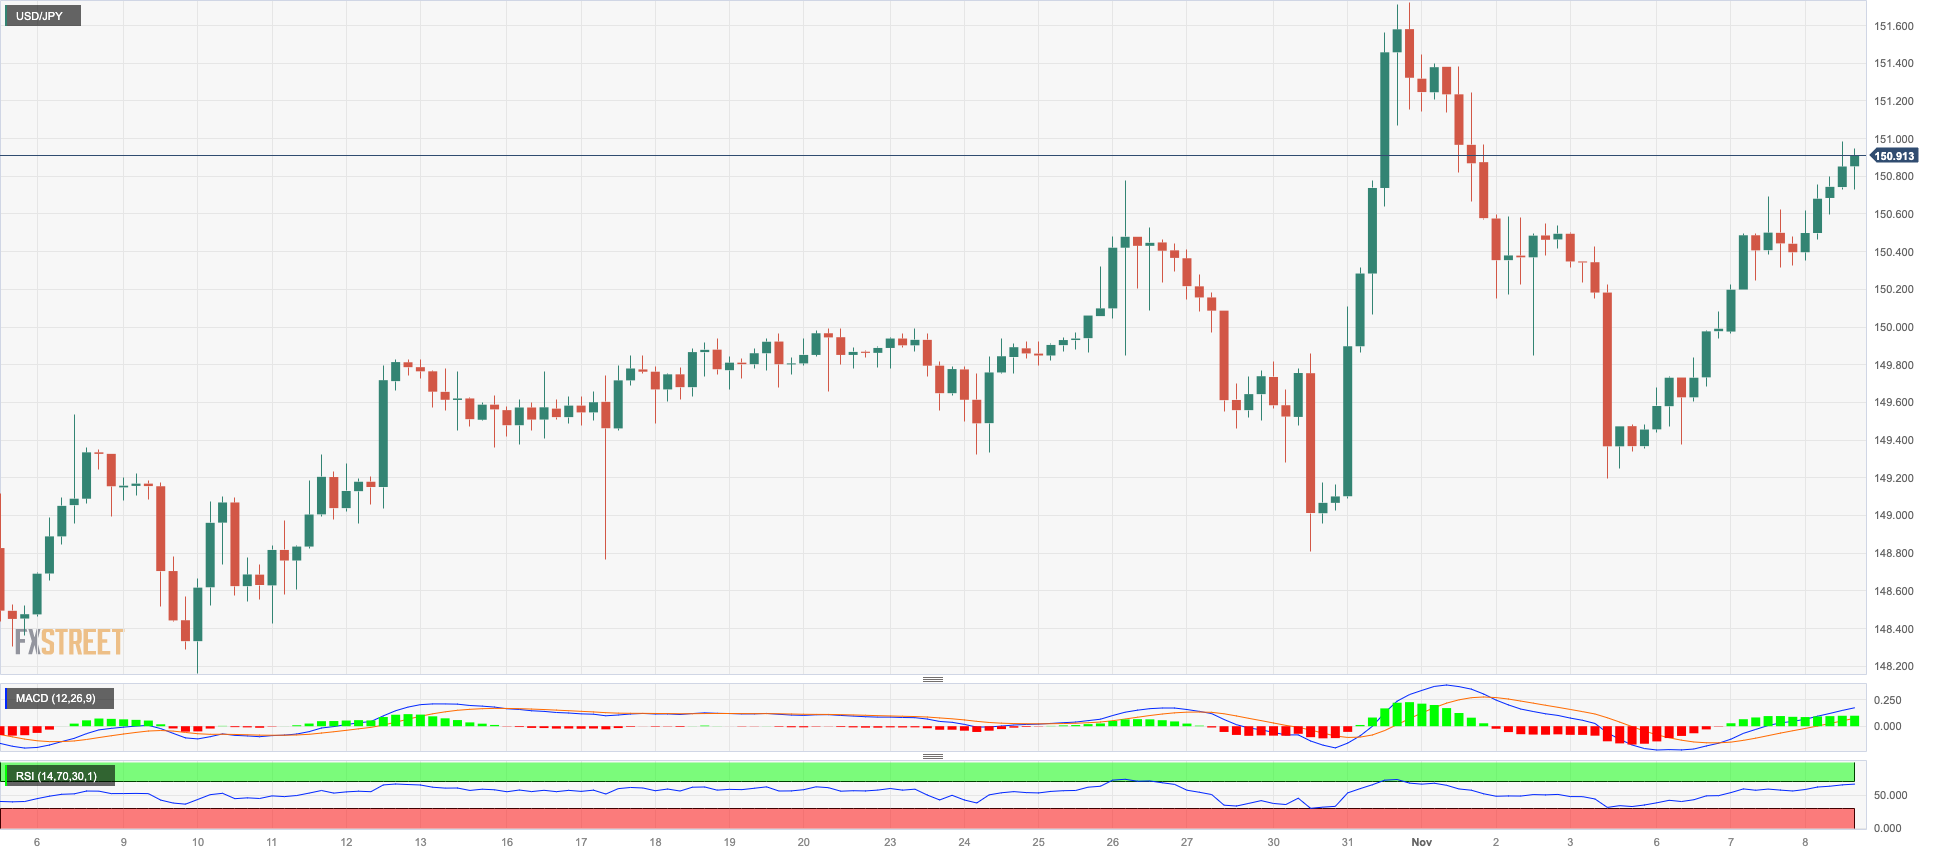
USD/JPY advanced for the third session in a row and approached the key 151.00 barrier, or multi-day tops, on Wednesday.
The continuation of the strong weekly rebound was once again underpinned by extra strength in the greenback coupled with a tepid rebound in the short end of the US yield curve amidst market talks of the resurgence of the Fed’s tighter-for-longer narrative.
Meanwhile, in the Japanese money market, the JGB 10-year yields retreated further to monthly lows around 0.85%.
In the calendar, the Reuters Tankan Index improved to 6 in November, while preliminary readings saw the Coincident Index at 114.7 and the Leading Economic Index at 108.7 for the month of October.
If the USD/JPY crosses the 2023 high of 151.72 (October 31), it might return to the 2022 top of 151.94 (October 21), closely followed by the round level of 152.00. The 55-day SMA, at 148.62, on the other hand, looks to be a transitory support level ahead of the weekly low of 148.16 (October 10), which emerges before the October low of 147.27 (October 3). The weekly low of 145.89 (September 11) seems to be the next level of support, followed by the September low of 144.43 (September 1). Below this zone, there are no significant support levels until the August low of 141.50 (August 7), which is slightly lower than the 200-day SMA of 140.67 and the July low of 137.23 (July 14). The RSI on the daily chart ticked higher past 58.
Resistance levels: 150.98 151.72 151.94 (4H chart)
Support levels: 149.59 149.18 148.80 (4H chart)
GBPUSD
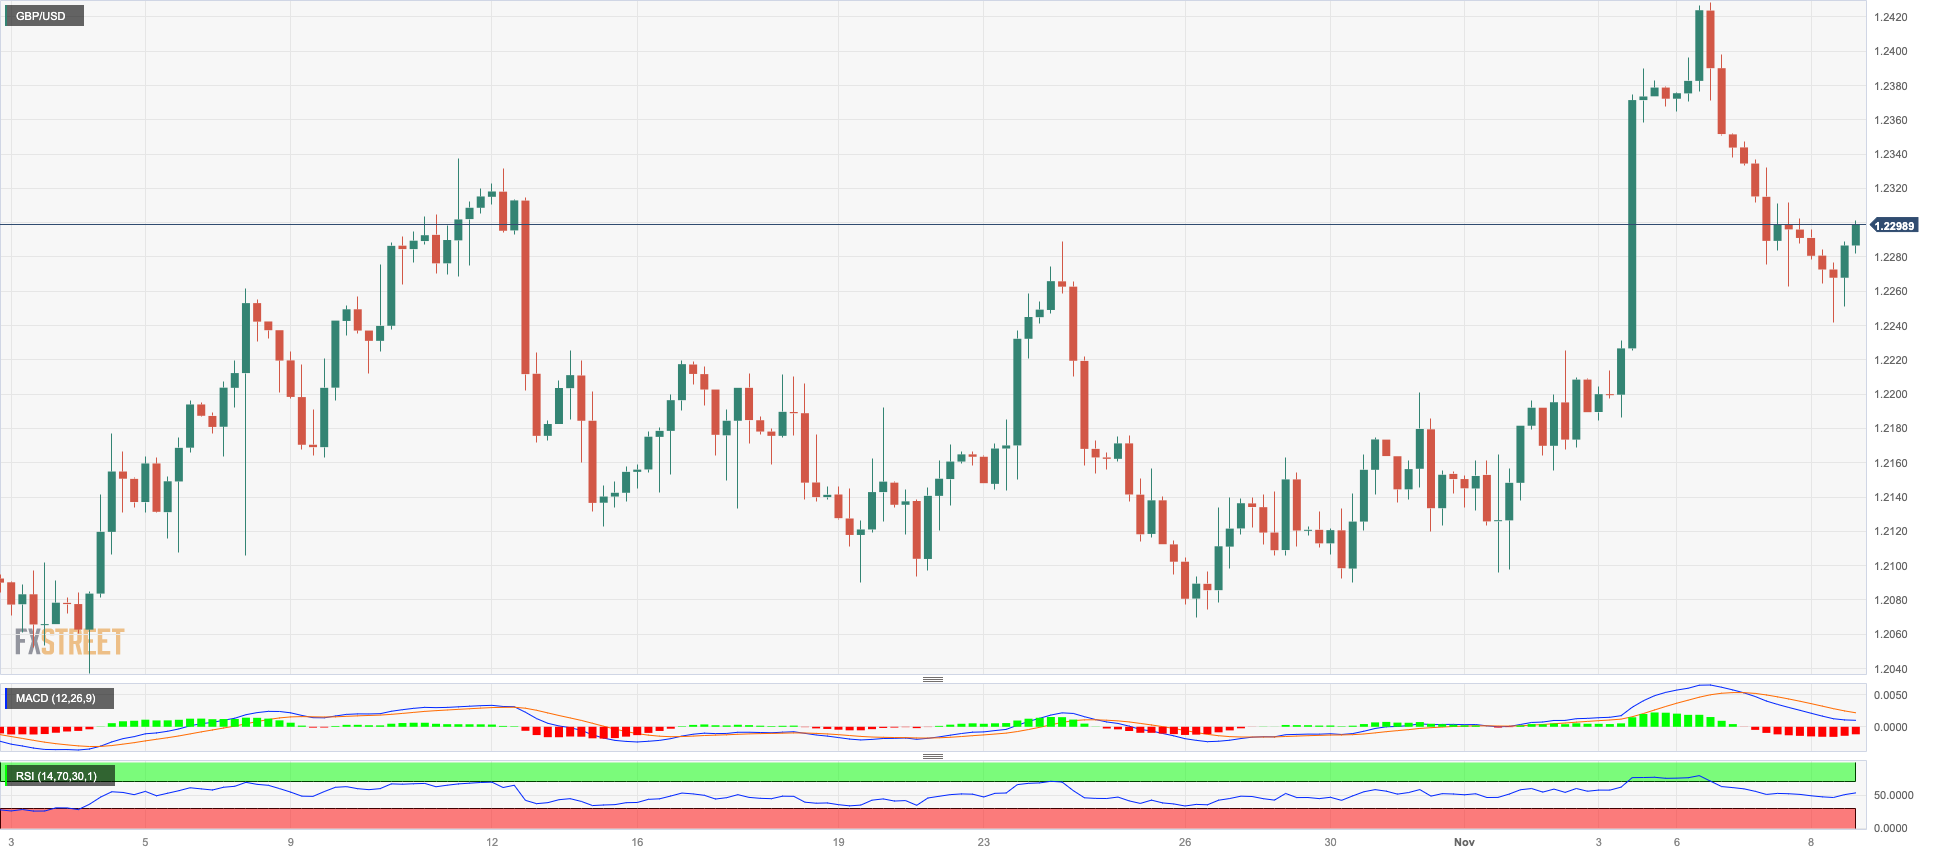
In line with the rest of the risk-linked space, the British pound charted an inconclusive session amidst the equally vacillating mood in the greenback, prompting GBP/USD to bounce off the 1.2240 region and end Wednesday’s session around the 1.2300 zone.
In fact, the dollar’s recovery stalled near the 106.00 region when tracked by the USD Index (DXY), subsequently allowing Cable to regain some composure amidst the tepid improvement in the risk complex.
From the BoE, Governor Bailey showed confidence that the economy could reach the bank’s target in two years' time, at the time when he suggested that the BoE has to keep its restrictive stance for longer and indicated that market chatter about rate cuts is premature.
There were no data releases scheduled in the UK docket on Wednesday.
Further correction in GBP/USD could extend to the weekly low of 1.2069 (October 26) prior to the October low of 1.2037 (October 3), which is just above the crucial 1.2000 barrier and before the 2023 bottom of 1.1802 (March 8). On the contrary, immediate up-barrier is seen at the November high of 1.2428, which appears to be supported by the important 200-day SMA of 1.2432, and it comes ahead of the weekly top of 1.2548 (September 11). Following its removal, weekly peaks should then emerge at 1.2746 (August 30), 1.2818 (August 10), and 1.2995 (July 27), all of which are below the psychological 1.3000 threshold. The day-to-day RSI eased to the proximity of 55.
Resistance levels: 1.2428 1.2548 1.2746 (4H chart)
Support levels: 1.2241 1.2189 1.2095 (4H chart)
AUDUSD
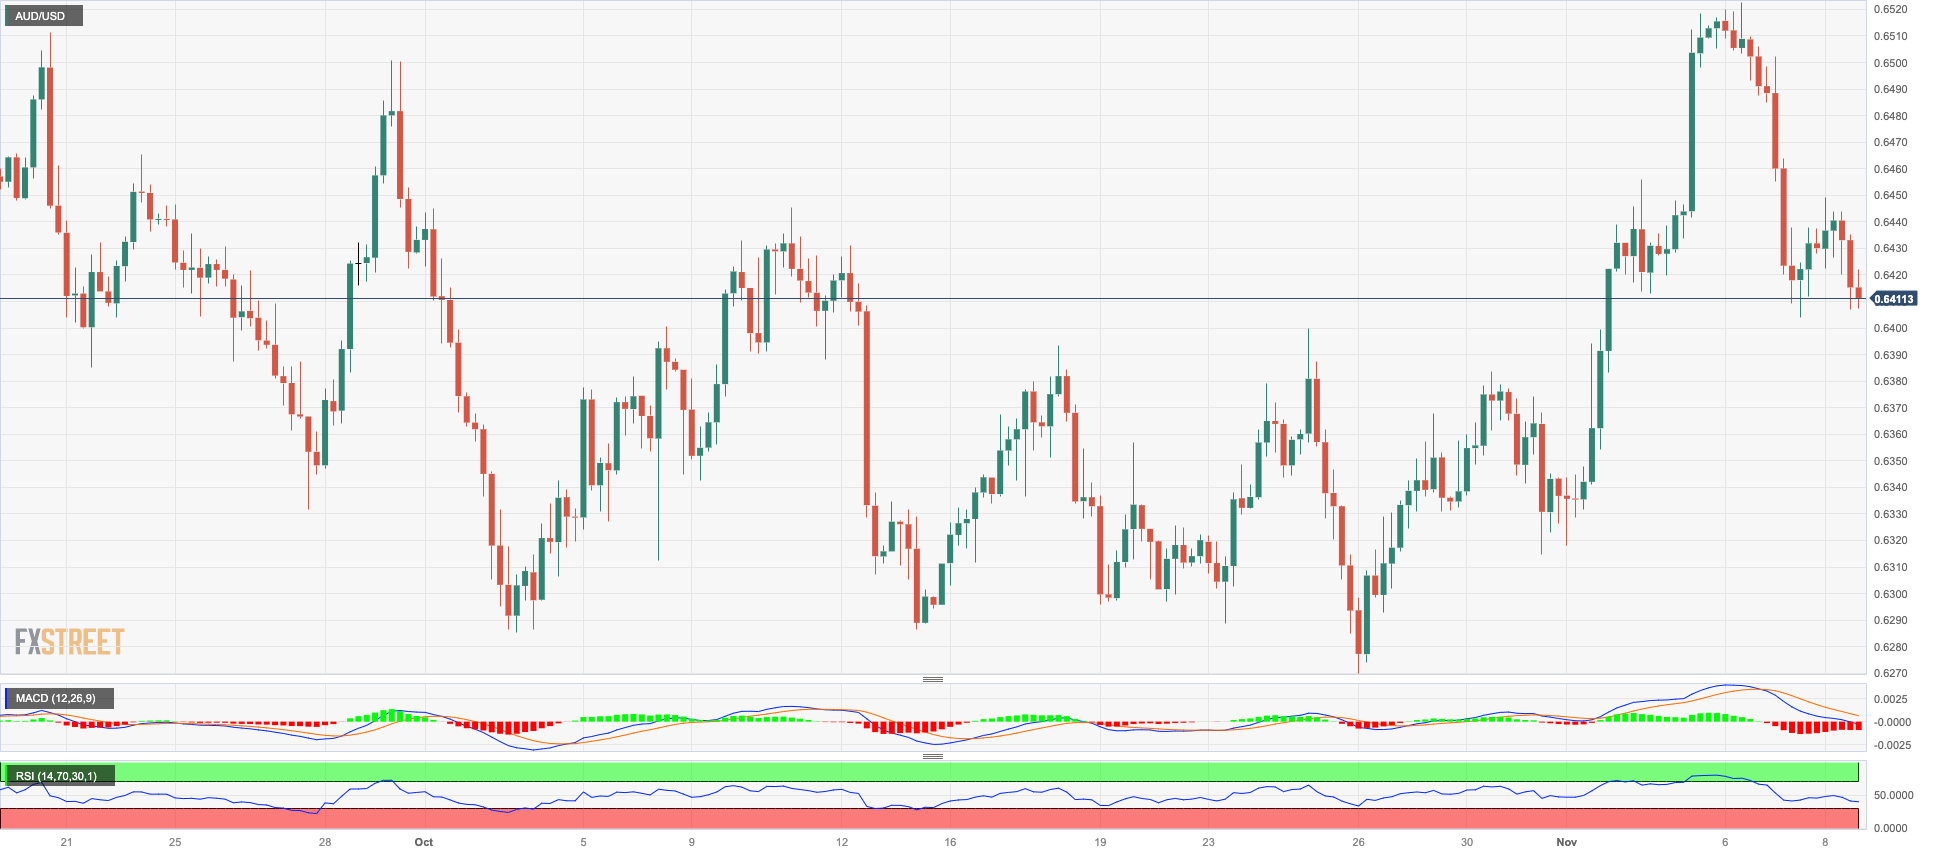
The continuation of the march north in the greenback kept the Aussie dollar under pressure and forced AUD/USD to retreat for the third session in a row on Wednesday, this time briefly retesting the 0.6420 zone.
The daily drop in spot also came in line with the retracement in prices of both copper and iron ore, while investors seem to have continued to digest the recent dovish hike by the RBA and discouraging results from the Chinese docket.
The Australian calendar was empty on Wednesday.
In case sellers extend their dominance, AUD/USD could dispute the interim 55-day SMA at 0.6396 ahead of the 2023 low of 0.6270 (October 26), followed by the round level of 0.6200 and the 2022 low of 0.6169 (October 13). On the contrary, the pair should first test the November high of 0.6522 (November 6), before moving on to the weekly top of 0.6616 (August 10), which remains propped up by the 200-day SMA (0.6610). The July peak of 0.6894 (July 14), the June high of 0.6899 (June 16), and the critical 0.7000 mark are all to the north from here. The daily RSI eased to the 52 zone.
Resistance levels: 0.6522 0.6616 0.6739 (4H chart)
Support levels: 0.6403 0.6376 0.6314 (4H chart)
GOLD
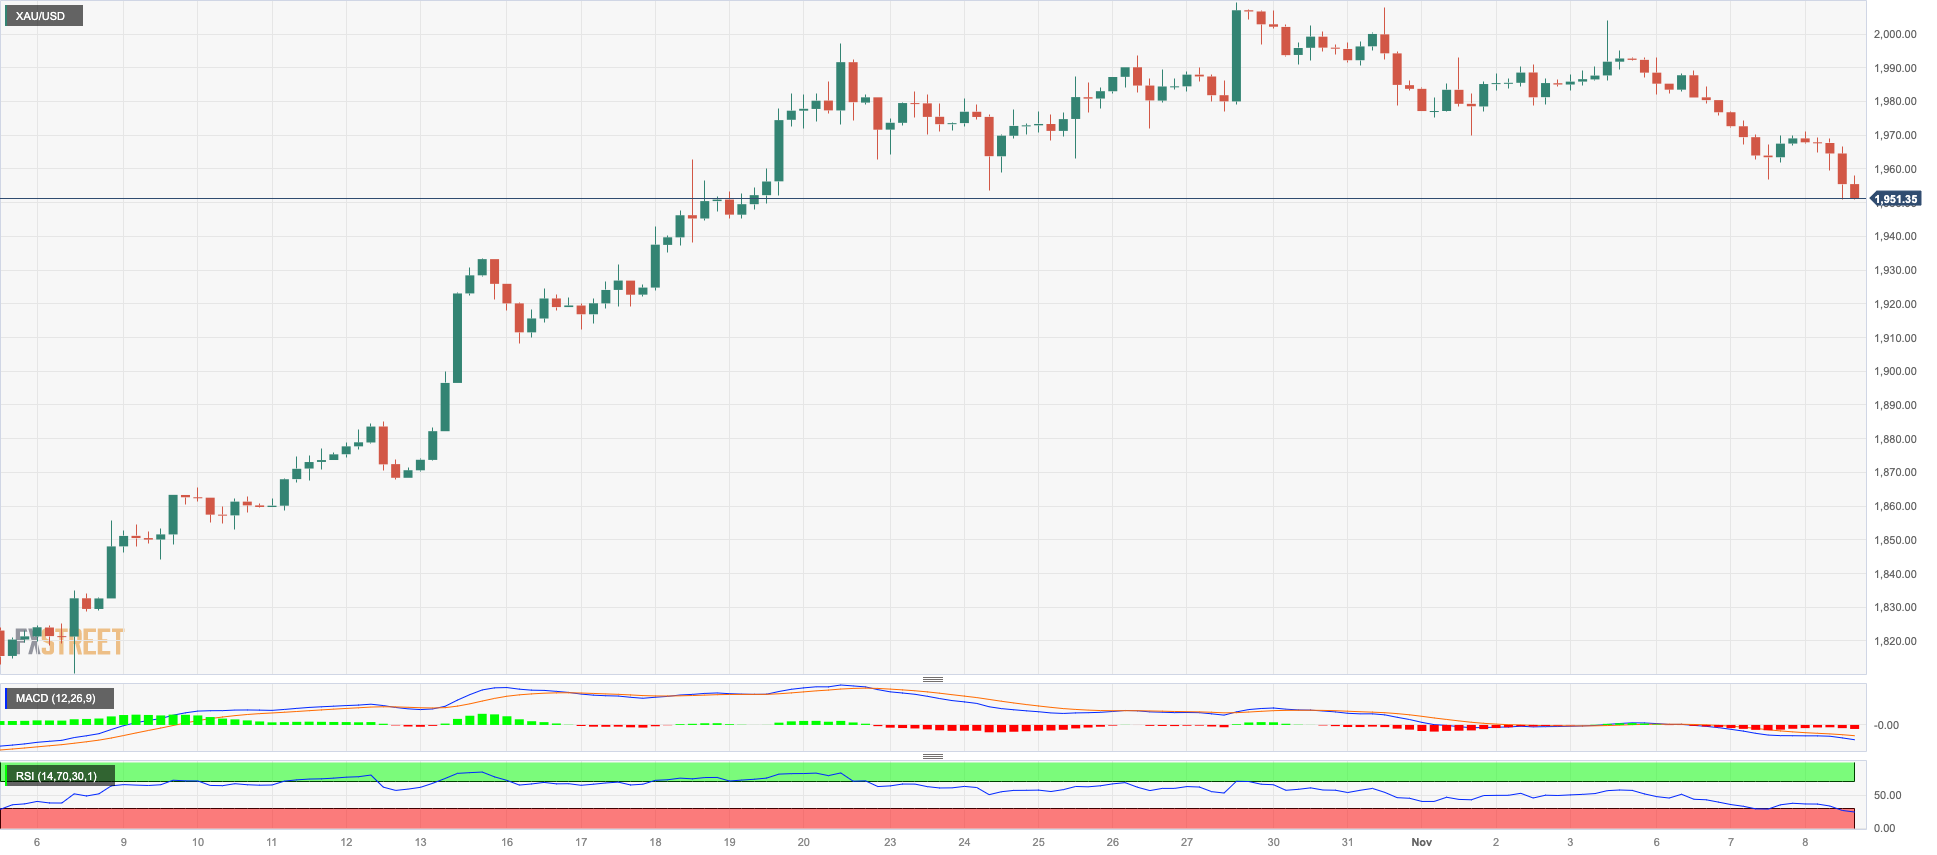
Gold prices retreated further on Wednesday, clinching their third consecutive daily retracement and hitting new three-week lows around $1950 per troy ounce.
The continuation of the bearish mood in the precious metal came despite the greenback giving away almost all of its daily advance towards the end of the NA session, while US yields added to Tuesday’s decline in the belly and the long end of the curve.
Moving forward, markets’ perception that the Fed might be done hiking rates seems to collide with the recent hawkish narrative seen from some Fed speakers, all leaving the prospects for the yellow metal somewhat clouded in the short term.
If selling pressure increases, gold might confront the critical 200-day SMA of $1934 just ahead of the provisional 55-day SMA of $1923. South from here aligns the October low of $1810 (October 6) seconded by the 2023 low of $1804 (February 28), and the $1800 key support zone. On the upside, the immediate up hurdle appears at the October top of $2009 (October 27), seconded by the 2023 peak of $2067 (May 4), and the 2022 high of $2070 (March 8), all preceding the all-time top of $2075 (August 7, 2020).
Resistance levels: $2009 $2022 $2048 (4H chart)
Support levels: $1956 $1953 $1921 (4H chart)
CRUDE WTI
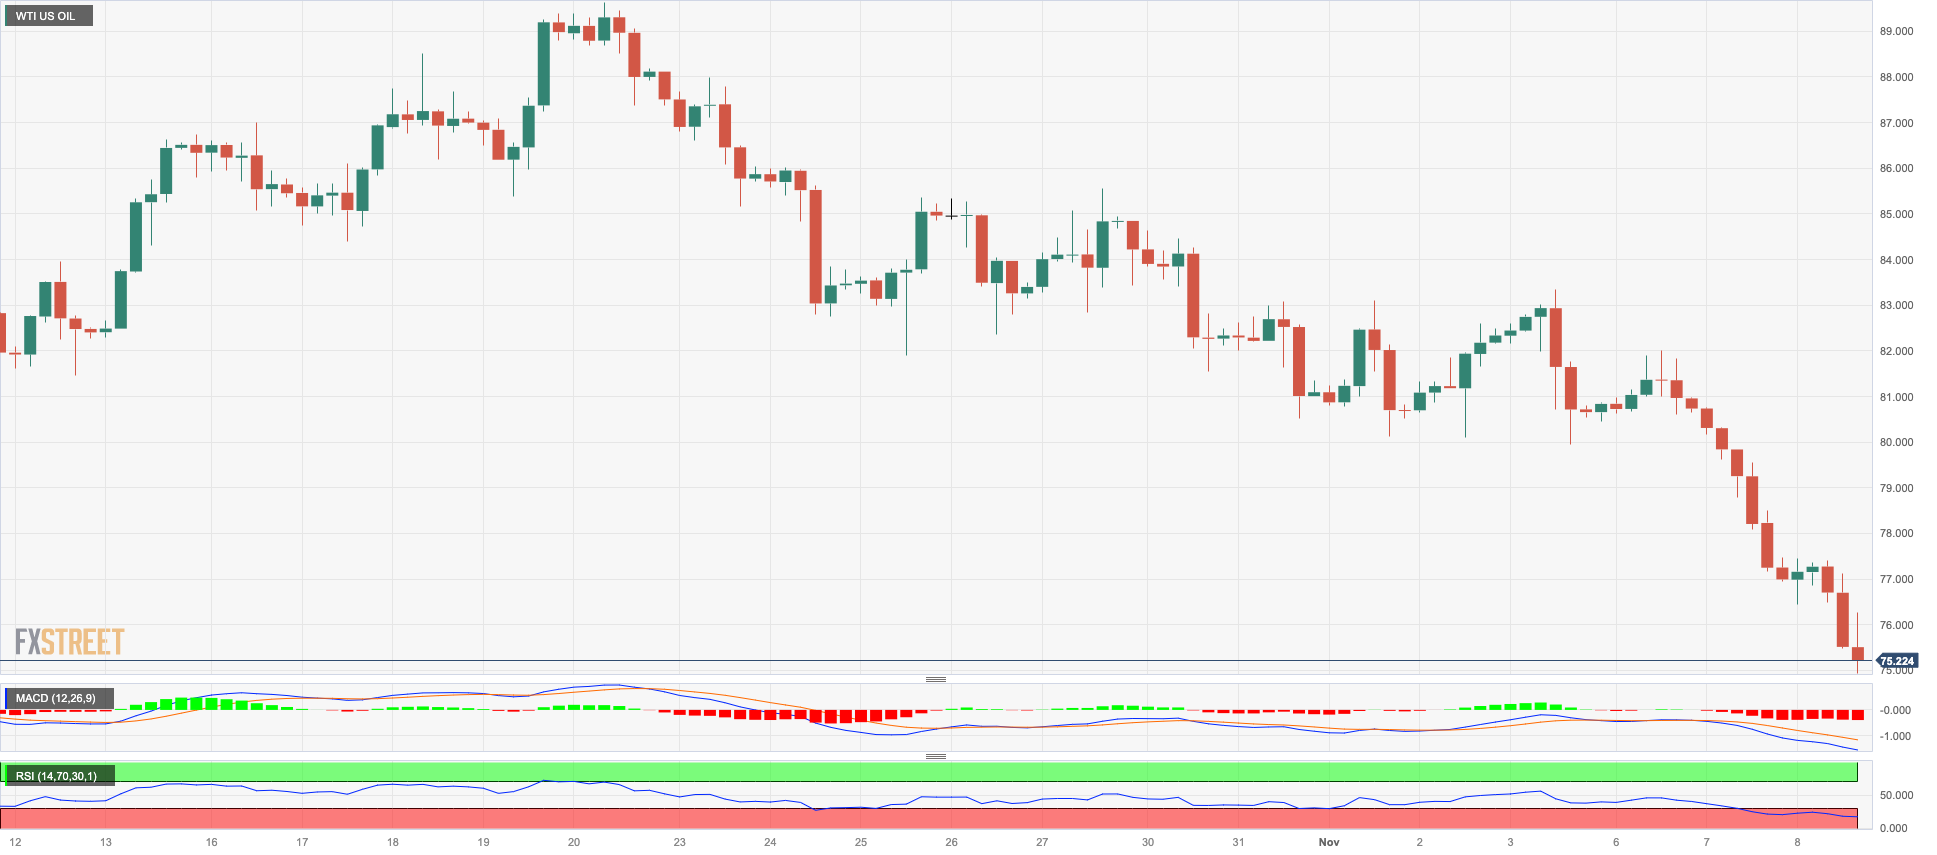
There was no respite for the intense sell-off in WTI prices on Wednesday.
That said, prices of the barrel of the American benchmark for the sweet light crude oil slipped back to levels last seen in mid-July around the $75.00 mark on the back of mounting demand concerns, particularly stemming from China and Europe.
Adding to traders’ worries, recent Fed speakers reignited speculation that the Fed could maintain its tightening stance for longer than initially anticipated, while easing fears that the Middle East crisis could impact supply disruptions, which also collaborated with the decline of the commodity.
WTI may revisit the weekly low of $73.89 (July 17) ahead of the critical $70.00 barrier per barrel if losses continue. The June low of $66.85 (June 12) is further south, before the 2023 low of $63.61 (May 4) and the crucial yardstick of $60.00. Instead, the 200-day SMA at $78.13 precedes the provisional 55-day SMA at $85.80, all ahead of the weekly high of $89.83 (October 18) and the 2023 top of $94.99 (September 28). In addition, the weekly peak of $97.65 (August 30, 2022) is considered as the last line of defense before a possible visit to the psychological $100.00 threshold.
Resistance levels: $83.56 $85.75 $89.82 (4H chart)
Support levels: $75.92 $73.81 $70.18 (4H chart)
GER40
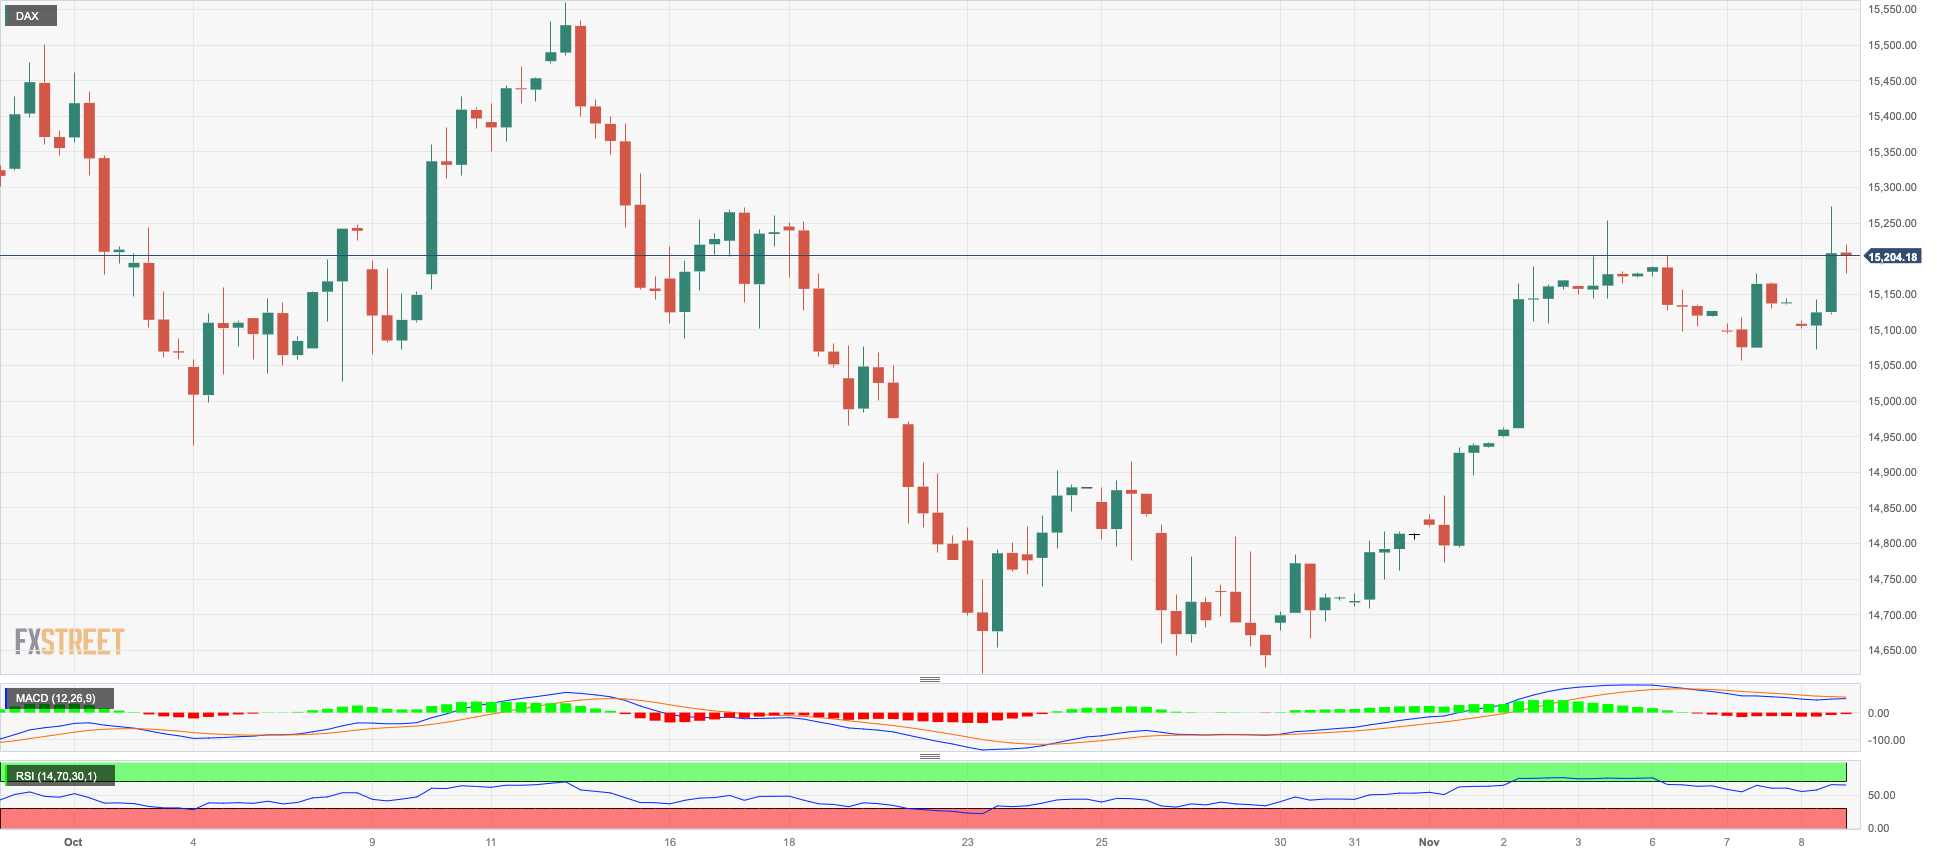
German stocks gauged by the benchmark DAX40 added to Tuesday’s advance and briefly rose to four-week tops near the 15300 region on Wednesday.
The improvement in the index came amidst the generalized improvement in European stock markets despite several ECB’s rate-setters signaled the palpable chance that the central bank could maintain its restrictive stance for longer, in line with the Federal Reserve.
The decent move higher in the DAX40 came in contrast to further weakness in the German 10-year bund yields, which retreated to levels last seen in mid-September around 2.60%.
Immediately to the upside for the DAX40 appears the November high of 15287 (November 8), followed by the October top of 15575 (October 12), and the critical 200-day SMA of 15642. Once the latter is cleared, the index may reach the September peak of 15989 (September 15), prior to the weekly highs of 16042 (August 31) and 16060 (August 10). If this zone is surpassed, the index might strive for its all-time high of 16528 (July 31). The resumption of the selling pressure might drag the index to the October low of 14630 (October 23), before the March low of 14458 (March 20). Further down comes the December 2022 low of 13791 (December 20) ahead of the 2022 bottom of 11862 (September 28). The day-to-day RSI rose to the 55 zone.
Best Performers: Continental AG, Deutsche Post, Heidelbergcement
Worst Performers: Zalando SE, Siemens Energy AG, Vonovia
Resistance levels: 15287 15575 15989 (4H chart)
Support levels: 14985 14630 14458 (4H chart)
NASDAQ
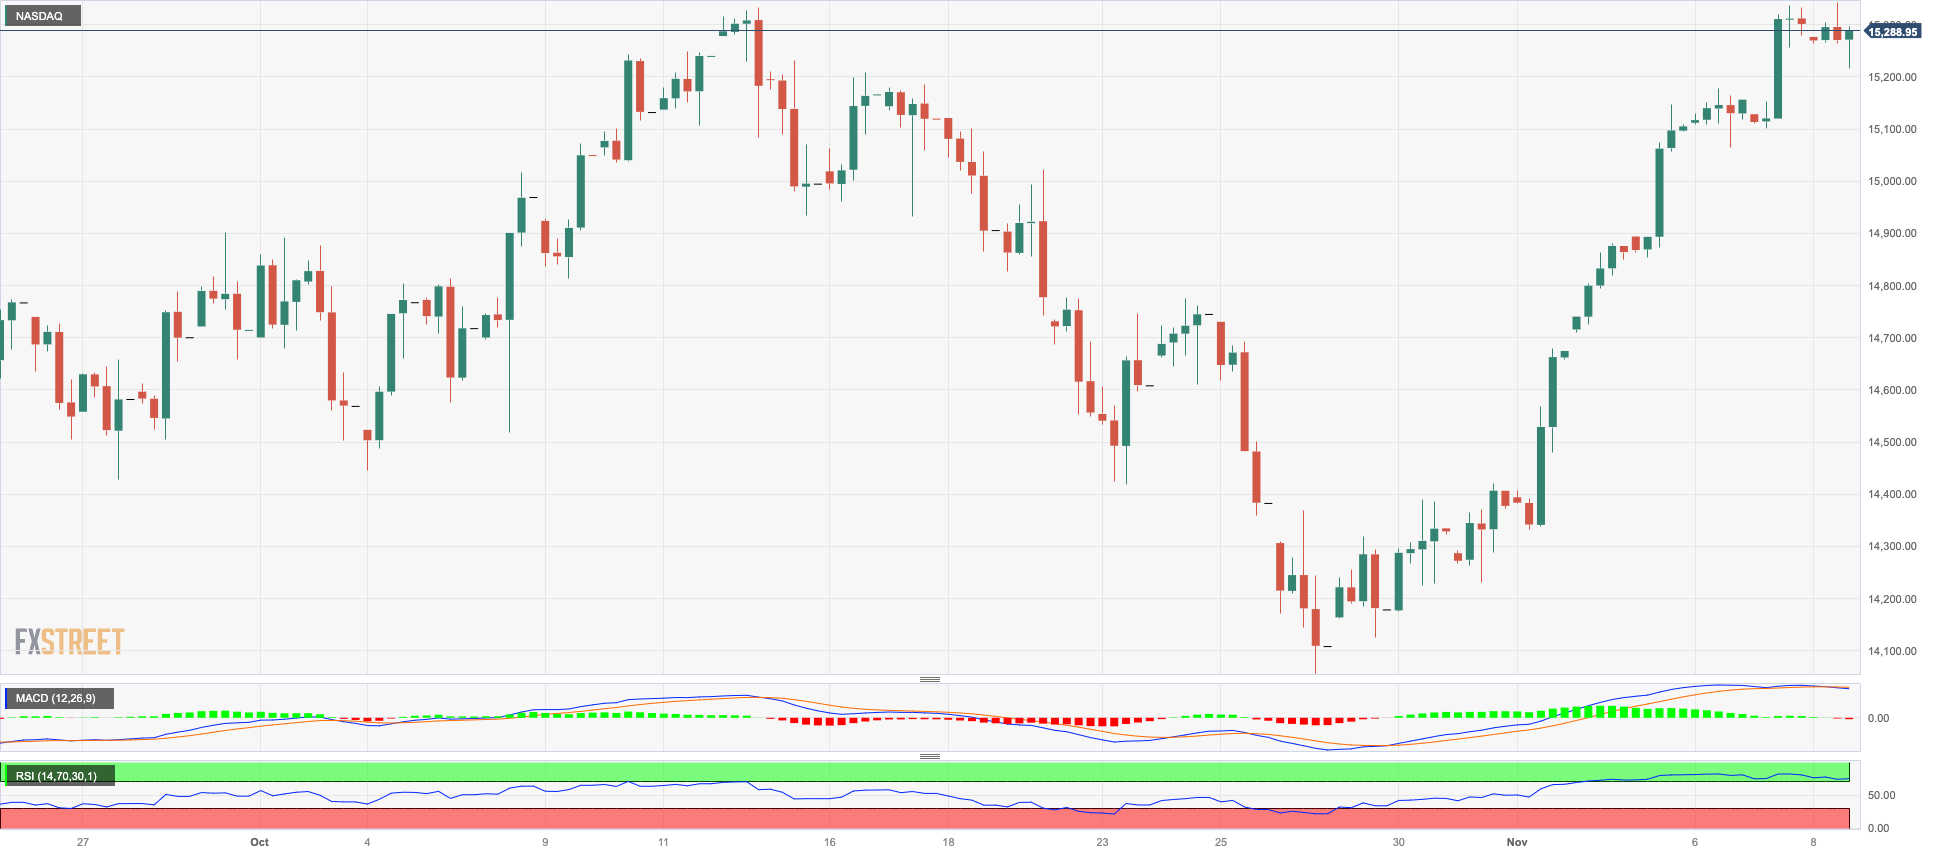
The tech index Nasdaq 100 retreated modestly for the first time after eight consecutive daily advances on Wednesday.
The move lower in tech equities came almost exclusively in response to the re-emergence of concerns regarding the idea that the Fed might keep its current restrictive stance for a longer period in order to bring inflation down to the Fed’s target, all bolstered at the same time by the noticeable resilience of the US economy.
In addition, marginal gains in the greenback as well as the small uptick in the short end of the US yield curve also appear to have added extra pressure to the index midweek.
Further increases in the Nasdaq might come up against the September high of 15618 (September 1), which comes before the 2023 top of 15932 (July 19), and the round level of 16000. Having said that, the immediate contention appears at the October low of 14058 (October 26), which remains strengthened by the crucial 200-day SMA at 14059. The breakdown of this zone might reintroduce a visit to the April low of 12724 (April 25) prior to the March low of 11695 (March 13) and the 2023 low of 10696 (January 3). The RSI for the day receded to the vicinity of 61.
Top Gainers: Fortinet, Zscaler, ANSYS
Top Losers: Warner Bros Discovery, Lucid Group, Biogen
Resistance levels: 15343 15618 15803 (4H chart)
Support levels: 15090 14058 13520 (4H chart)
DOW JONES
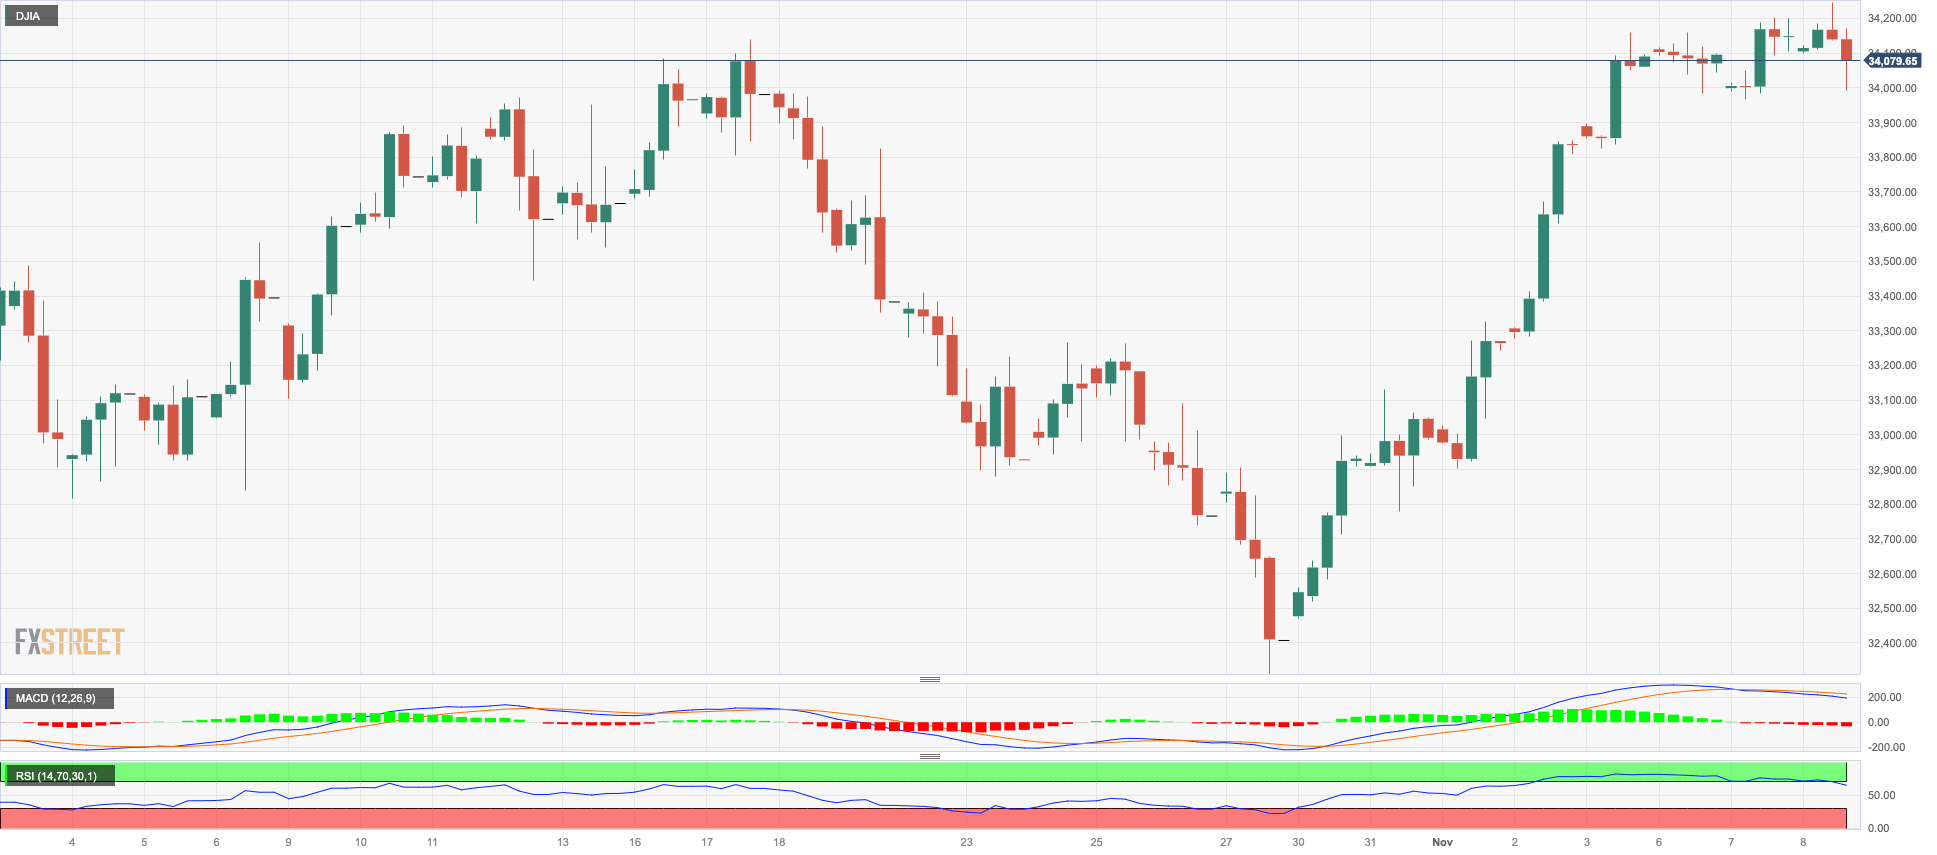
US stocks tracked by the Dow Jones saw their multi-day positive streak trimmed on Wednesday, although the index managed well to keep the trade just above the 34000 yardstick.
In fact, some profit-taking sentiment seems to have prevailed among investors in light of the recent strong advance in the Dow, while the resurgence of market chatter pointing to the likelihood that the Fed could extend its current restrictive stance for longer also collaborated with the knee-jerk.
Overall, the Dow Jones retreated 0.28% to 34058, the S&P500 dropped 0.12% to 4372, and the tech-focused Nasdaq Composite deflated 0.14% to 13620.
The November high of 34252 (November 8) is immediately to the upside for the Dow Jones, which appears underpinned by the intermediate 100-day SMA at 34263 and comes before the September top of 34977 (September 14). To the north is the weekly peak of 35070 (August 31), followed by the 2023 high of 35679 (August 1). On the downside, the October low of 32327 (October 27) provides immediate support ahead of the 2023 bottom of 31429 (March 15) and the 2022 low of 28660 (October 13). The daily RSI returned to the sub-58 area.
Top Performers: Microsoft, Amgen, Caterpillar
Worst Performers: Walgreen Boots, Intel, 3M
Resistance levels: 34252 34274 35070 (4H chart)
Support levels: 33431 32327 31429 (4H chart)
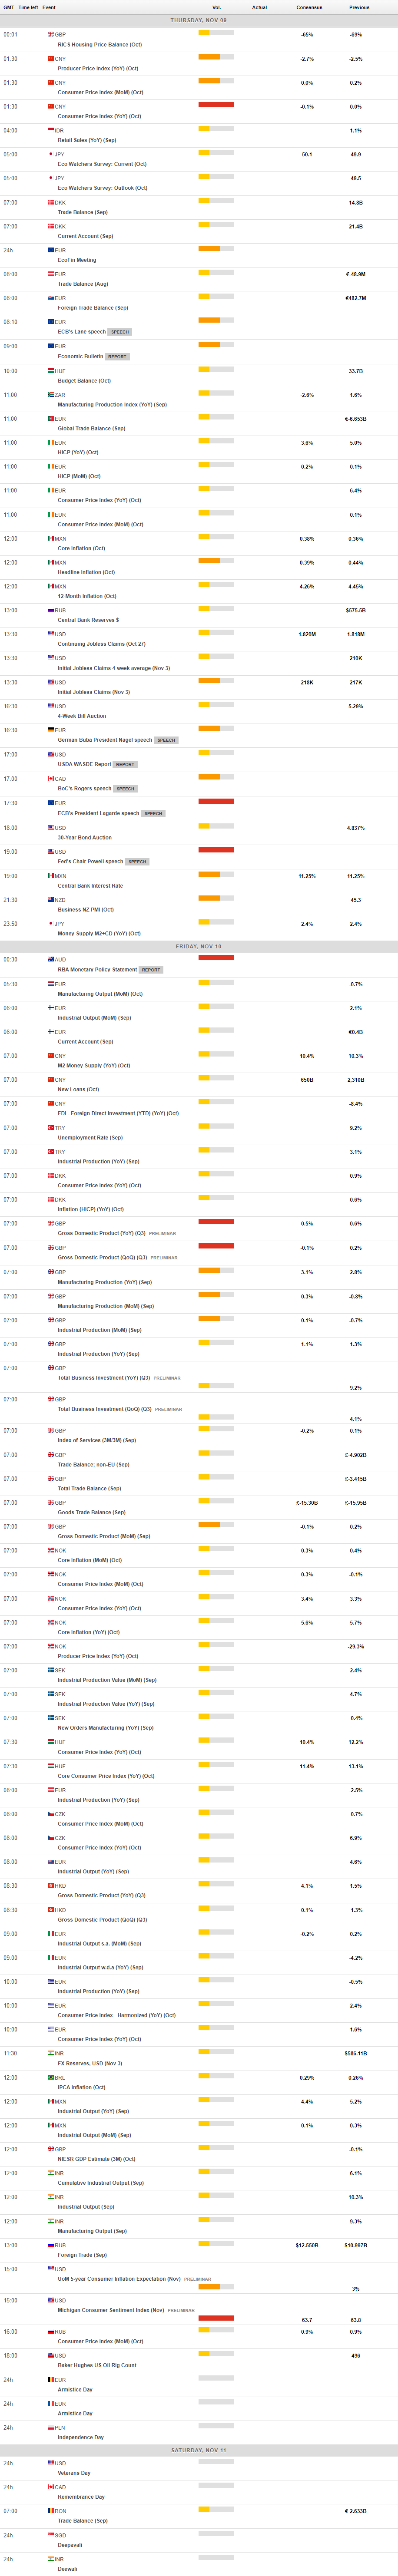
MACROECONOMIC EVENTS
All Information & Updates provided by:

All information relating to the financial markets available on this page has been prepared and issued by FXStreet (Forexstreet SL, Spain, Reg: B62498233) on the basis of publicly available information and all information believed to be reliable and does not conflict with Kuwaiti local laws, and all necessary care has been taken to before the company to ensure that the facts mentioned are correct from the source.
NCM Investment nor any of its directors or employees shall in any way be held responsible for the contents of this news, and the information contained on this page is intended only to provide clients with publicly available information and should not be construed as investment advice, report or analysis and/or constitute an offer or invitation to buy or sell financial instruments of any kind.
RISK WARNING: Forex and CFDs are highly risky leveraged products, as losses can exceed deposits. Please ensure you understand all the risks and take independent advice if necessary. NCM will segregate the clients based on the criteria of the regulator and its bylaws. NCM does not provide any advisory service; the material published does not constitute advice or a recommendation for a transaction in any financial instrument. NCM accepts no responsibility for any use of the content presented and any consequences of that use. Anyone acting on the information provided does so at their own risk.