
- Contact Us:
-

-

-

-


Daily Market Updates
10 Nov 2023
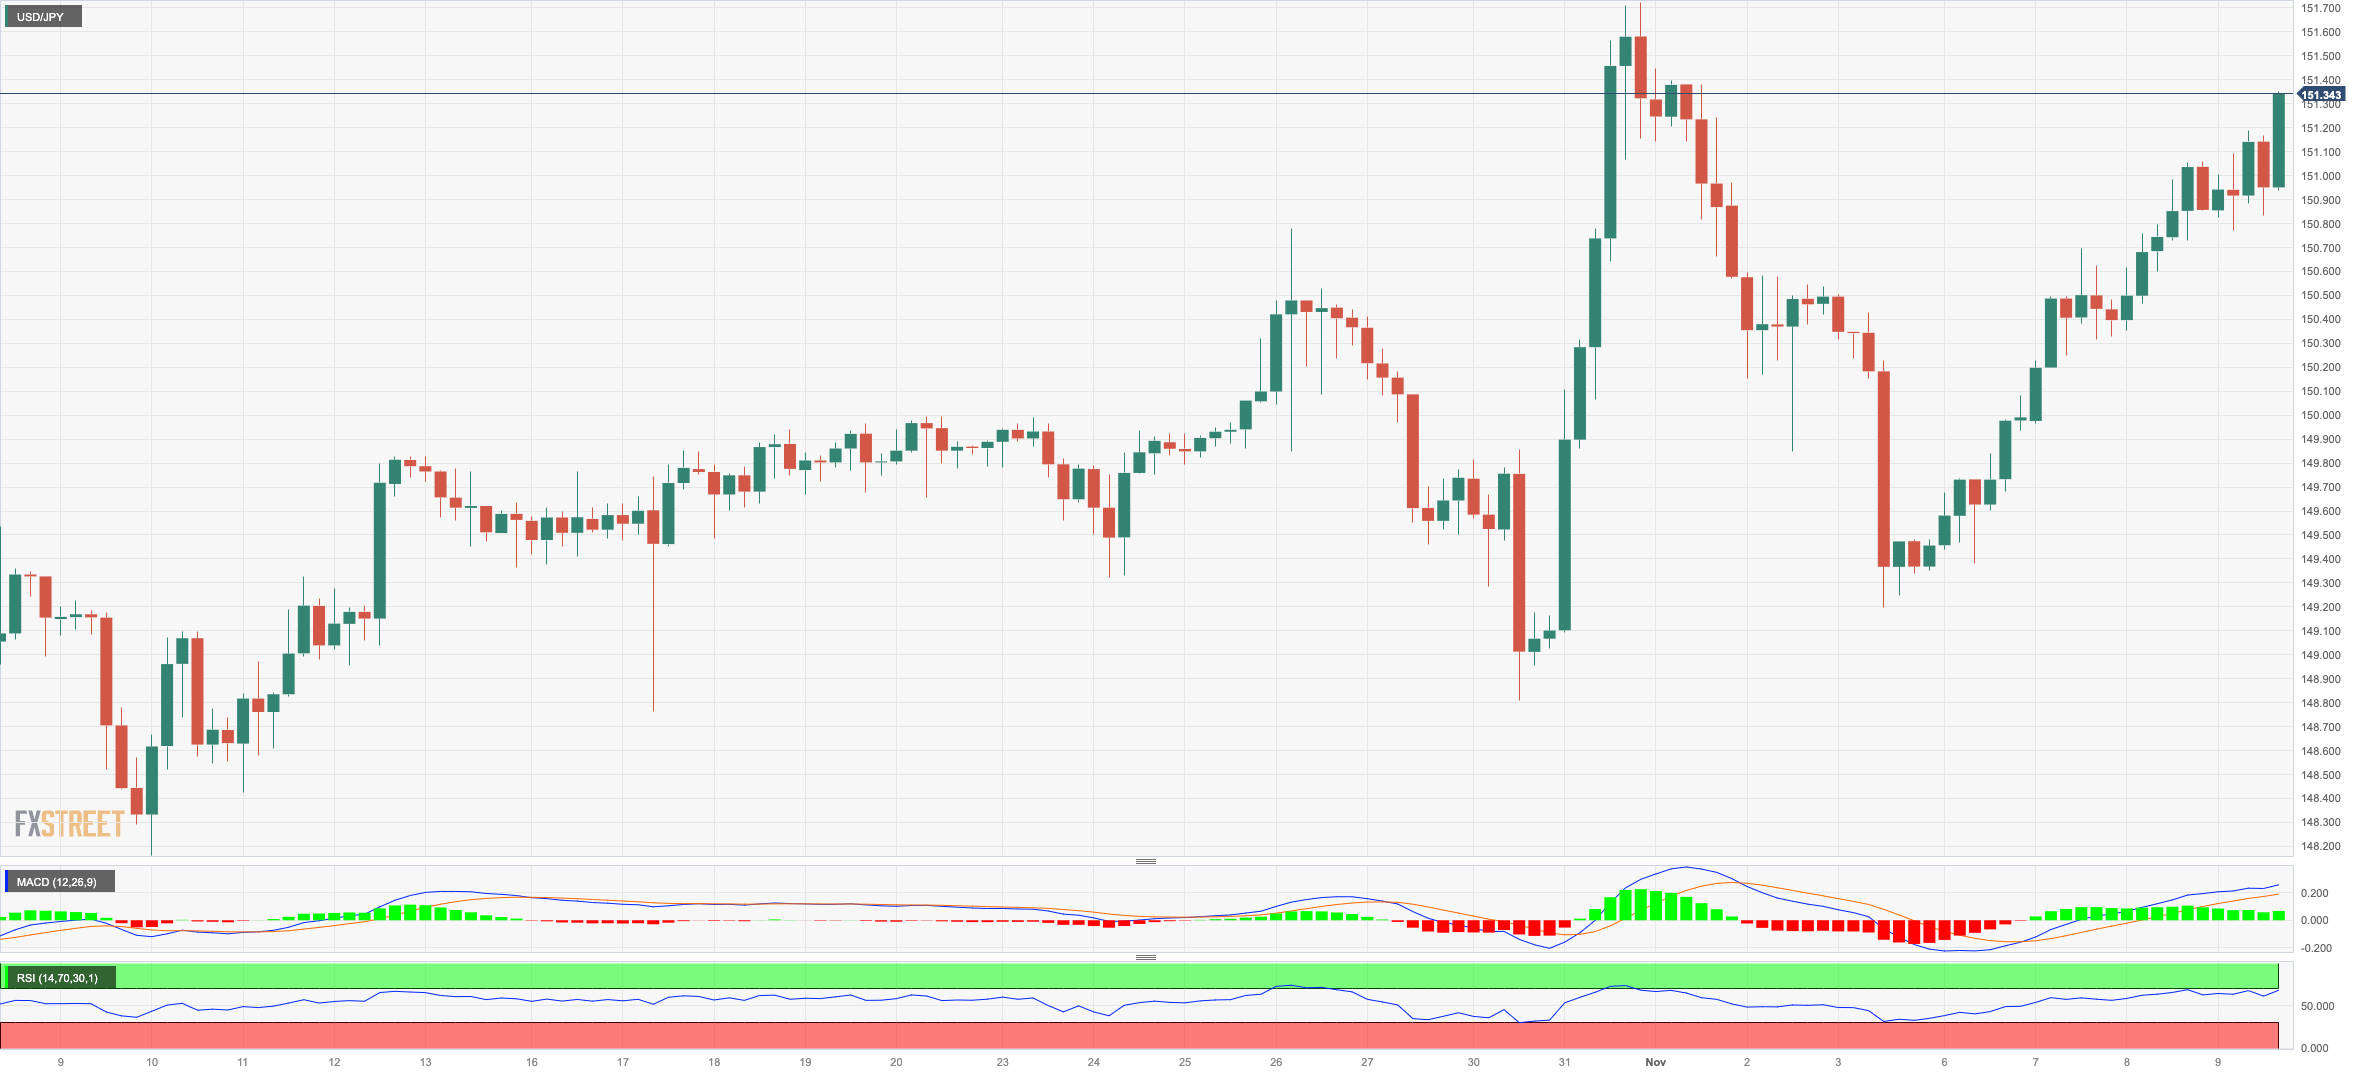
USDJPY
The weekly recovery in USD/JPY remained unabated for yet another session after the pair surpassed the 151.00 barrier to print multi-day highs on Thursday.
The firm advance in the greenback, coupled with rising US yields across different maturities, contributed to the upside bias in spot. In the Japanese money market, JGB 10-year yields extended the drop to the area below 0.85%.
In the docket, the BoJ published its Summary of Opinions from last week’s meeting. Given the increasing number of board members openly discussing the normalization of policy, it appears evident that the BoJ is seriously considering the possibility of discontinuing negative interest rates in the upcoming year.
Additional releases saw Foreign Bond Investment shrank by ¥388.4B in the week to November 4, while Bank Lending expanded 2.8% in the year to October. Additionally, the Eco Watchers Survey Current eased to 49.5 and the Eco Watchers Survey Outlook receded to 48.4, both prints for the month of October.
If the USD/JPY reaches the 2023 top of 151.72 (October 31), it might then dispute the 2022 peak of 151.94 (October 21), which would be quickly followed by the round level of 152.00. In contrast, the 55-day SMA, at 148.72, appears to be a temporary support level ahead of the weekly low of 148.16 (October 10) and the October low of 147.27 (October 3). Further south comes the weekly low of 145.89 (September 11), followed by the September low of 144.43 (September 1). There are no substantial support levels below the latter until the August low of 141.50 (August 7) prior to the 200-day SMA of 140.78 and the July low of 137.23 (July 14). The RSI on the daily chart climbed past 60.
Resistance levels: 151.31 151.72 151.94 (4H chart)
Support levels: 149.67 149.18 148.80 (4H chart)
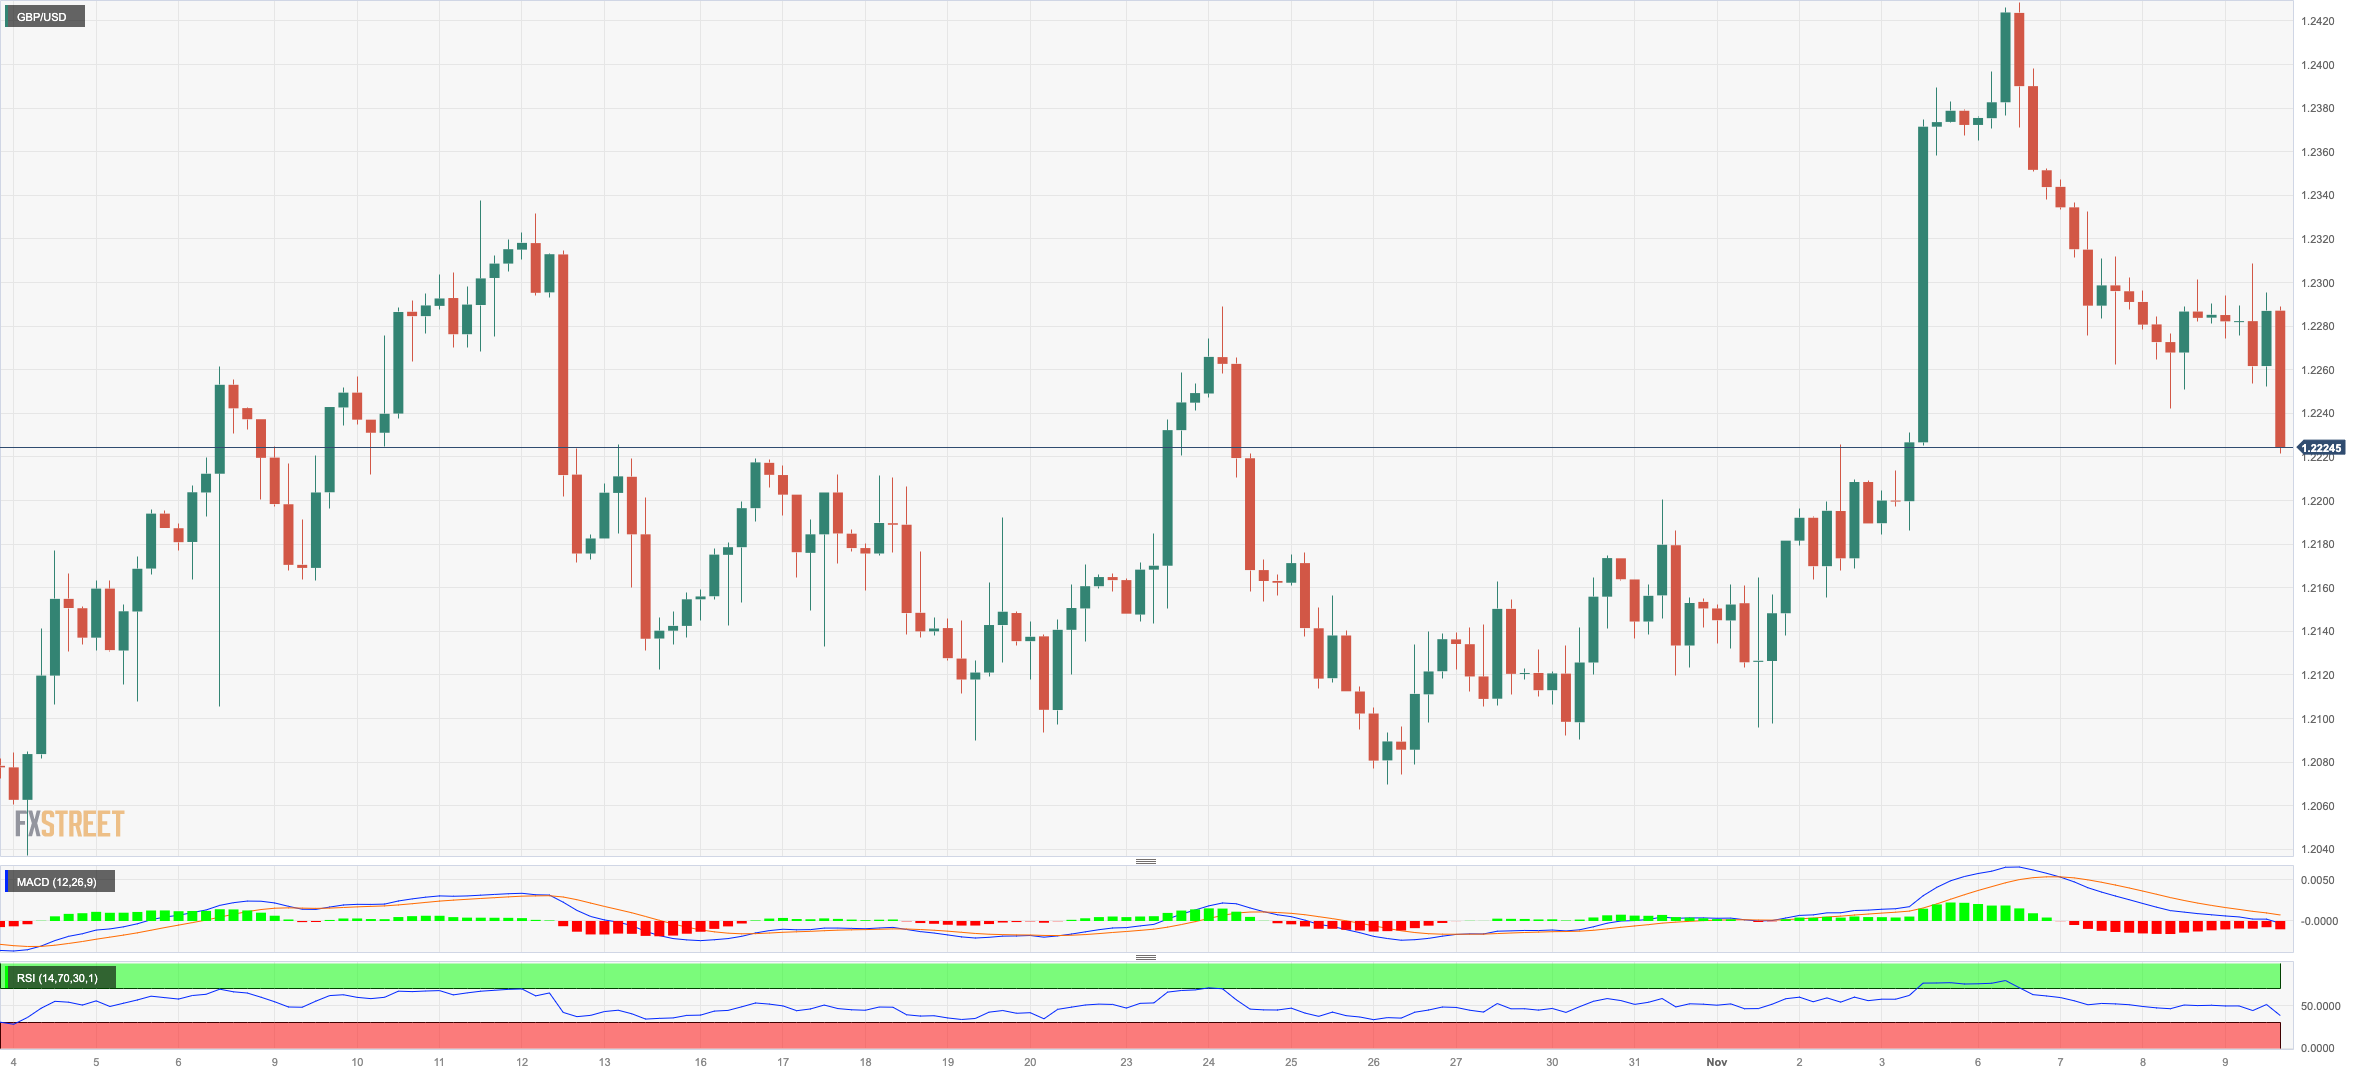
GBPUSD
Once again, extra gains in the dollar sponsored the fourth consecutive daily pullback in GBP/USD, which this time dropped to four-day lows near 1.2230 on Thursday.
That said, Cable navigated the area of weekly lows amidst the continuation of the upward bias in the US dollar, which was at the same time underpinned by the resumption of the upside momentum in US yields across the curve.
From the BoE, Chief Economist H. Pill stated that the bank does not need to raise rates to bear down on inflation, explaining that developments in the real economy are weaker than forecast and indicating that the supply capacity of the UK economy appears to be waning.
In the UK, RICS House Price Balance dropped 63% in October.
GBP/USD might fall further to the weekly low of 1.2069 (October 26) before the October low of 1.2037 (October 3), which is just above the important 1.2000 barrier and before the 2023 bottom of 1.1802 (March 8). On the contrary, the November high of 1.2428 looks to be supported by the significant 200-day SMA of 1.2433, and it comes ahead of the weekly top of 1.2548 (September 11). Once the latter is cleared, weekly peaks of 1.2746 (August 30), 1.2818 (August 10), and 1.2995 (July 27) should emerge, all of which come ahead of the psychological 1.3000 level. The day-to-day RSI dropped below the 50 threshold.
Resistance levels: 1.2428 1.2548 1.2746 (4H chart)
Support levels: 1.2241 1.2191 1.2095 (4H chart)
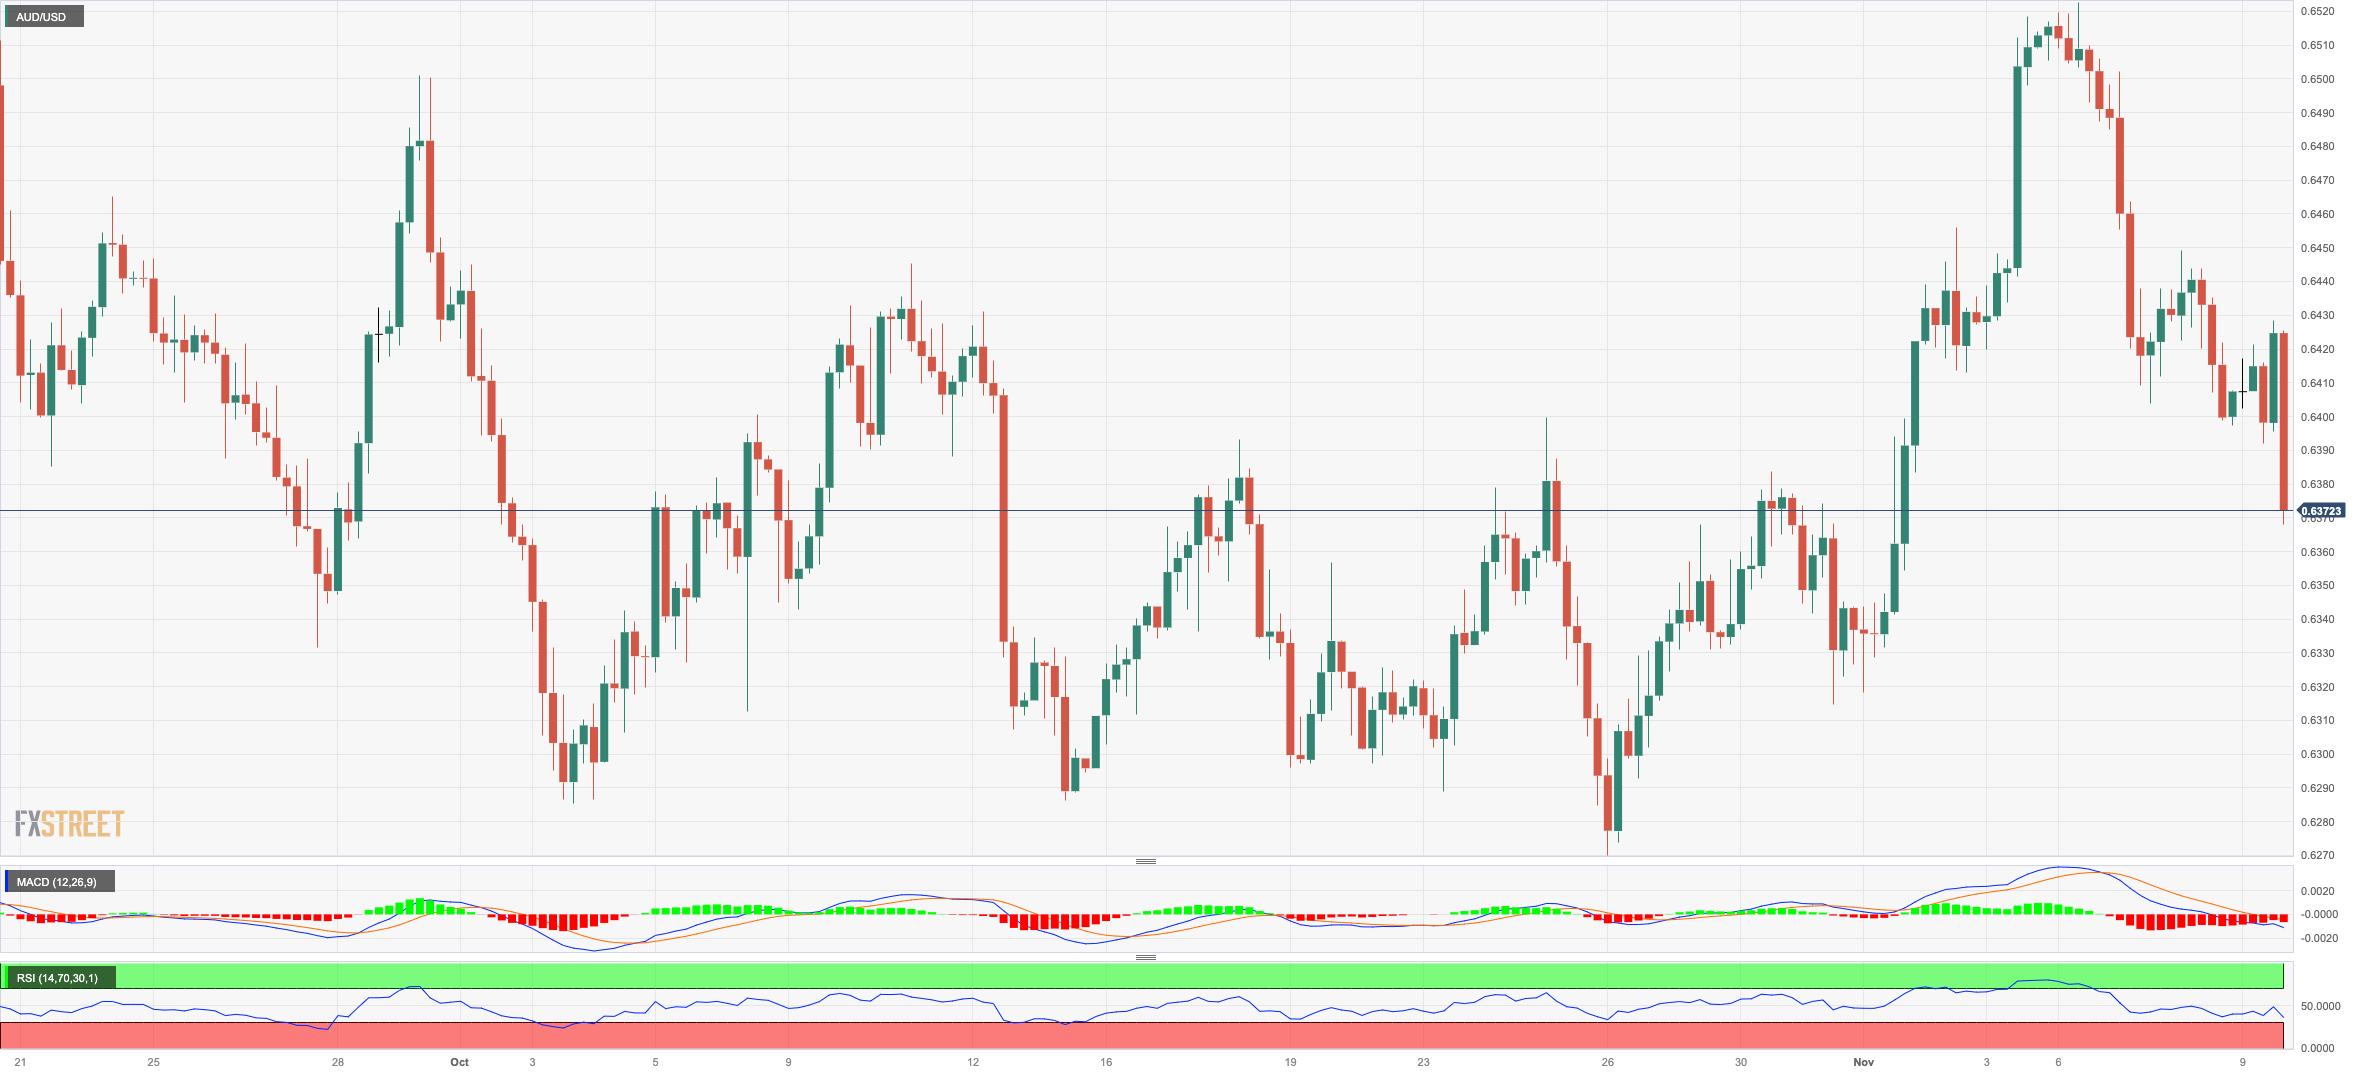
AUDUSD
There was no respite for the Aussie dollar on Thursday, as AUD/USD retreated to multi-session lows around 0.6370 on the back of the Powell-driven rebound in the greenback.
In fact, the par succumbed to the sharp bounce the US dollar and regained extra downside traction helped by the daily pullback in copper prices, while prices of the tonne of iron ore climbed to levels last seen in late March past the $127.00 mark.
The Australian docket was empty on Thursday, leaving all attention to the release of the Key RBA’s Statement on Monetary Policy (SoMP) on Friday.
If sellers maintain their dominance, AUD/USD may challenge the 2023 bottom of 0.6270 (October 26), seconded by the round level of 0.6200 and the 2022 low of 0.6169 (October 13). On the contrary, the pair should initially challenge the November high of 0.6522 (November 6), before proceeding to the weekly top of 0.6616 (August 10), which is still supported by the 200-day SMA (0.6607). The July high of 0.6894 (July 14), the June high of 0.6899 (June 16), and the crucial 0.7000 level are all to the north. The daily RSI has dropped to the sub-48 zone.
Resistance levels: 0.6449 0.6522 0.6616 (4H chart)
Support levels: 0.6371 0.6335 0.6280 (4H chart)
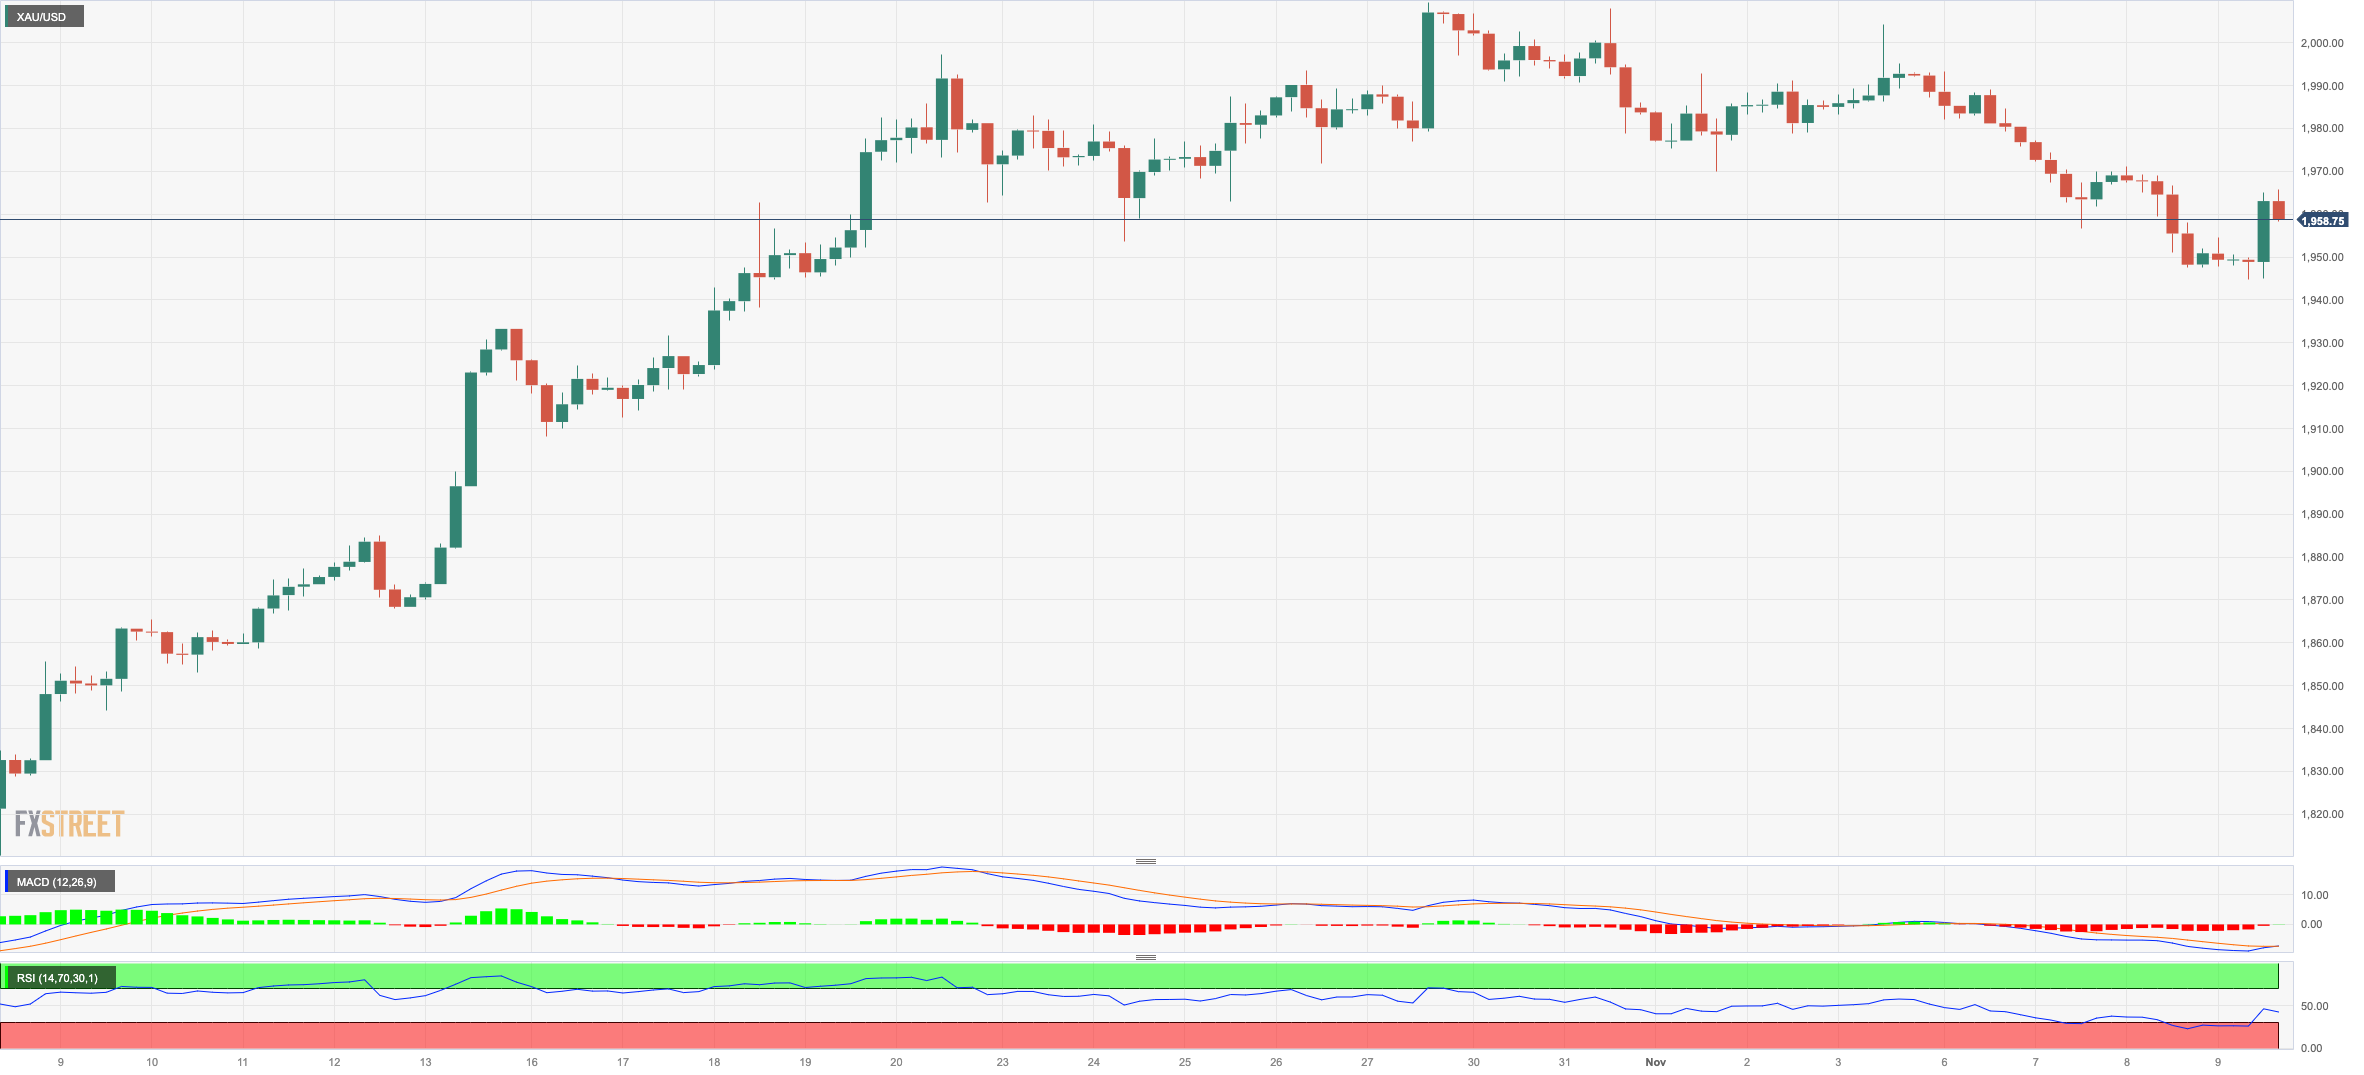
GOLD
Despite the late rebound in the greenback, prices of the precious metal managed well to reverse a three-session negative streak on Thursday.
In fact, prices of the troy ounce of gold retreated to the vicinity of the $1940 region during early trade, or three-week lows, just to gather upside traction afterwards in spite of the broad-based rebound in US yields and further improvement in the greenback.
In the meantime, the market's belief that the Federal Reserve might have finished raising interest rates appears to contradict the recent hawkish messaging from certain Fed speakers, creating uncertainty regarding the near-term outlook for the price of gold.
If selling pressure builds, gold may face the important 200-day SMA of $1934, which is slightly ahead of the preliminary 55-day SMA of $1923. South from here, the October low of $1810 (October 6), the 2023 bottom of $1804 (February 28), and the $1800 crucial support zone are all aligned. On the upside, the immediate up barrier seems to be the $2009 high (October 27), followed by the 2023 top of $2067 (May 4) and the 2022 peak of $2070 (March 8). The breakout of the latter exposes the all-time high of $2075 (August 7, 2020).
Resistance levels: $2009 $2022 $2048 (4H chart)
Support levels: $1944 $1922 $1908 (4H chart)
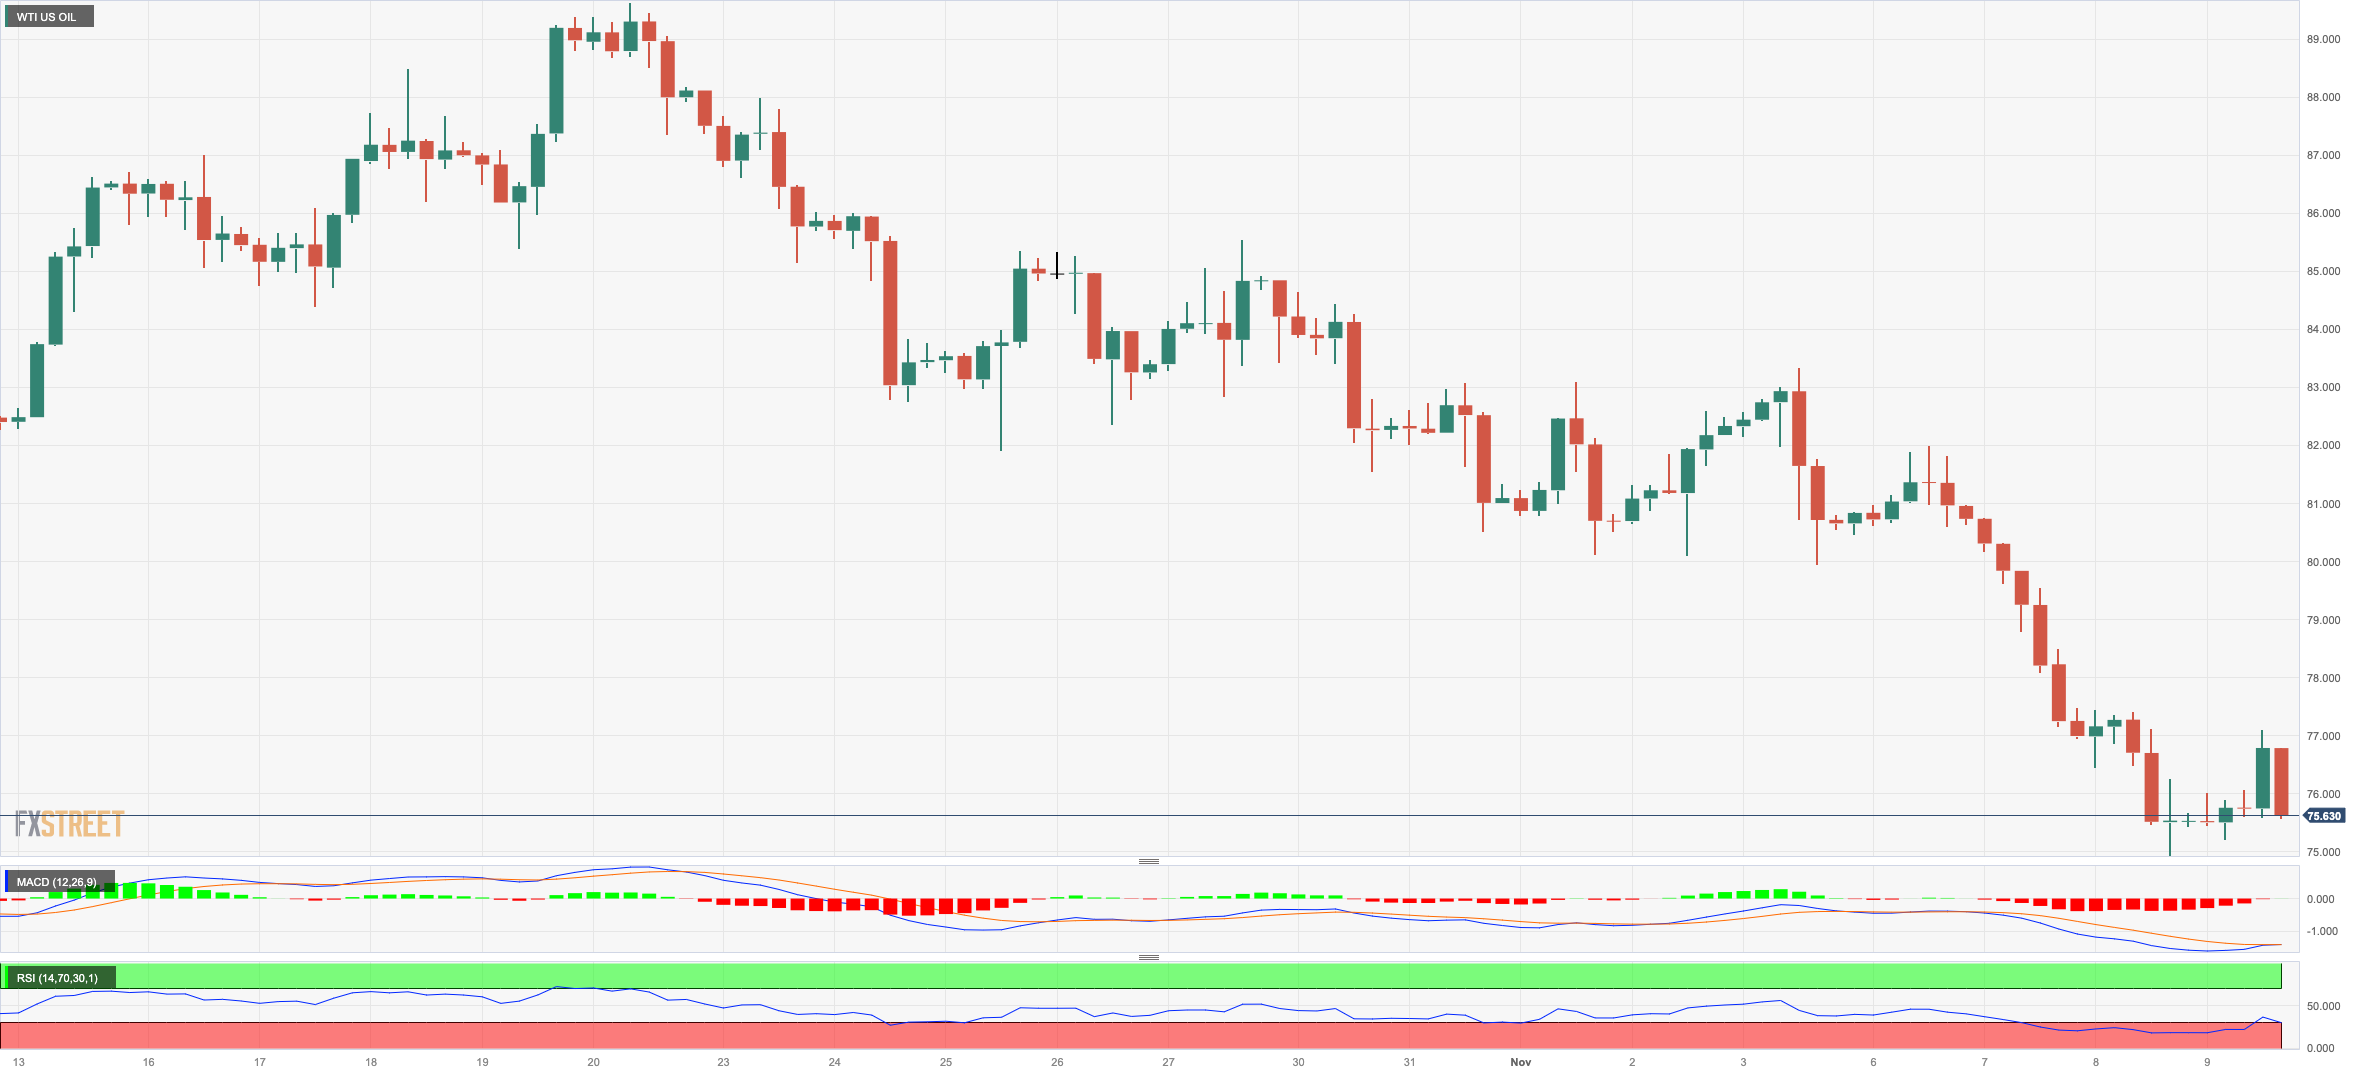
CRUDE WTI
Prices of WTI managed to rebound from earlier four-month lows near the $75.00 mark per barrel on Thursday.
Despite the daily bounce, price action surrounding the commodity remained subdued amidst growing concerns around the demand for crude oil.
In addition, Chinese disinflationary pressures added to traders’ worries and reinforced the idea that the economy continues to struggle to stage a meaningful rebound in the post-pandemic era.
If losses persist, WTI may retest the weekly low of $73.89 (July 17) ahead of the crucial $70.00 barrier per barrel. The June low of $66.85 (June 12) is lower, ahead of the 2023 low of $63.61 (May 4) and the critical yardstick of $60.00. Instead, the 200-day SMA at $78.11 emerges as the immediate up-barrier prior to the provisional 55-day SMA at $85.77, all of which are ahead of the weekly high of $89.83 (October 18) and the 2023 high of $94.99 (September 28). Furthermore, the weekly top of $97.65 (August 30, 2022) is seen as the last line of defense before a probable visit to the psychological $100.00 level.
Resistance levels: $83.56 $85.31 $89.82 (4H chart)
Support levels: $74.88 $73.81 $70.18 (4H chart)
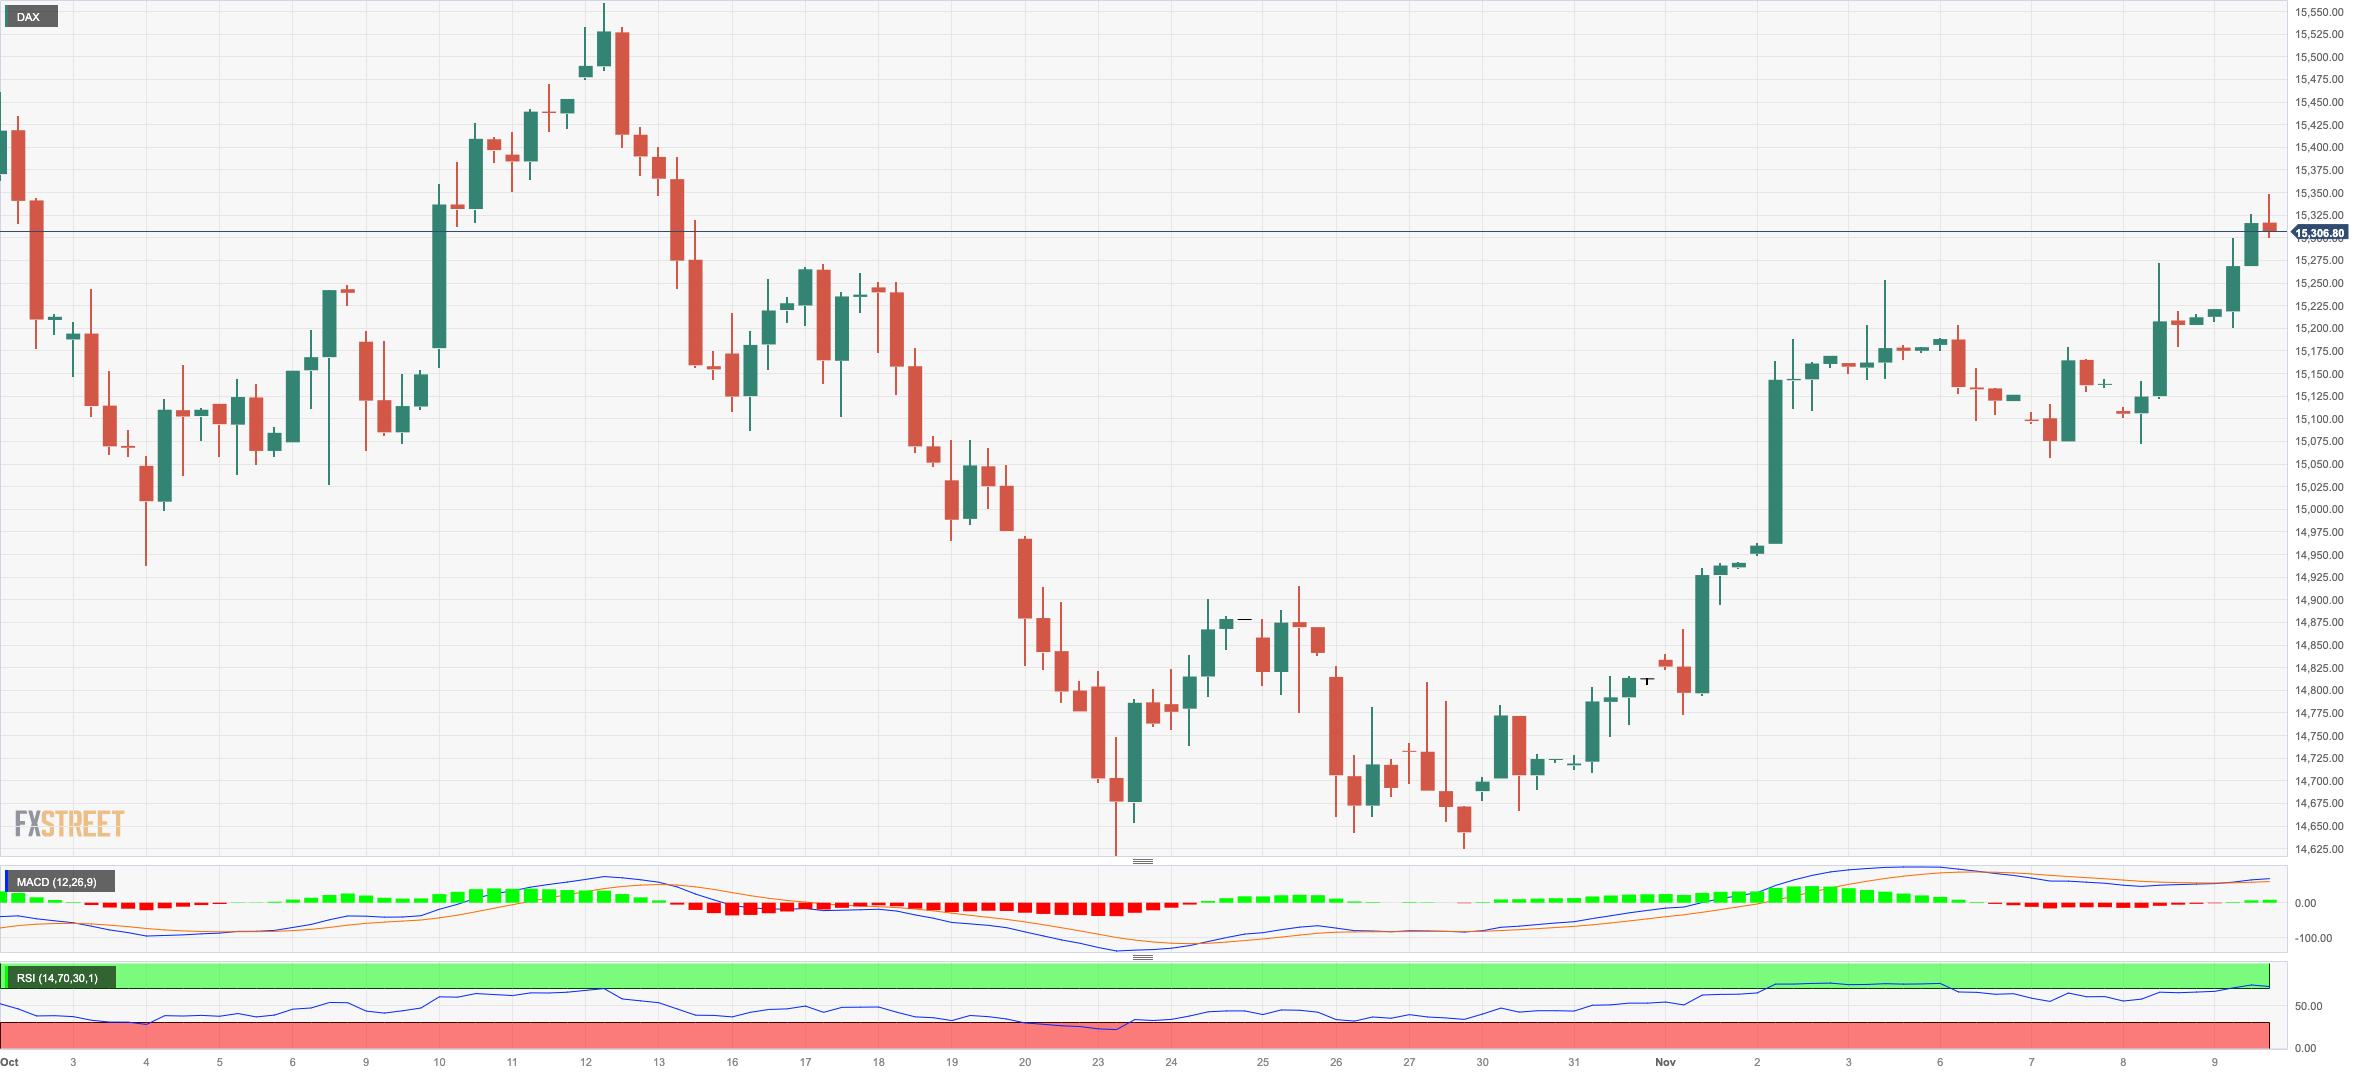
GER40
Germany’s stock benchmark DAX40 added to the weekly recovery and climbed to fresh four-week highs around the 15300 zone on Thursday, an area coincident with the provisional 55-day SMA.
The third consecutive session of gains in the index came almost exclusively on the back of renewed optimism from better-than-expected corporate earnings reports, all against the backdrop of a flattish mood in the FX universe and rising cautiousness prior to the speech by Chair Powell.
Further gains in the index also matched the positive session in the 10-year bund yields, which managed to reverse two daily pullbacks in a row and regain the 2.65% level and beyond.
The surpass of the November high of 15364 (November 9), could encourage the DAX40 to embark on a potential move to the October top of 15575 (October 12), ahead of the key 200-day SMA of 15643. After clearing the latter, the index may reach the September peak of 15989 (September 15), followed by the weekly highs of 16042 (August 31) and 16060 (August 10). Further up, a probable visit to the all-time high of 16528 (July 31) could start emerging on the horizon. Just the opposite, the index may be dragged to the October low of 14630 (October 23), before the March low of 14458 (March 20). The December 2022 low of 13791 (December 20) follows next, followed by the 2022 bottom of 11862 (September 28). The daily RSI advanced to the vicinity of 60.
Best Performers: Siemens Energy AG, Merck, Heinkel VZO
Worst Performers: Hannover Rueck SE, Airbus Group, Munich Re Group
Resistance levels: 15364 15575 15989 (4H chart)
Support levels: 14991 14630 14458 (4H chart)
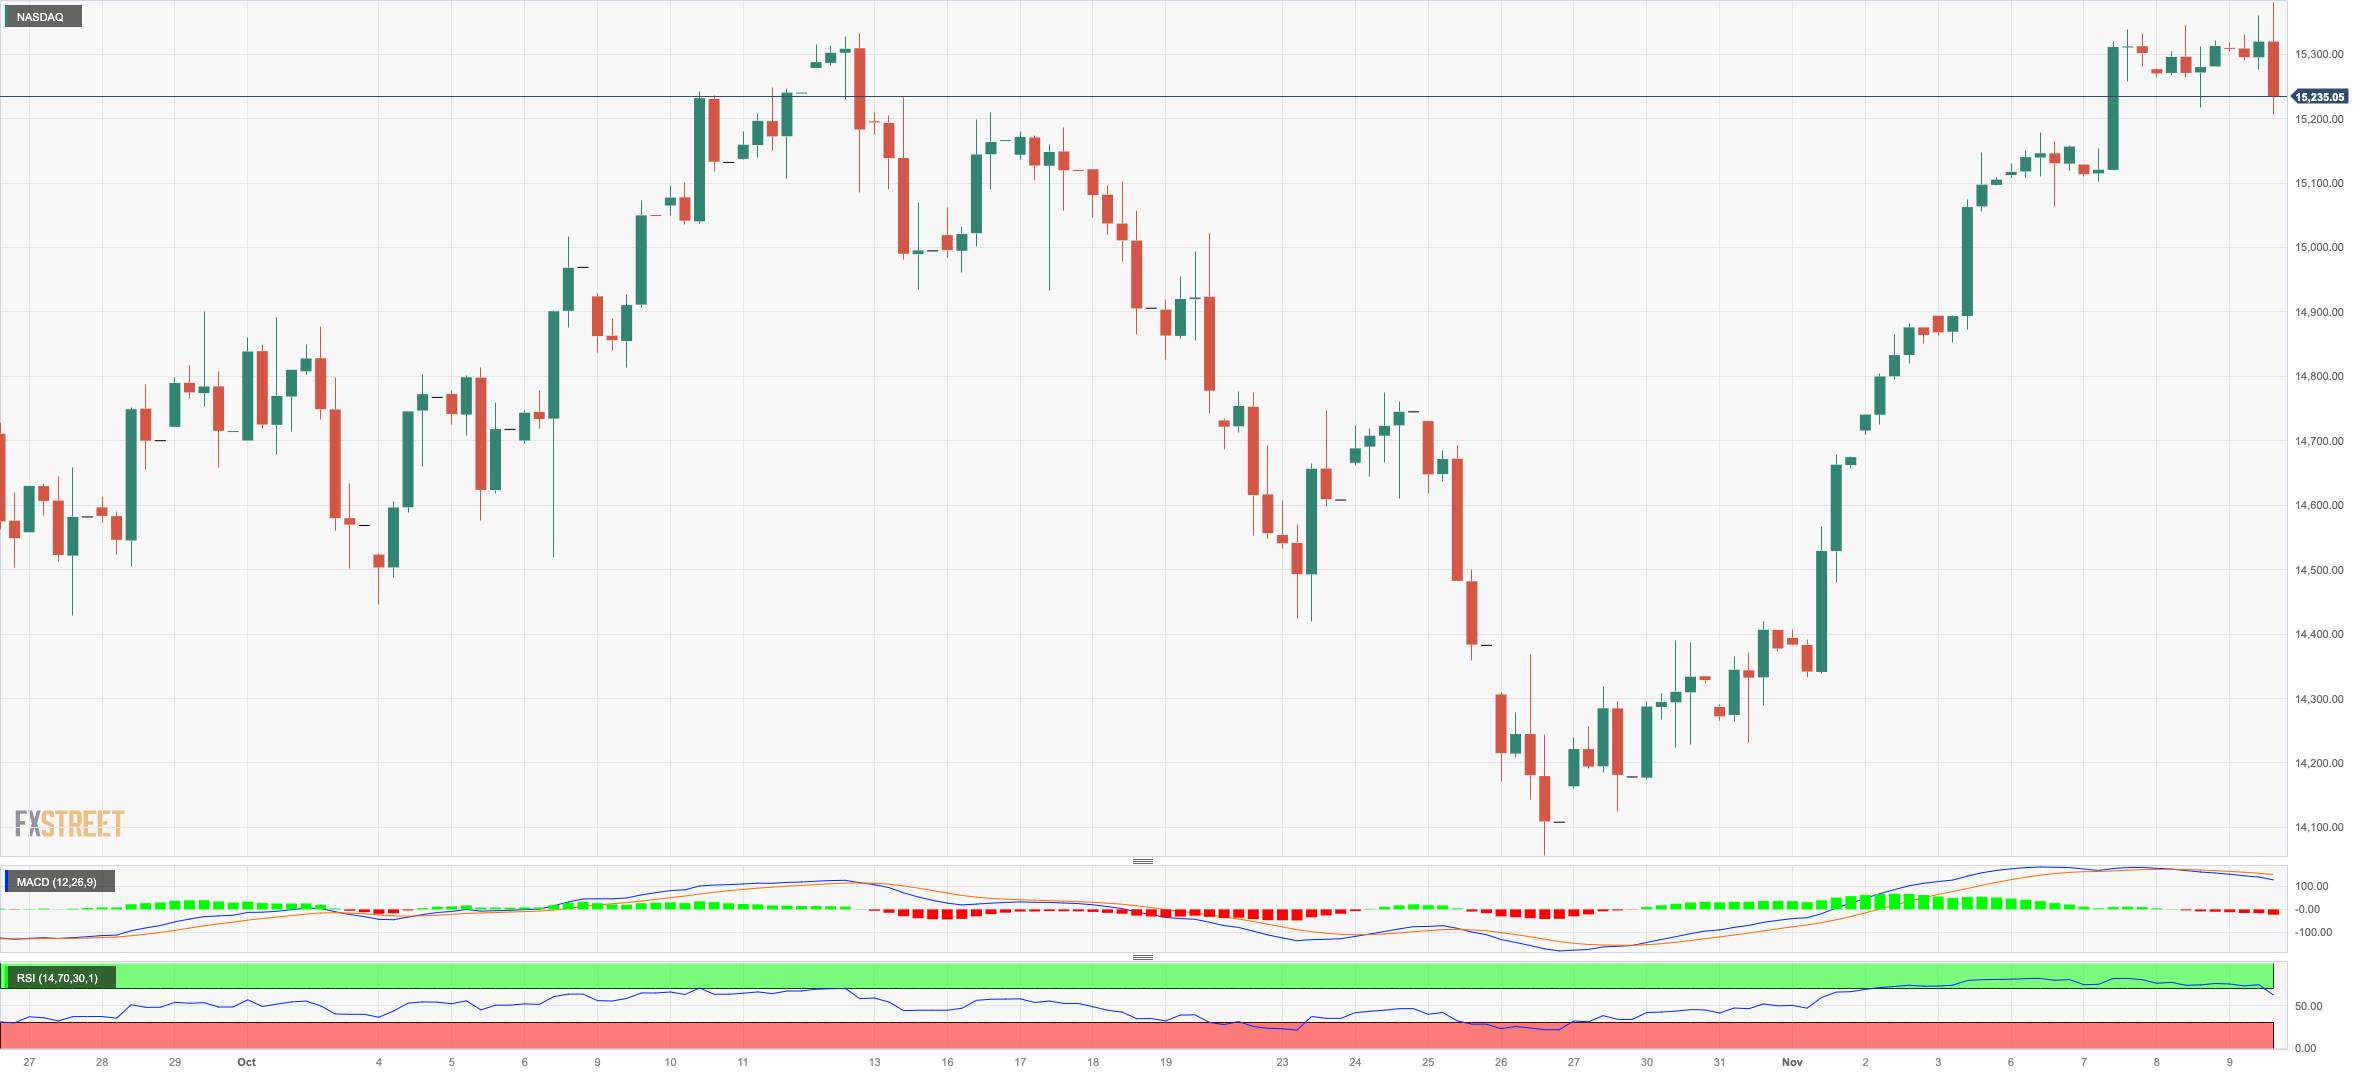
NASDAQ
The tech index Nasdaq 100 came under renewed downside pressure and halted a nine-day positive streak on Thursday.
The daily retracement in tech equities came on the back of the sharp rebound in the greenback and the equally robust bounce in US yields across the curve, all after Chief Powell reinforced the case of a tighter-for-longer Fed and hinted at the possibility of another rate hike.
Further Nasdaq advances might come up against the September high of 15618 (September 1), which comes before the 2023 top of 15932 (July 19) and the round level of 16000. Having said that, the immediate support looks to be at the October low of 14058 (October 26), which is supported by the important 200-day SMA at 14077. The collapse of this zone might return a visit to the April low of 12724 (April 25), ahead of the March low of 11695 (March 13) and prior to the 2023 low of 10696 (January 3). The RSI for the day eased to the 61 zone.
Top Gainers: Marvel, Micron, NVIDIA
Top Losers: Tesla, Lucid Group, Gilead
Resistance levels: 15382 15618 15803 (4H chart)
Support levels: 15091 14058 13520 (4H chart)
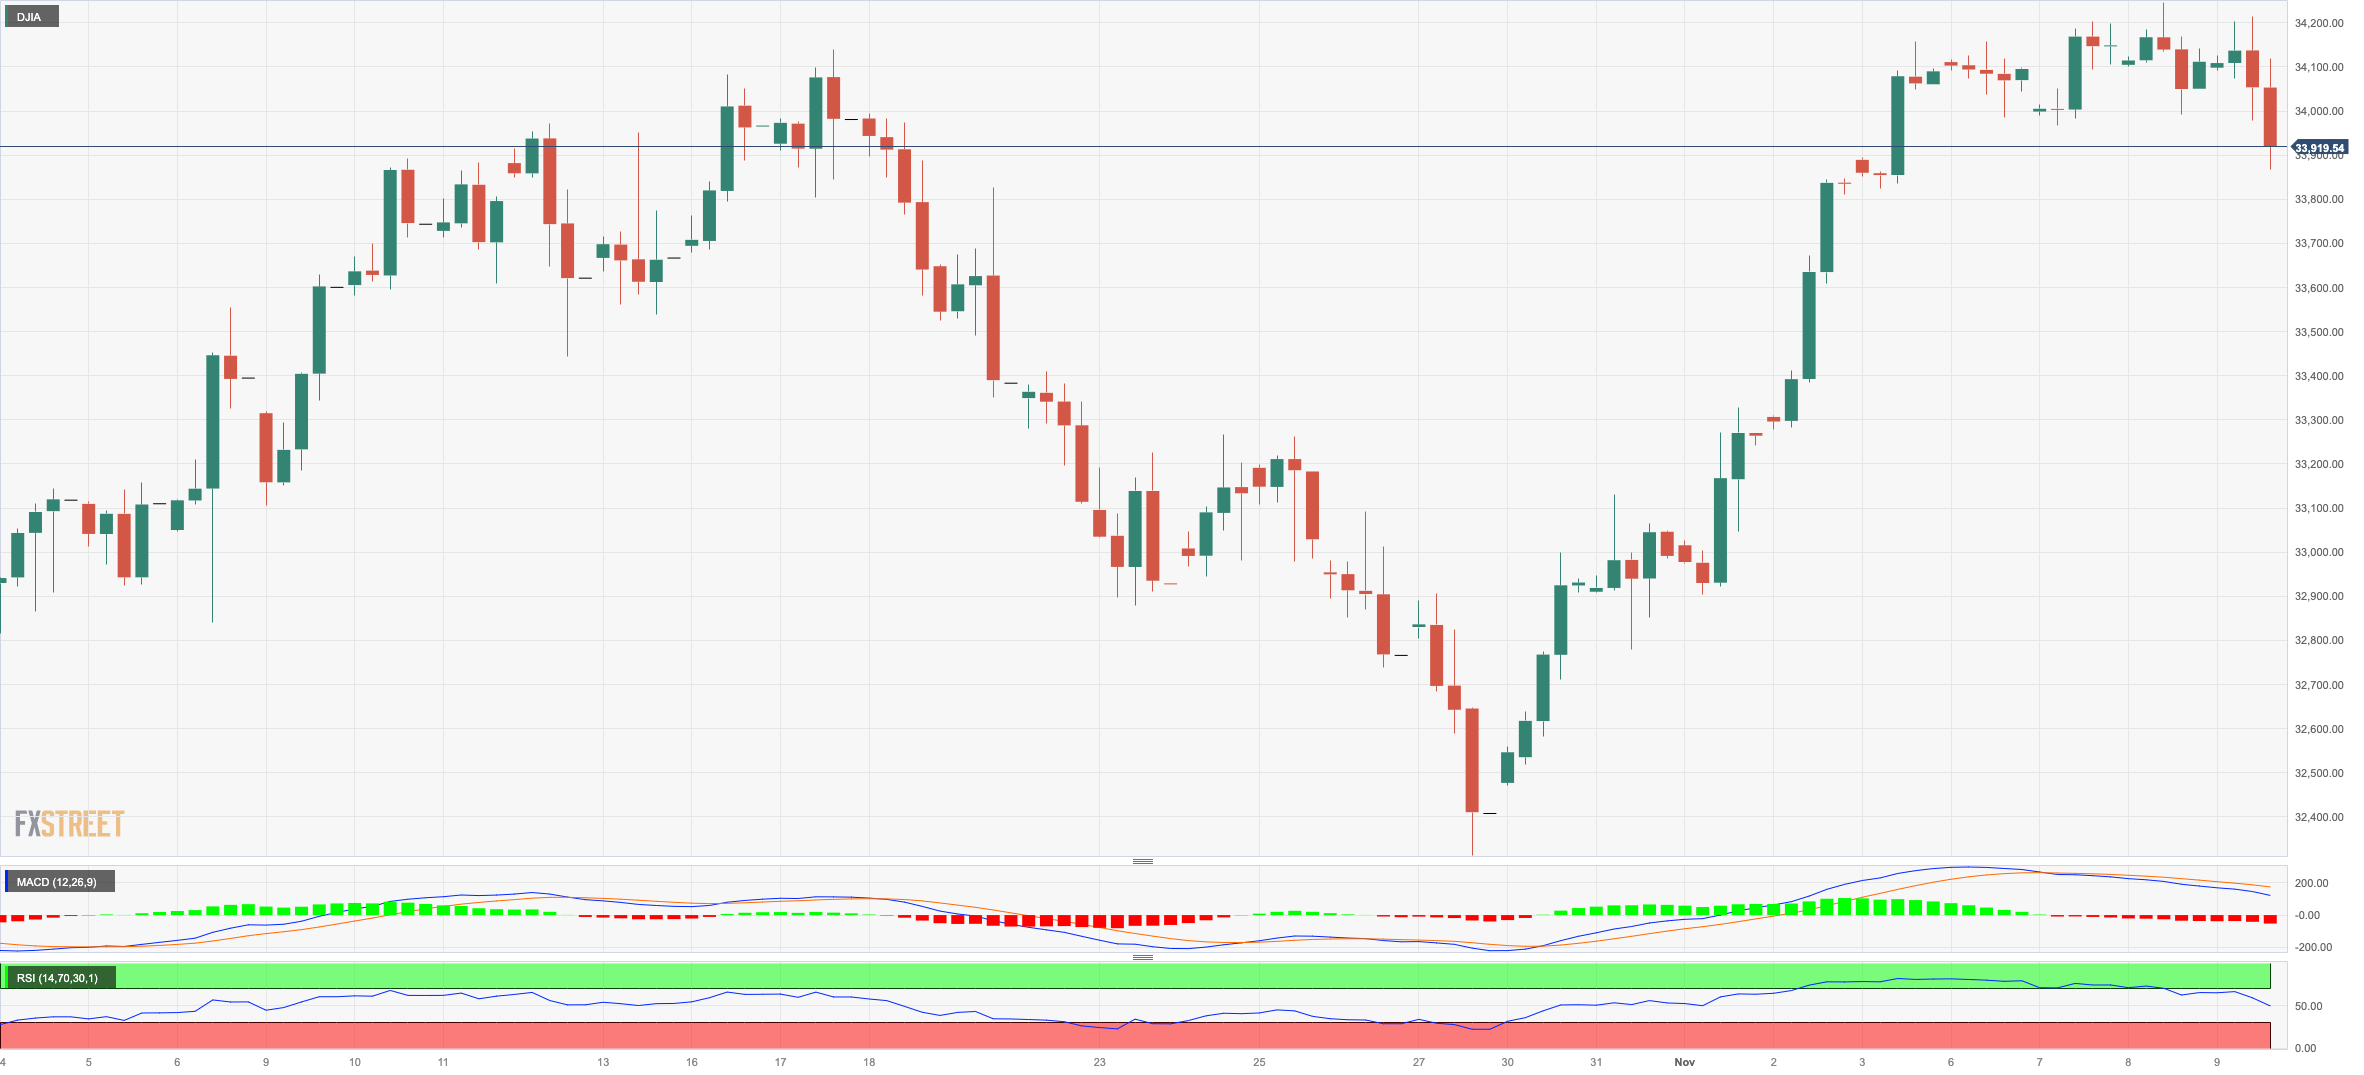
DOW JONES
The US benchmark Dow Jones added to Wednesday’s losses and deflated to weekly lows in the sub-34000 zone on Thursday.
The corrective move in US stocks came in response to the somewhat hawkish tilt at Powell’s speech, who hinted at the idea that the Fed has still work to do when it comes to tackle inflation, leaving at the same time the door open to further tightening.
All in all, the Dow Jones dropped 0.60% to 33931, the S&P500 retreated 0.59% to 4356, and the tech-reference Nasdaq Composite eased 0.58% to 13571
Next on the upside for the Dow Jones comes the November high of 34252 (November 8), which coincides with the intermediate 100-day SMA (34264) and aligns before the September top of 34977 (September 14). North from here emerges the weekly peak of 35070 (August 31) seconded by the 2023 high of 35679 (August 1). On the flip side, initial support is seen at the October low of 32327 (October 27) before the 2023 bottom of 31429 (March 15) and the 2022 low of 28660 (October 13). The daily RSI grinded lower to the 58 area.
Top Performers: Walt Disney, Boeing, Intel
Worst Performers: Amgen, Nike, Home Depot
Resistance levels: 34252 34271 35070 (4H chart)
Support levels: 33474 32327 31429 (4H chart)
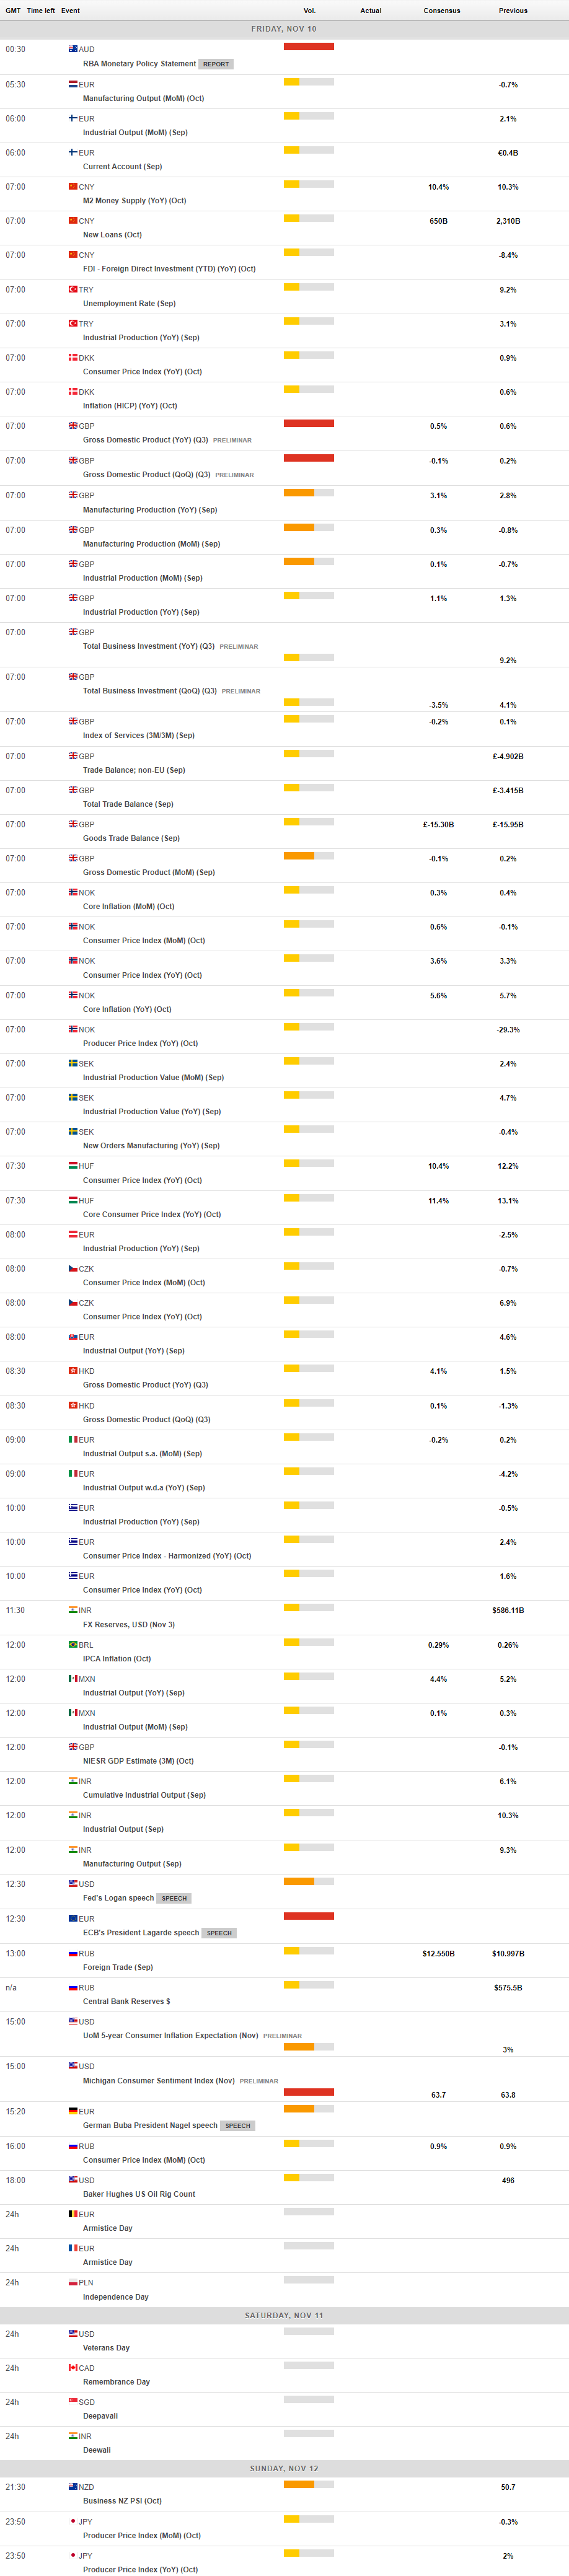
MACROECONOMIC EVENTS
All Information & Updates provided by:

All information relating to the financial markets available on this page has been prepared and issued by FXStreet (Forexstreet SL, Spain, Reg: B62498233) on the basis of publicly available information and all information believed to be reliable and does not conflict with Kuwaiti local laws, and all necessary care has been taken to before the company to ensure that the facts mentioned are correct from the source.
NCM Investment nor any of its directors or employees shall in any way be held responsible for the contents of this news, and the information contained on this page is intended only to provide clients with publicly available information and should not be construed as investment advice, report or analysis and/or constitute an offer or invitation to buy or sell financial instruments of any kind.
RISK WARNING: Forex and CFDs are highly risky leveraged products, as losses can exceed deposits. Please ensure you understand all the risks and take independent advice if necessary. NCM will segregate the clients based on the criteria of the regulator and its bylaws. NCM does not provide any advisory service; the material published does not constitute advice or a recommendation for a transaction in any financial instrument. NCM accepts no responsibility for any use of the content presented and any consequences of that use. Anyone acting on the information provided does so at their own risk.