
- Contact Us:
-

-

-

-


Daily Market Updates
13 Nov 2023
USDJPY
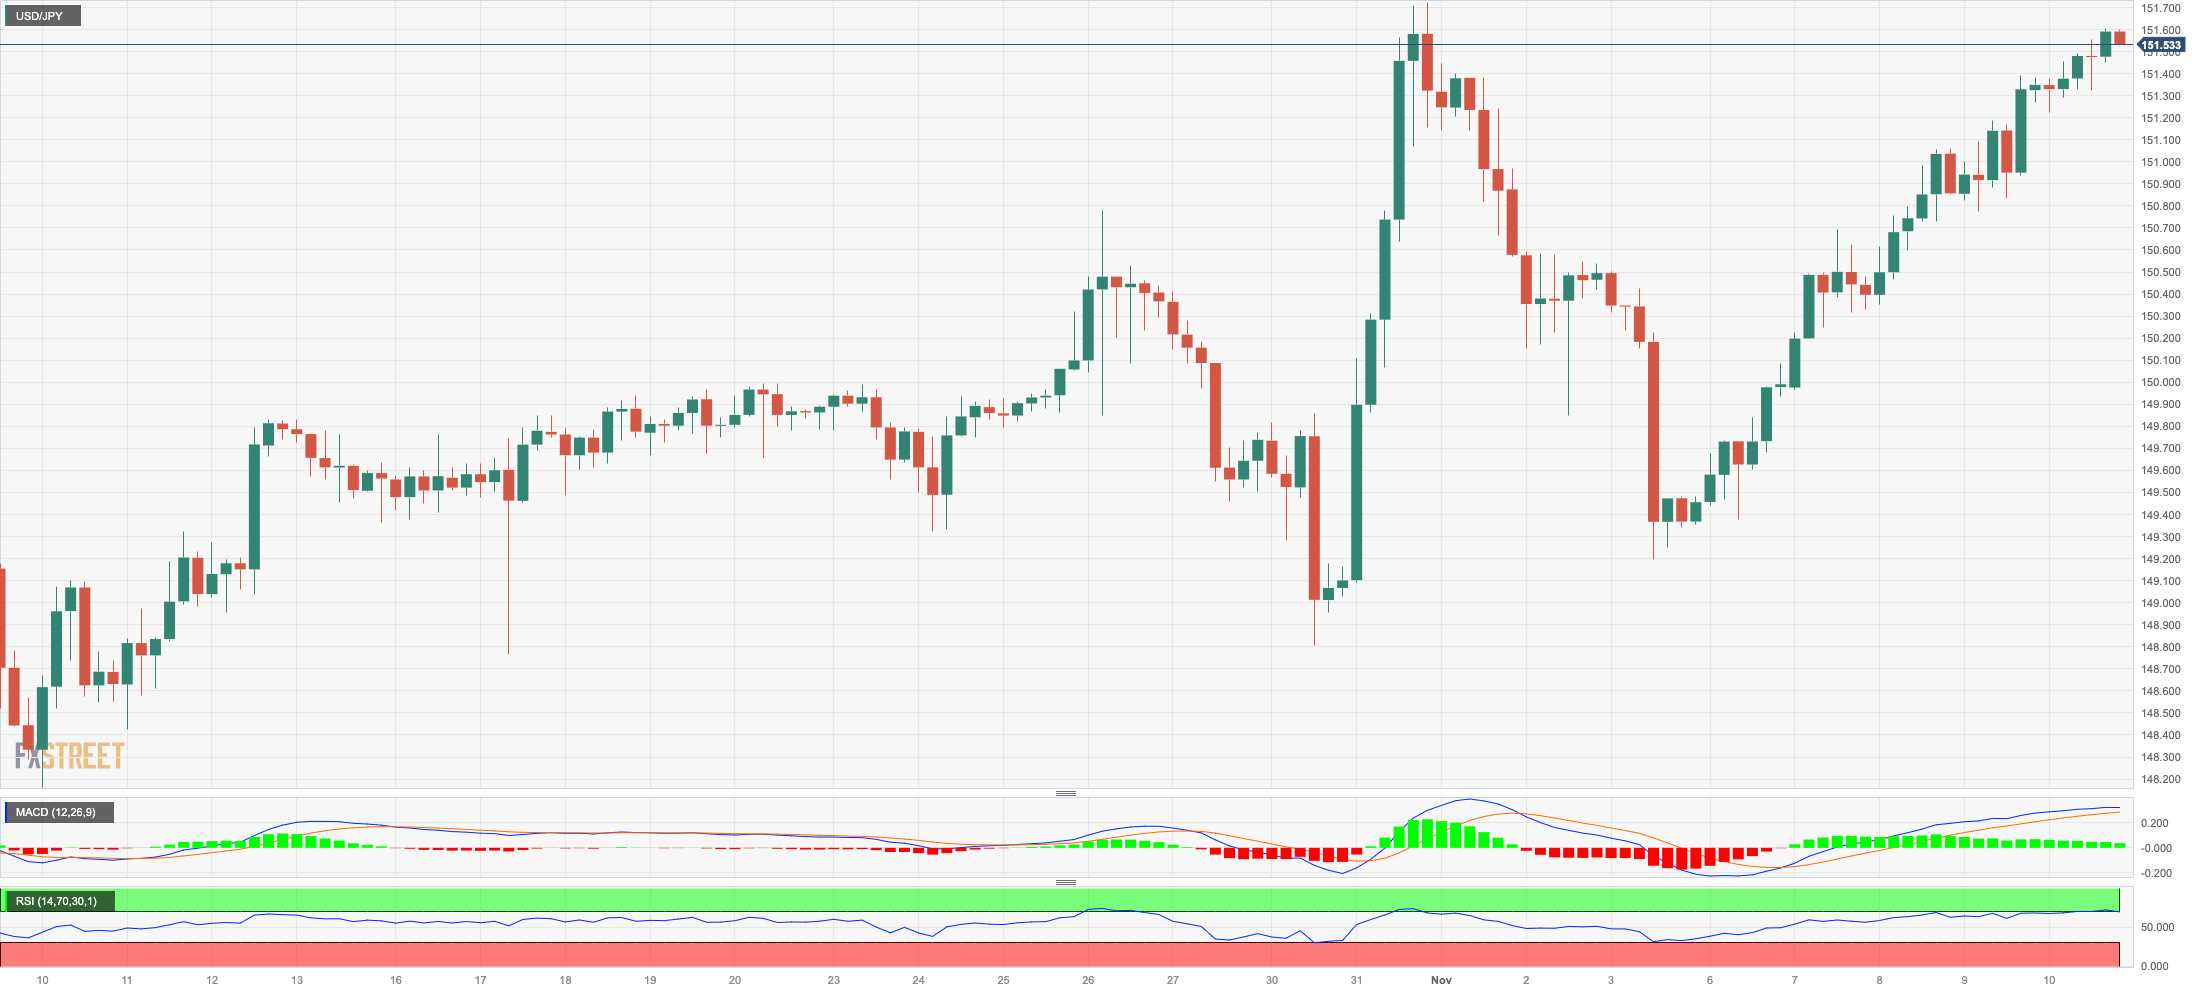
USD/JPY advanced uninterruptedly since Monday, climbing to shouting distance from the 2023 peaks in the 151.70 region on Friday.
The persistent march north in the pair came in tandem with the irresolute performance in the greenback, while a mixed tone in US yields saw further improvement in the short end of the curve vs. small pullbacks in the belly and the long end.
In the Japanese bond market, the JGB 10-year yields reversed a multi-session retracement and bounced to the 0.85% zone.
There were no data releases in the Japanese calendar on Friday.
If the USD/JPY surpasses the 2023 high of 151.72 (October 31), it may then challenge the 2022 top of 151.94 (October 21), which would be swiftly followed by the round level of 152.00. In contrast, the 55-day SMA looks to be a temporary support level at 148.82, ahead of the weekly low of 148.16 (October 10) and the October low of 147.27 (October 3). The weekly low of 145.89 (September 11) is followed by the September low of 144.43. (September 1). Down from here, there are no significant support levels until the August low of 141.50 (August 7), which is previous to the 200-day SMA of 140.89 and the July low of 137.23 (July 14). On the daily chart, the RSI improved past the 61 barrier.
Resistance levels: 151.60 151.72 151.94 (4H chart)
Support levels: 150.58 149.77 149.18 (4H chart)
GBPUSD
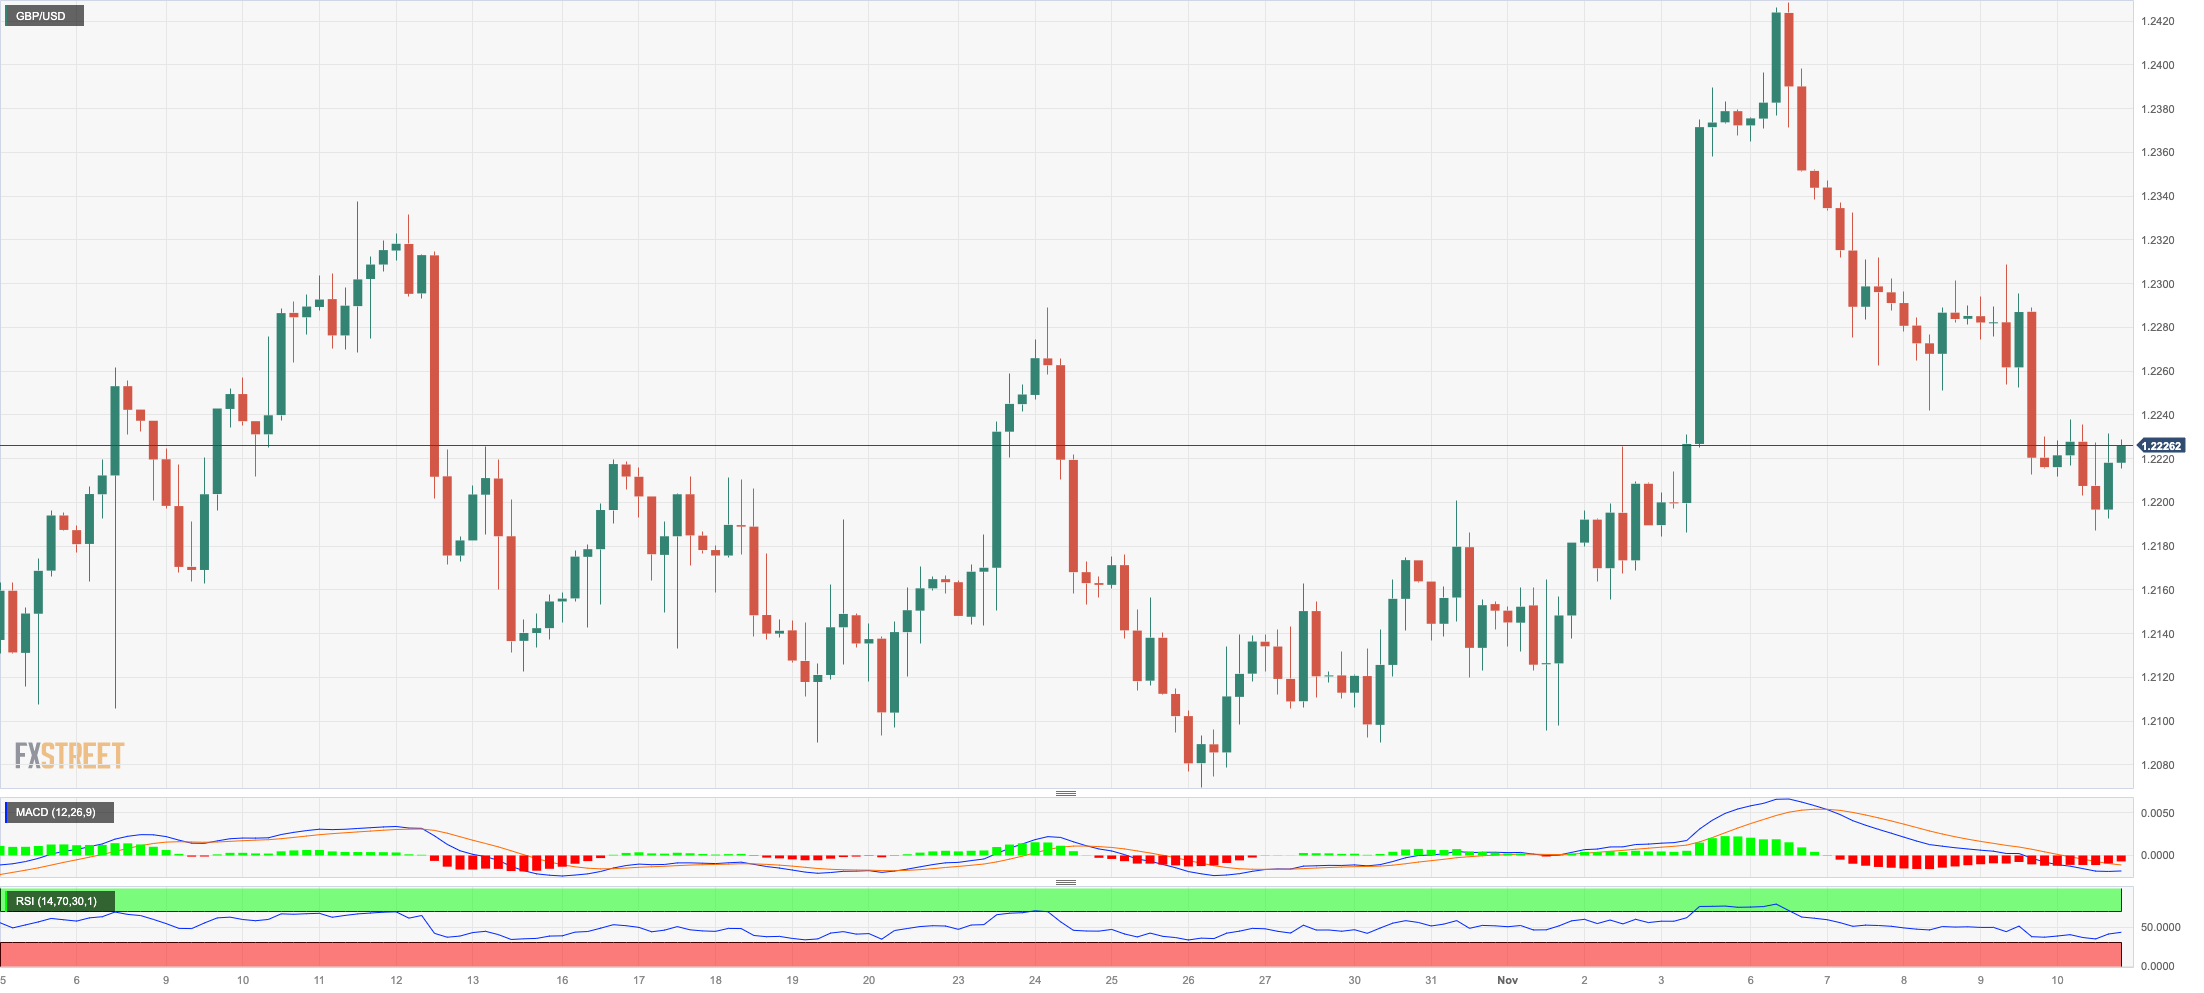
GBP/USD charted an inconclusive session and reversed an initial drop to the sub-1.2200 region on Friday, eventually ending the week in the 1.2220/30 band amidst the equally vacillating mood in the greenback.
In fact, alternating risk appetite trends dictated the mood around the British pound, despite auspicious prints from the UK calendar.
On this, the GDP 3-Month Average came in flat on a monthly basis in September, while the flash GDP Growth Rate expanded 0.6% YoY in Q3 and the GDP expanded 1.3% in the year to September. Additional upbeat results in September showed the Goods Trade deficit narrow to £14.288B, Industrial Production expand 1.5% YoY, and Construction Output rose 2.8% from a year earlier.
A deeper pullback could drag GBP/USD to the weekly low of 1.2069 (October 26) before the October low of 1.2037 (October 3), which is just above the crucial 1.2000 barrier, and before the 2023 bottom of 1.1802 (March 8). The November high of 1.2428, on the other hand, appears to be supported by the key 200-day SMA of 1.2433, and it comes ahead of the weekly high of 1.2548. (September 11). After that, weekly peaks of 1.2746 (August 30), 1.2818 (August 10), and 1.2995 (July 27) should emerge, all of which are above the psychological 1.3000 mark. The day-to-day RSI settled around 49.
Resistance levels: 1.2308 1.2428 1.2548 (4H chart)
Support levels: 1.2187 1.2095 1.2069 (4H chart)
AUDUSD
There was no exception to the downside pressure around the Australian currency on Friday either.
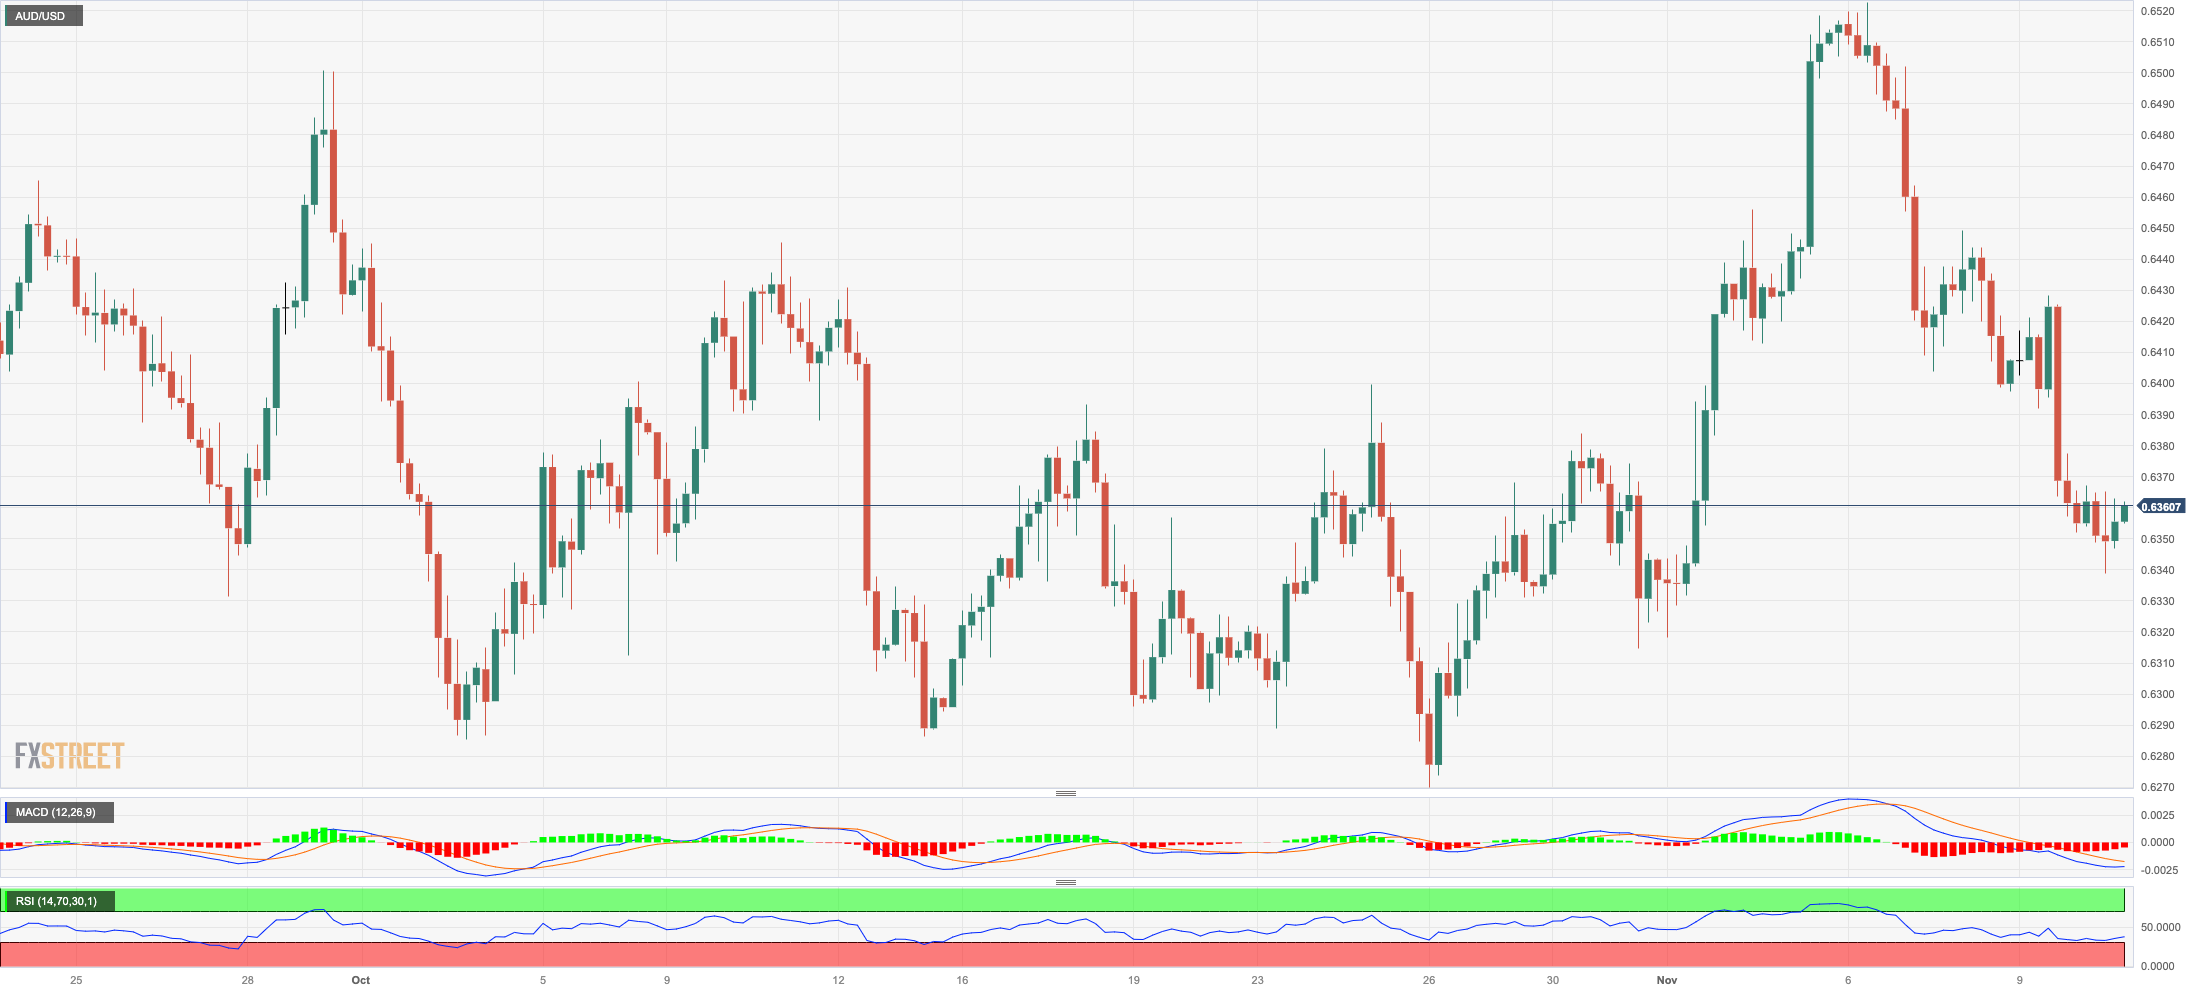
That said, AUD/USD posted its fifth consecutive daily decline, revisiting the area of multi-day lows near 0.6340 on the back of the indecisive session in the US dollar and the broad-based poor session in the commodity universe, where the sole exception seems to have been iron ore, which extended further its monthly rally.
In Oz, the RBA published its Statement on Monetary Policy (SoMP), where the bank reported a significant upward revision in growth and inflation forecasts. It stated that the domestic economy has demonstrated greater resilience than initially anticipated, and the labour market is expected to undergo a more gradual easing as a consequence. The increased likelihood of higher inflation in the upcoming year raises concerns about the potential entrenchment of elevated inflation expectations in pricing decisions.
If sellers retain their dominance, the AUD/USD may test the 2023 bottom of 0.6270 (October 26), which is followed by the round level of 0.6200 and the 2022 low of 0.6169 (October 13). Instead, the pair should first test the November high of 0.6522 (November 6), before moving on to the key 200-day SMA at 0.6606 and the weekly top of 0.6616 (August 10). To the north are the July peak of 0.6894 (July 14), the June high of 0.6899 (June 16), and the key 0.7000 level. The daily RSI deflated below 47.
Resistance levels: 0.6449 0.6522 0.6616 (4H chart)
Support levels: 0.6338 0.6317 0.6314 (4H chart)
GOLD
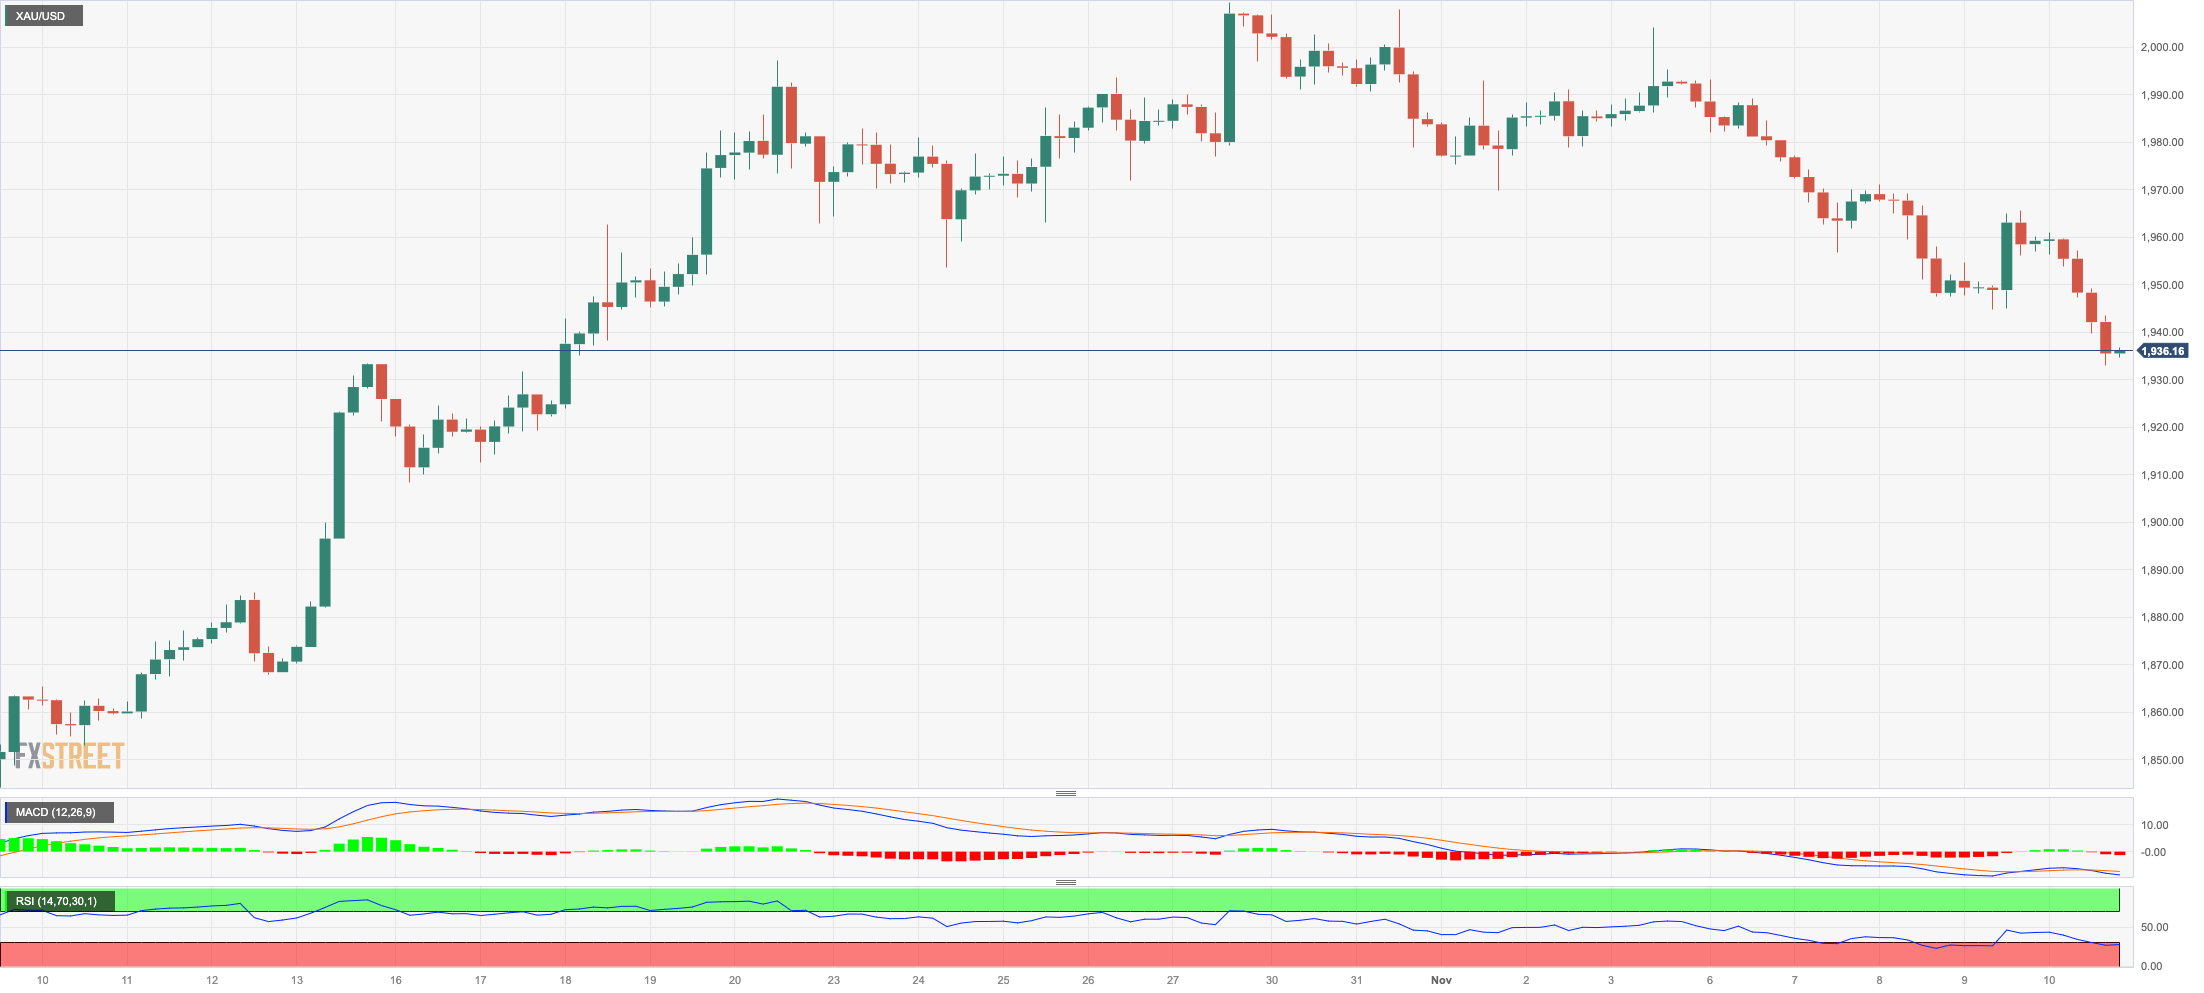
Gold prices resumed the downtrend, quickly leaving behind Thursday’s recovery attempt and revisiting the $1930 region per troy ounce on Friday, an area also coincident with the key 200-day SMA.
Despite the late loss of momentum in the greenback and the mixed performance of US yields at various maturity levels, the precious metal experienced an additional retracement. The bearish tone, in the meantime, appears to be driven by growing speculation regarding the Fed’s increasingly probable stance of maintaining a tighter monetary policy for an extended period.
Indeed, at present, there seems to be a discrepancy between the market's perception that the Fed has concluded its interest rate hikes and the recent hawkish comments made by certain Fed speakers. This contradiction has led to uncertainty surrounding the short-term prospects for the price of gold.
If selling pressure intensifies, gold may break below the November low of $1933 (November 10), which comes prior to the preliminary 55-day SMA of $1924. The October low of $1810 (October 6), the 2023 bottom of $1804 (February 28), and the $1800 key support zone are all aligned south of here. On the upside, the October high of $2009 (October 27) appears to be the immediate up hurdle, seconded by the 2023 top of $2067 (May 4) and the 2022 peak of $2070 (March 8). The latter's breakout reveals the all-time high of $2075 (August 7, 2020).
Resistance levels: $1965 $2009 $2022 (4H chart)
Support levels: $1933 $1923 $1908 (4H chart)
CRUDE WTI
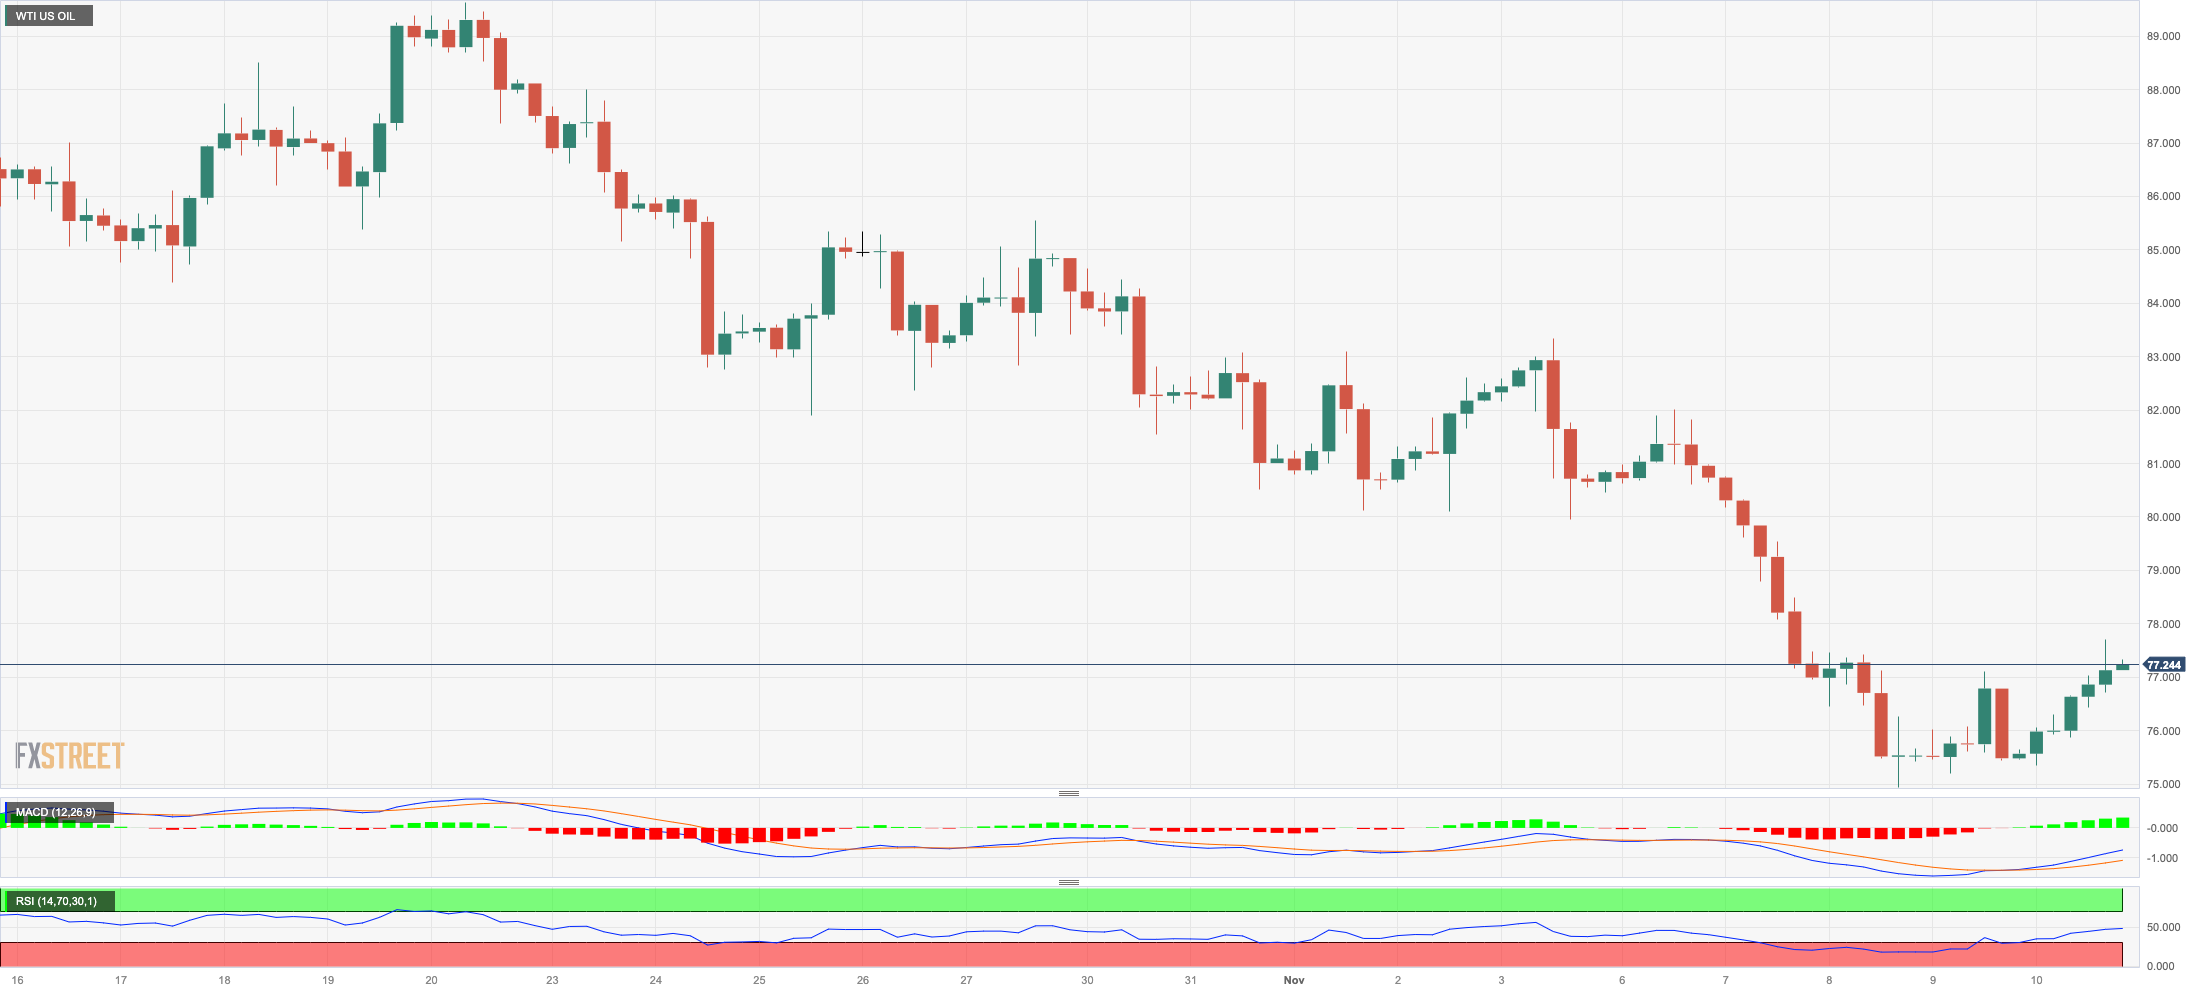
Finally, some respite for the prices of WTI arrived on Friday.
Indeed, the commodity managed to reverse three straight sessions of losses and advance decently past the $77.00 mark per barrel at the end of the week. The daily uptick, however, could not avoid the third consecutive week closing in red territory.
In the meantime, Friday’s uptick seems to have re-emerged in response to the presence of dip-buyers, while demand concerns appear to have taken a breather as well as omnipresent worries surrounding the sluggish recovery of the Chinese economy (of any at all).
In the docket, the US oil rig count went down by 2 in the week to November 10, taking the US total active oil rigs to 494, according to driller Baker Hughes.
If WTI breaches the November low of $74.96 (November 10) it may then revisit the weekly low of $73.89 (July 17), ahead of the critical $70.00 mark per barrel. The June low of $66.85 (June 12) is lower and comes before the 2023 low of $63.61 (May 4) and the crucial yardstick of $60.00. Instead, the 200-day SMA at $78.11 stands in front of the November high of $80.15 (November 3) and the provisional 55-day SMA at $85.70. Extra gains could revisit the weekly top of $89.83 (October 18) prior to the 2023 peak of $94.99 (September 28). In addition, another weekly high emerges at $97.65 (August 30, 2022) ahead of the psychological $100.00 level.
Resistance levels: $77.69 $83.56 $85.85 (4H chart)
Support levels: $74.88 $73.81 $70.18 (4H chart)
GER40
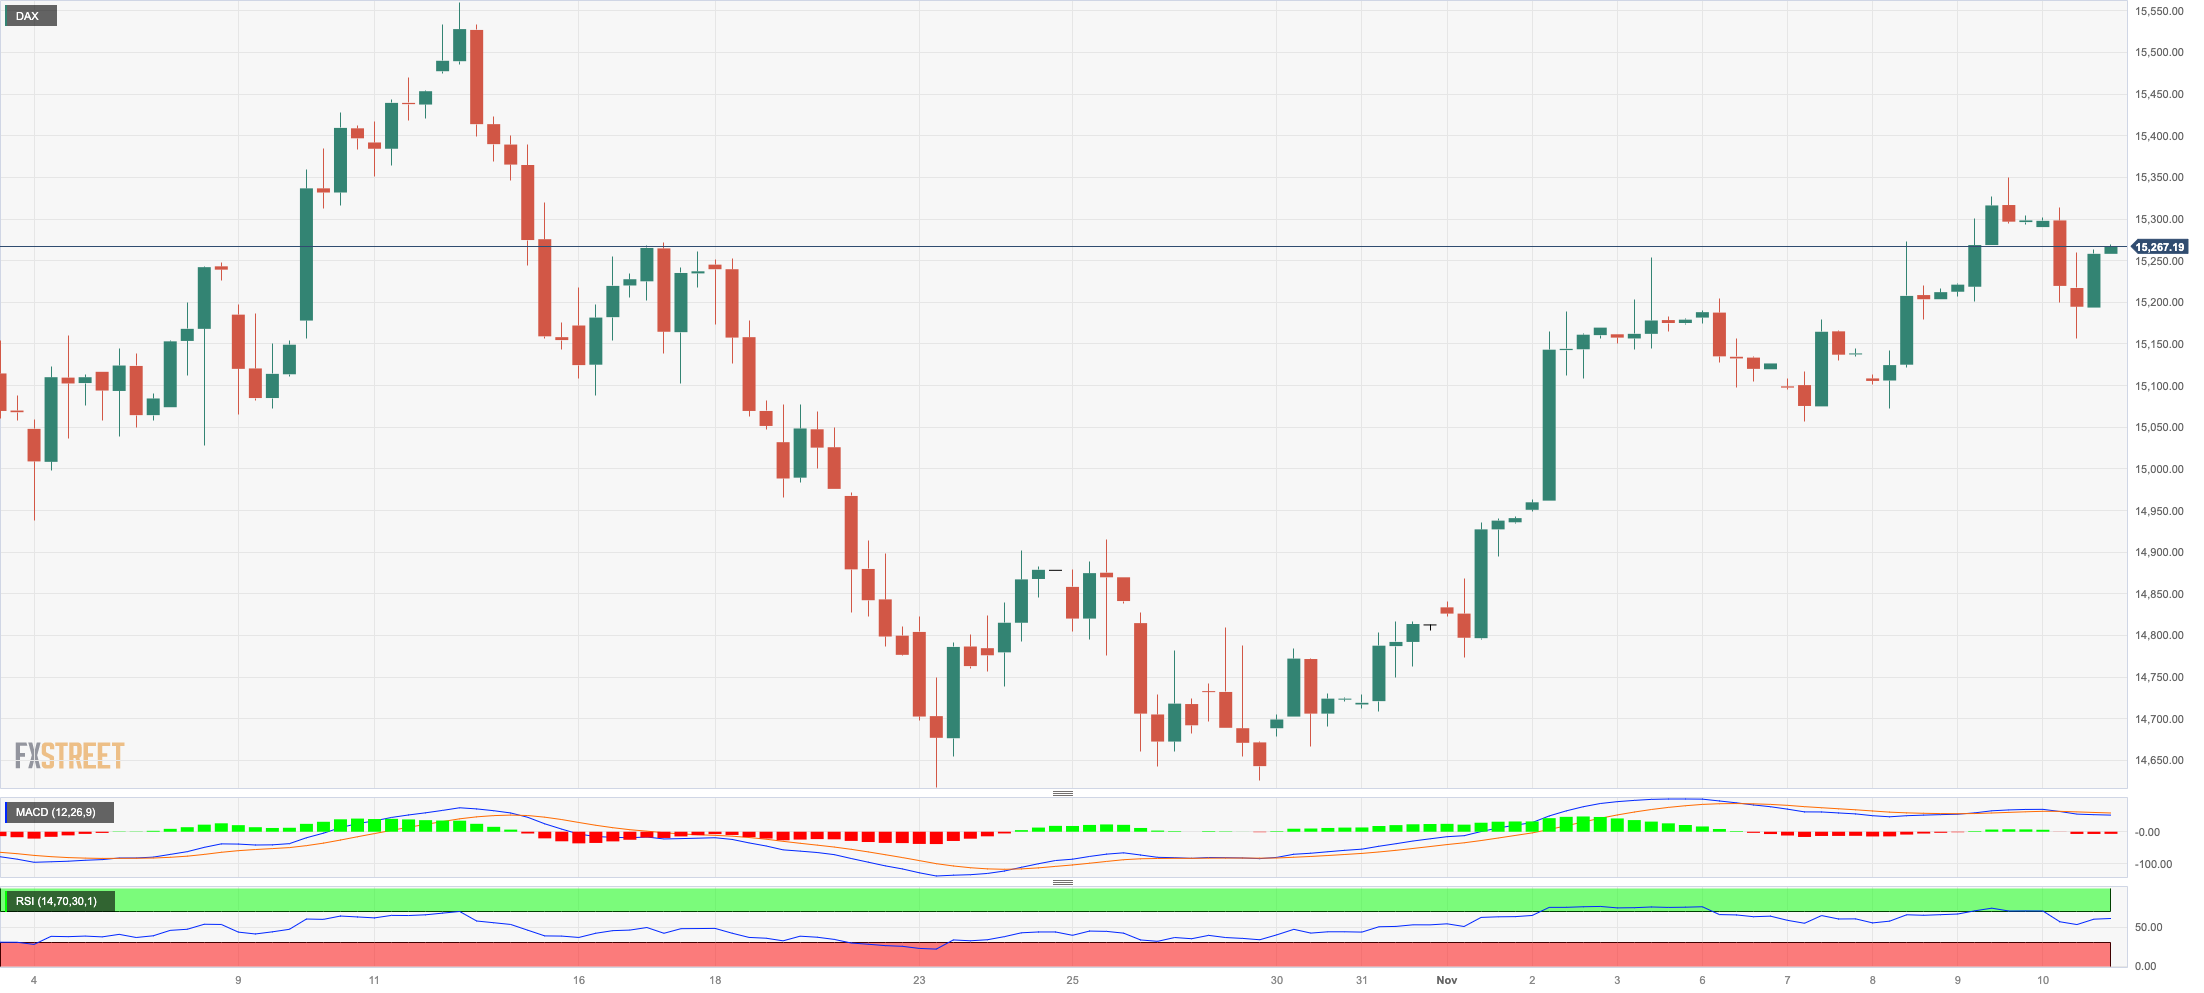
After three consecutive daily advances, Germany’s blue-chip index DAX40 retreated markedly to two-day lows at the end of the week.
The corrective pullback in the German stock market fell in line with the broad-based weakness seen in the rest of the European indices, as market participants assessed the cautious message from Chair Powell on Thursday.
In addition, some ECB’s rate-setters seem to have started to favour further tightening by the central bank, as inflation risks remain tilted to the upside, a view that shared President C. Lagarde at her speech on Friday.
The retracement in the index also was accompanied by a strong rebound in the 10-year bund yields, which reclaimed the area above 2.70%.
Immediately to the upside for the DAX40 comes the November high of 15364 (November 9) seconded by the October top of 15575 (October 12), and the important 200-day SMA of 15644. Once the latter is cleared, the index might dispute the September peak of 15989 (September 15), followed by weekly highs of 16042 (August 31) and 16060 (August 10). Further up, a possible visit to the all-time high of 16528 (July 31) may begin to appear on the horizon. On the contrary, the index might be dragged to the October low of 14630 (October 23), before reaching the March low of 14458 (March 20). The December 2022 low of 13791 (December 20) comes next, seconded by the September 2022 low of 11862 (September 20). The everyday RSI dropped to the 54 zone.
Best Performers: Commerzbank, Henkel VZO, Rheinmetall AG
Worst Performers: Zalando SE, Bayer, Siemens Energy AG
Resistance levels: 15364 15425 15575 (4H chart)
Support levels: 14991 14630 14458 (4H chart)
NASDAQ
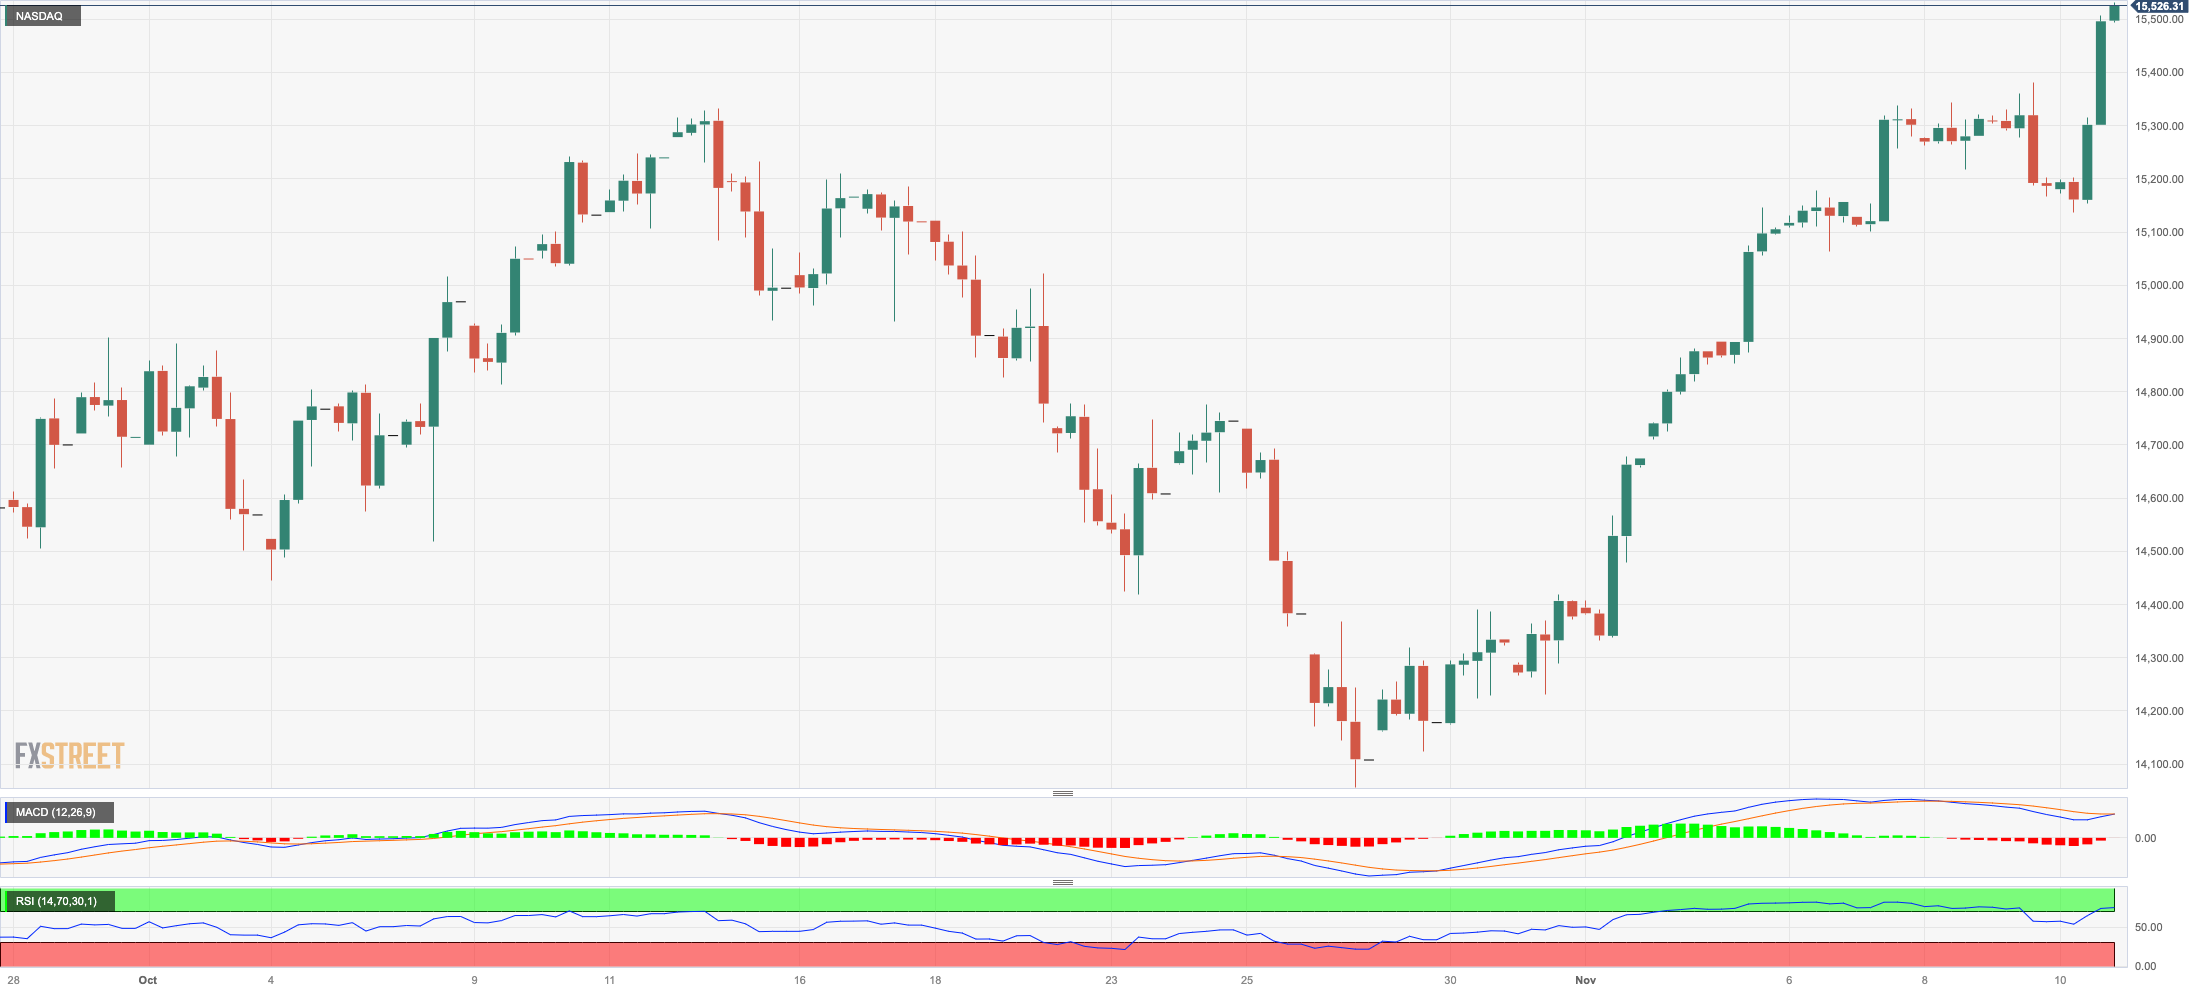
An outstanding session in the US tech sector lifted the benchmark Nasdaq 100 to fresh two-month highs past the 15500 level at the end of the week.
Furthermore, the index clinched its second consecutive week of gains in a context where the dollar retreated modestly and the absence of direction dominated the sentiment in the US bond market.
In addition, mixed messages from Fed policymakers regarding the continuation (or not) of the Fed’s tightening cycle also seem to have propped up the upward bias in tech stocks on Friday.
Further Nasdaq rises might go into the September high of 15618 (September 1), which comes before the 2023 top of 15932 (July 19) and the round level of 16000. However, immediate support appears to emerge at the 200-day SMA at 14094, which is closely followed by the October low of 14058 (October 26). The breakdown of this zone might bring us back to the April low of 12724 (April 25), ahead of the March low of 11695 (March 13), and the 2023 low of 10696 (January 3). The RSI for the day approached the 65 yardstick.
Top Gainers: Lam Research, Warner Bros Discovery, Microchip
Top Losers: The Trade Desk, Illumina, Sirius XM
Resistance levels: 15528 15618 15803 (4H chart)
Support levels: 15097 14058 13520 (4H chart)
DOW JONES
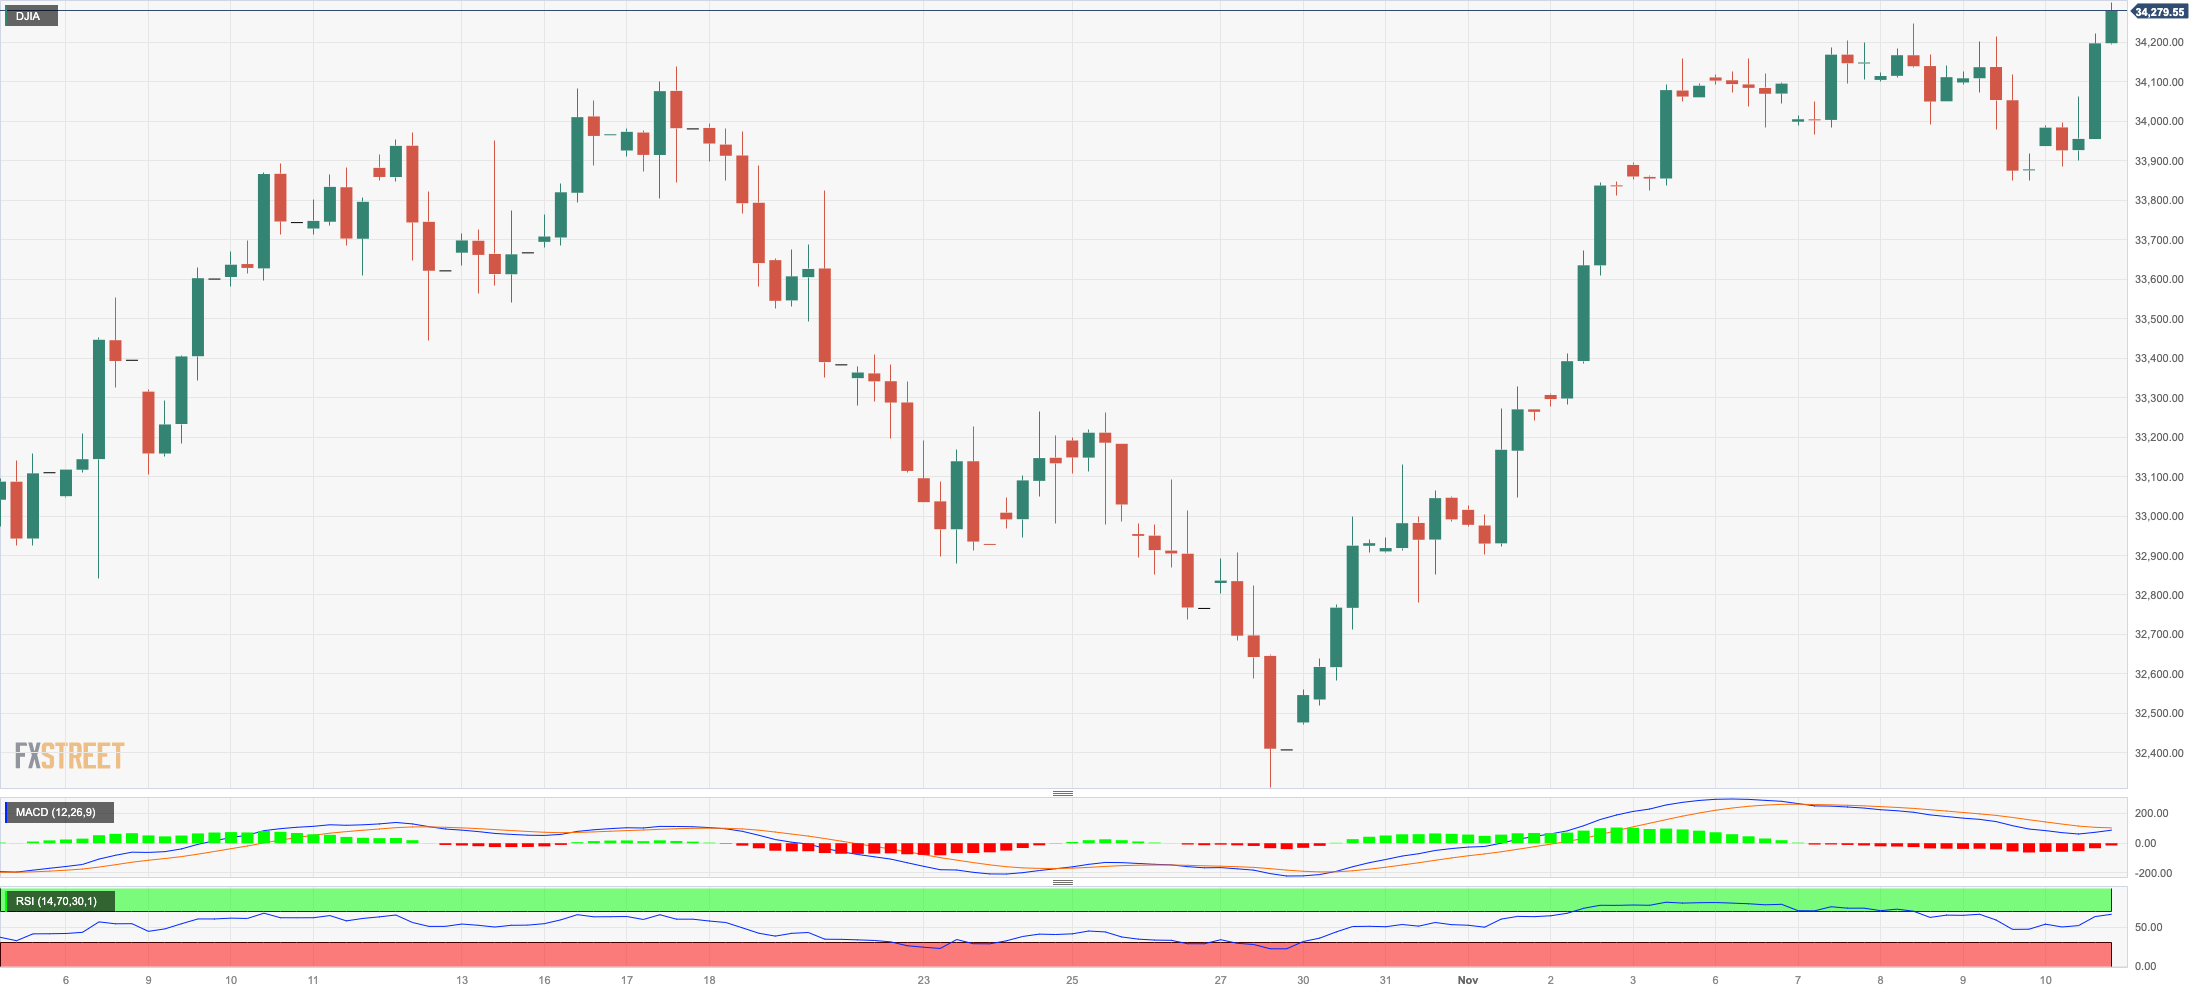
US equities tracked by the reference Dow Jones resumed the uptrend after two daily pullbacks in a row on Friday, climbing to seven-week highs around the 34300 zone.
The strong uptick in the index followed the outperformance of the tech sector amidst mixed messages from Fed speakers, all after Chair Powell acknowledged on Thursday that the Federal Reserve lacks confidence in having taken sufficient measures to curb inflation.
On the whole, the Dow Jones gained 1.15% to 34283, the S&P500 rose 1.56% to 4415, and the tech-heavy Nasdaq Composite advanced 2.05% to 13798.
The November high of 34310 (November 10) appears supported by the intermediate 100-day SMA and aligns before the September top of 34977 (September 14). North of here, the Dow Jones could challenge the weekly peak of 35070 (August 31) ahead of the 2023 high of 35679 (August 1). Having said that, the October low of 32327 (October 27) is considered as initial support before the 2023 bottom of 31429 (March 15) and the 2022 low of 28660 (October 13). The daily RSI improved further and flirted with 61.
Top Performers: Intel, Caterpillar, Microsoft
Worst Performers: Walt Disney, Merck&Co, Nike
Resistance levels: 34310 34977 35070 (4H chart)
Support levels: 33517 32327 31429 (4H chart)
MACROECONOMIC EVENTS

All Information & Updates provided by:

All information relating to the financial markets available on this page has been prepared and issued by FXStreet (Forexstreet SL, Spain, Reg: B62498233) on the basis of publicly available information and all information believed to be reliable and does not conflict with Kuwaiti local laws, and all necessary care has been taken to before the company to ensure that the facts mentioned are correct from the source.
NCM Investment nor any of its directors or employees shall in any way be held responsible for the contents of this news, and the information contained on this page is intended only to provide clients with publicly available information and should not be construed as investment advice, report or analysis and/or constitute an offer or invitation to buy or sell financial instruments of any kind.
RISK WARNING: Forex and CFDs are highly risky leveraged products, as losses can exceed deposits. Please ensure you understand all the risks and take independent advice if necessary. NCM will segregate the clients based on the criteria of the regulator and its bylaws. NCM does not provide any advisory service; the material published does not constitute advice or a recommendation for a transaction in any financial instrument. NCM accepts no responsibility for any use of the content presented and any consequences of that use. Anyone acting on the information provided does so at their own risk.