
- Contact Us:
-

-

-

-


Daily Market Updates
14 Nov 2023
USDJPY
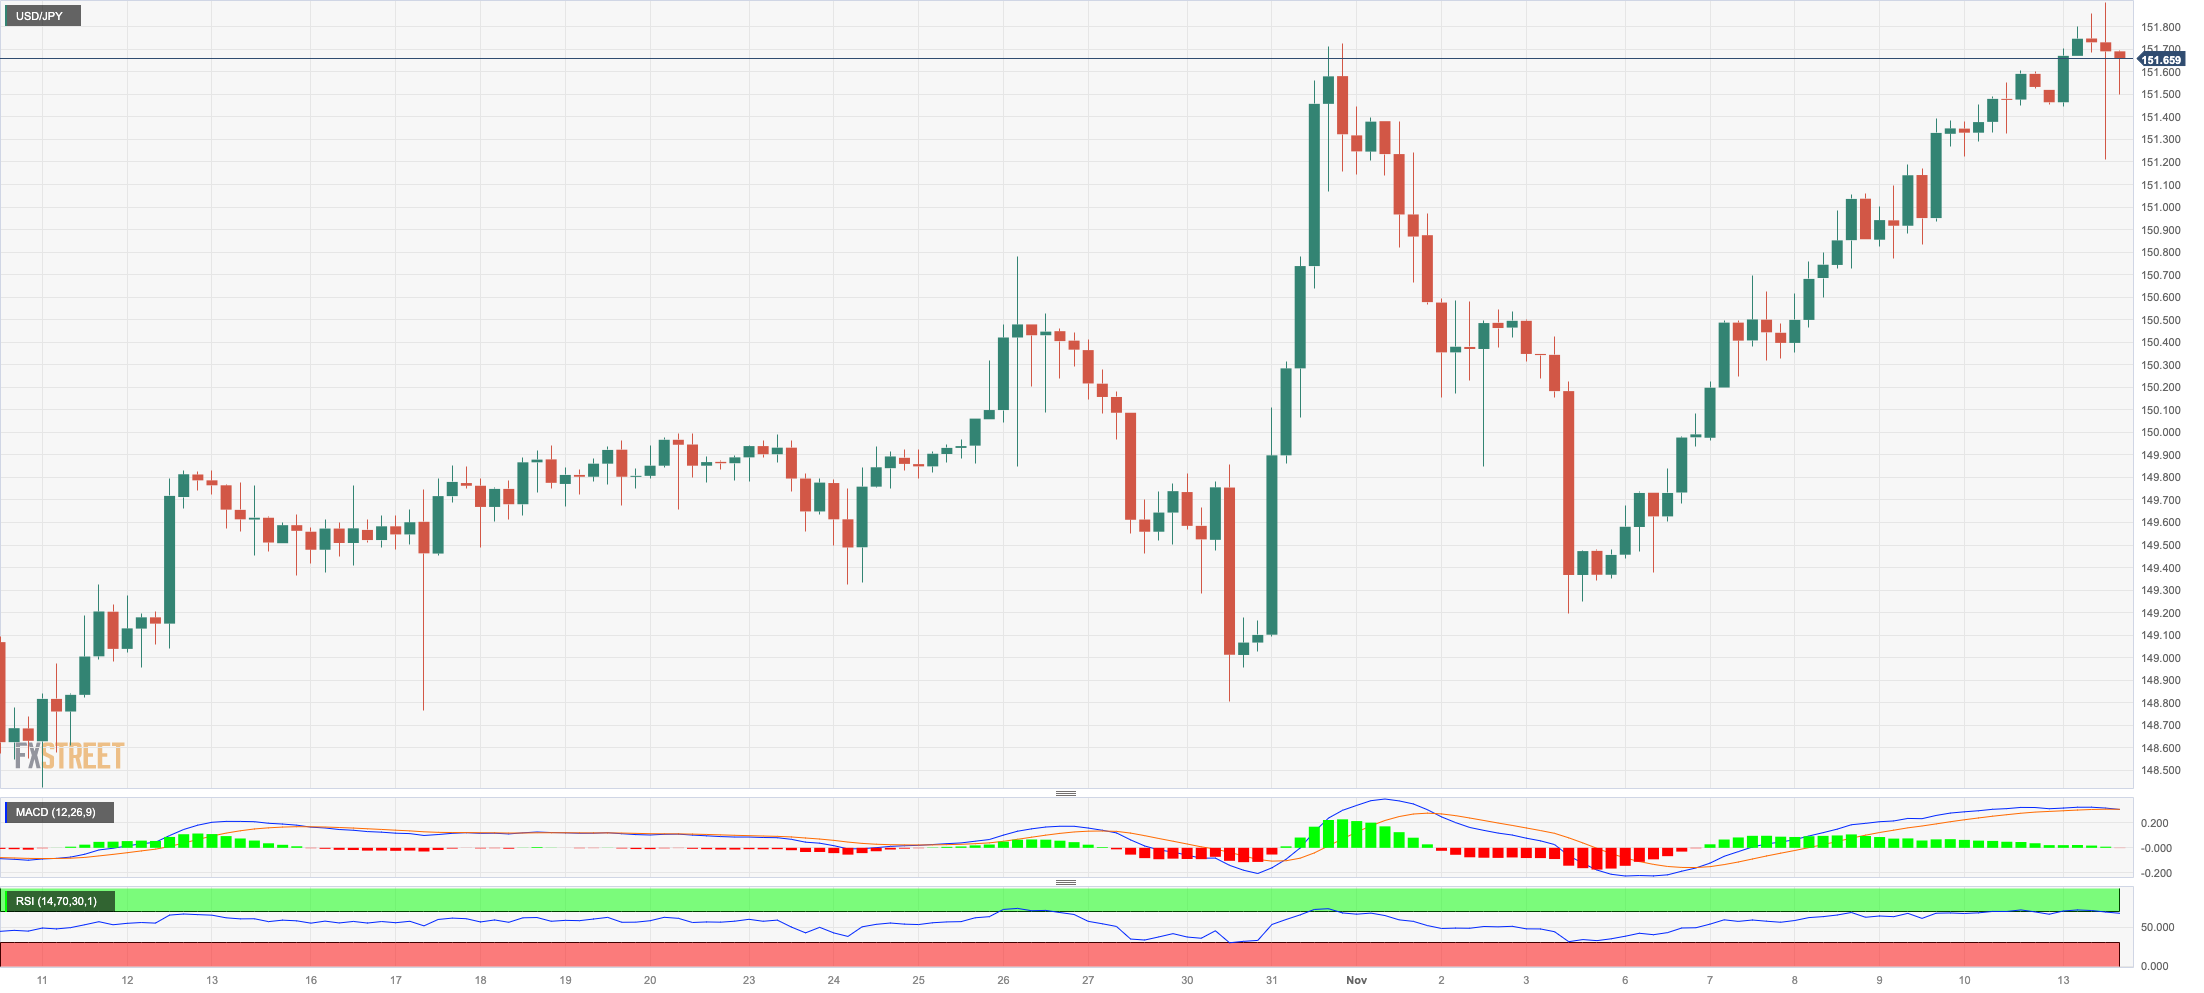
The rally in USD/JPY remained everything but abated for yet another session on Monday.
That said, spot advanced to new yearly highs around 151.90 in an atmosphere of mild downside pressure in the greenback and lack of traction in US yields vs. a humble advance in the JGB 10-year yields.
Naturally, the persistent appreciation of the yen sparked intervention fears as the pair crept to the 152.00 yardstick, an area last traded in October 2022. On this, Japan’s finmin Suzuki stated that sudden FX movements are undesirable and emphasized that foreign exchange rates should be determined by fundamentals. He mentioned that they would monitor the markets closely and respond promptly with a sense of urgency.
In the docket, Producer Prices contracted at a monthly 0.4% in October and rose 0.8% from a year earlier. In addition, Machine Tool Orders contracted at an annualized 20.6% in October.
If the USD/JPY breaks above the 2023 high of 151.87 (November 13), it may then test the 2022 top of 151.94 (October 21), which would be quickly followed by the round level of 152.00. The 55-day SMA, at 148.91, appears to be a provisional support level, ahead of the weekly low of 148.16 (October 10) and the October low of 147.27 (October 3). The weekly low of 145.89 (September 11) comes next prior to the September low of 144.43 (September 1). Down from here, there are no substantial support levels until the August low of 141.50 (August 7), which is prior to the 200-day SMA of 140.98 and the July low of 137.23 (July 14). On the daily chart, the RSI flirted with the 62 mark.
Resistance levels: 151.90 151.94 152.00 (4H chart)
Support levels: 150.74 150.29 149.84 (4H chart)
GBPUSD
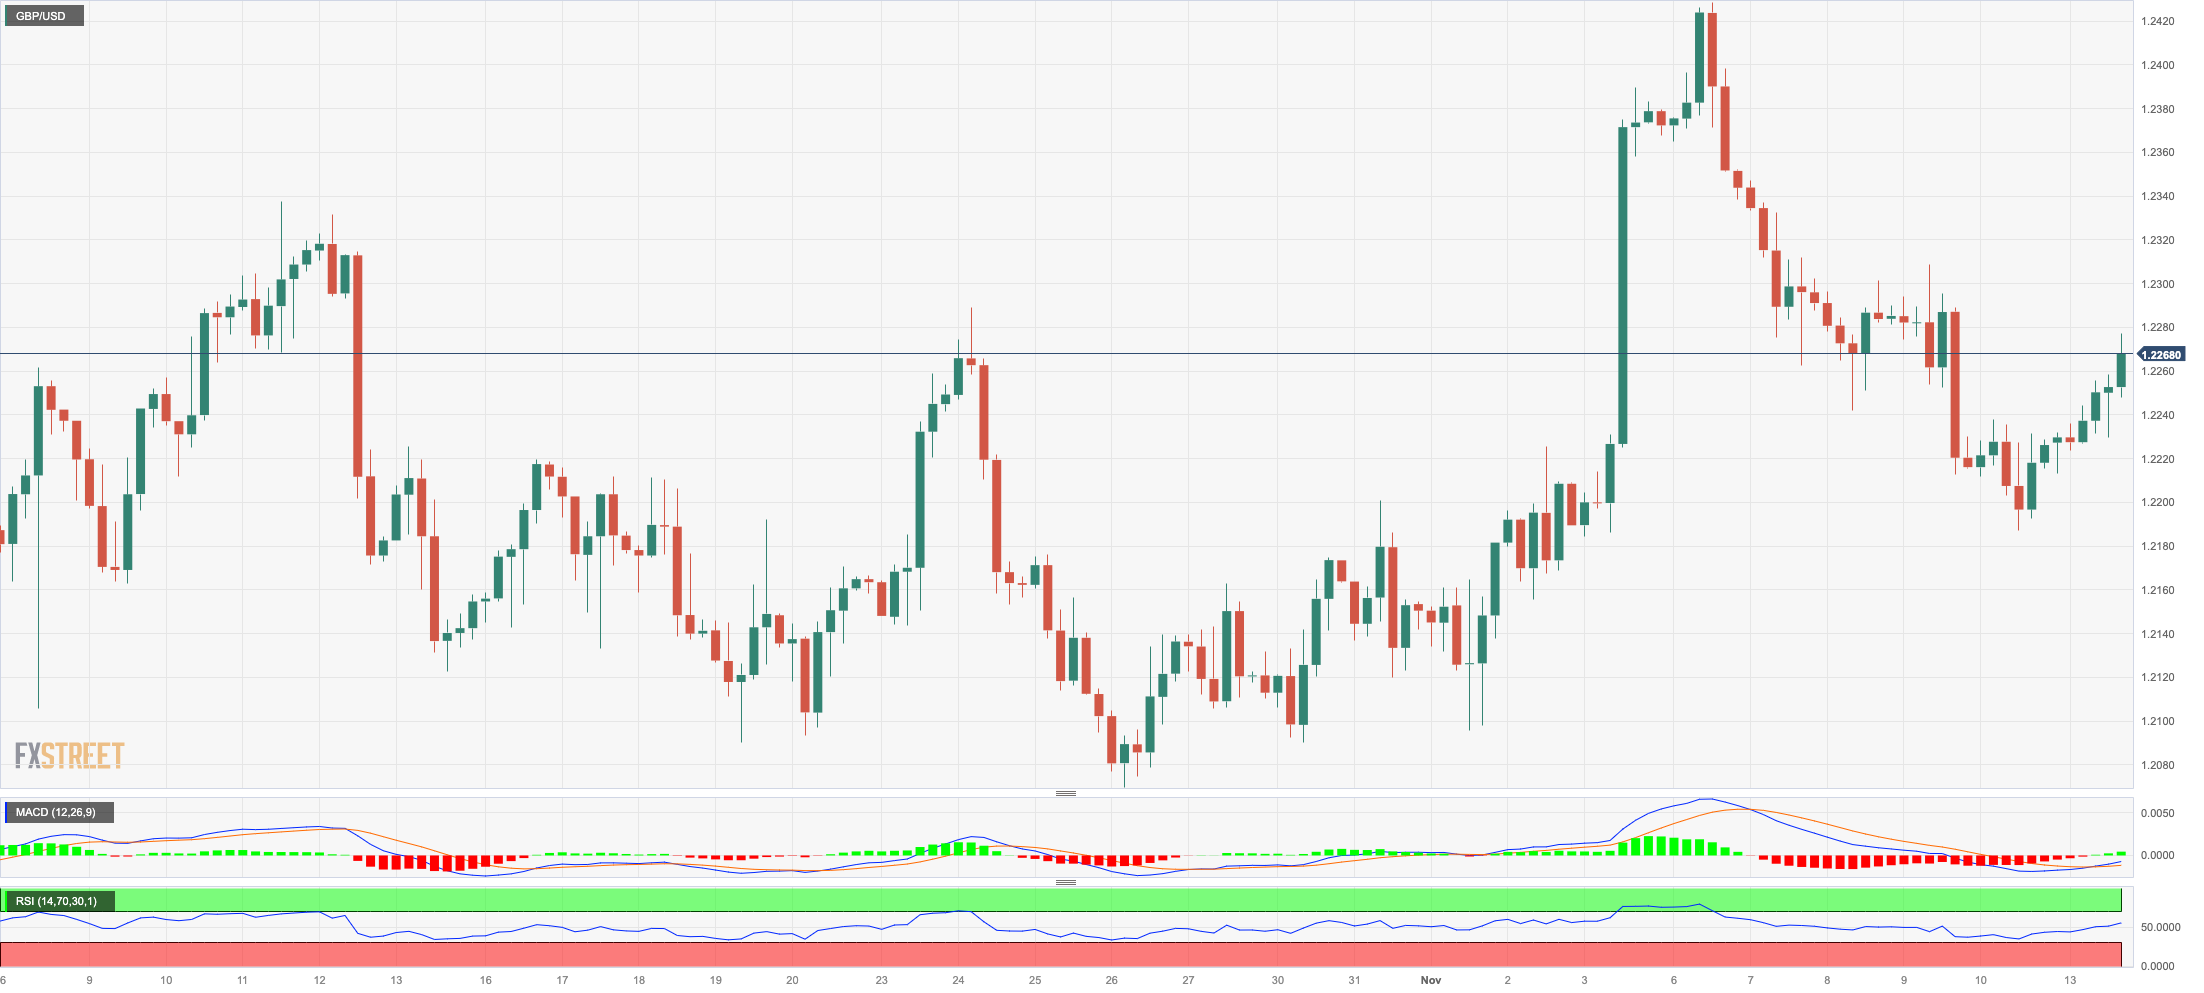
In line with the broad-based upbeat mood in the risk-linked galaxy, GBP/USD added to Friday’s gains and revisited the upper-1.2200s at the beginning of the week.
The modest pullback in the greenback underpinned the positive price action in the British pound, which found another source of strength after former UK PM D. Cameron returned to the government as foreign secretary.
Absent data releases across the Channel on Monday, investors’ attention is expected to be on the publication of the UK labour market report on Tuesday.
A further decline may push GBP/USD to the weekly low of 1.2069 (October 26) before the October low of 1.2037 (October 3), which is barely over the important 1.2000 barrier, and before the 2023 bottom of 1.1802 (March 8). In contrast, the November high of 1.2428 looks to be supported by the crucial 200-day SMA of 1.2434, and it comes ahead of the weekly top of 1.2548 (11 September). Following that, the weekly peaks of 1.2746 (August 30), 1.2818 (August 10), and 1.2995 (July 27) are expected, all of which come before the psychological 1.3000 level. The RSI for the day advanced to the boundaries of 53.
Resistance levels: 1.2308 1.2428 1.2548 (4H chart)
Support levels: 1.2187 1.2095 1.2069 (4H chart)
AUDUSD
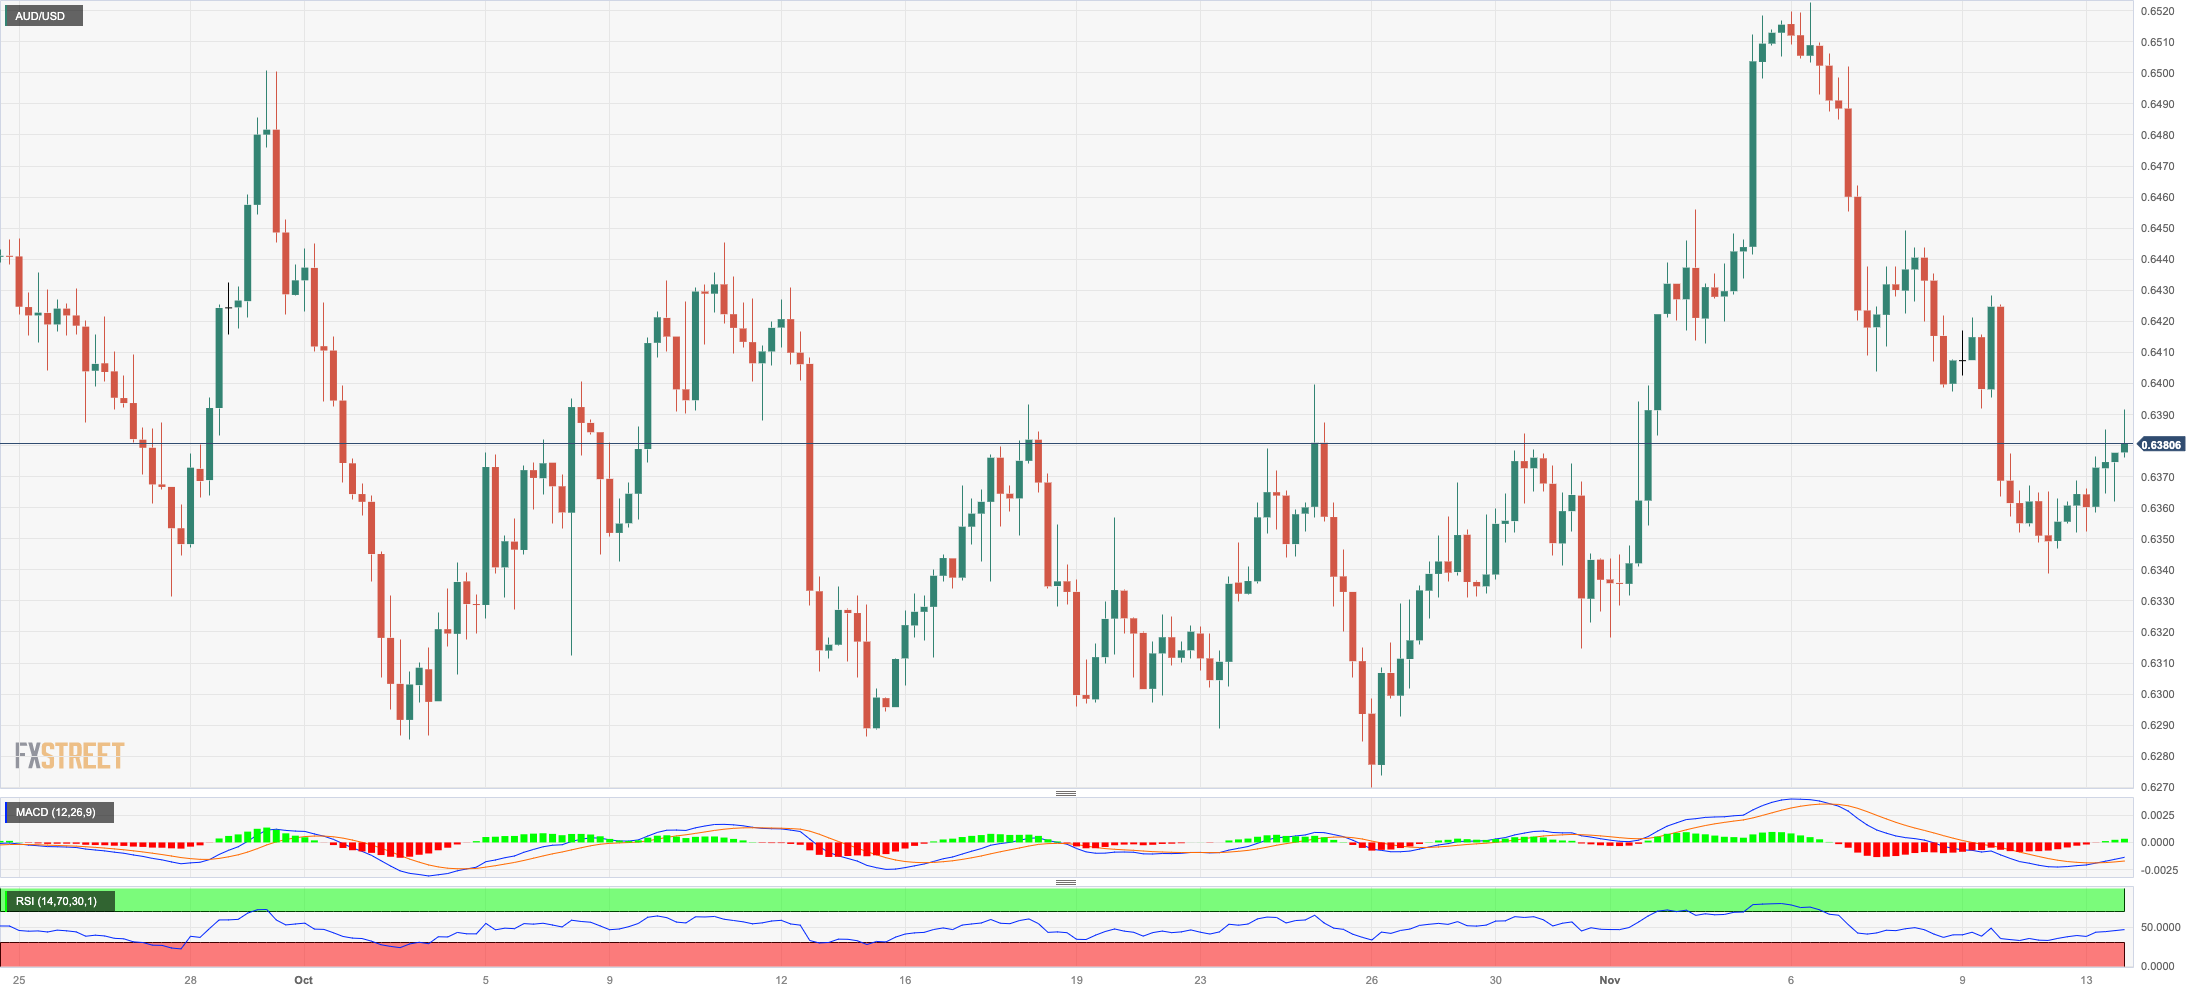
After five consecutive daily pullbacks, AUD/USD managed to regain some composure and kicked off the week with decent gains, revisiting the 0.6390 region on Monday.
The daily gains in the Aussie dollar came despite the modest advance in the greenback, while meeting extra wings in the positive performance from copper prices and iron ore as well as firmer-than-expected New Yuan Loans in October (CNY738.4B).
Around the RBA, Deputy Governor Kohler said that inflation remains too elevated and issued a warning that the next stage is likely to be more protracted than the initial phase.
If sellers maintain control, the AUD/USD may hit the 2023 bottom of 0.6270 (October 26), followed by the round level of 0.6200 and the 2022 low of 0.6169 (October 13). Instead, the pair should first target the November high of 0.6522 (November 6), before going on to the 200-day SMA at 0.6601 seconded by the weekly top of 0.6616 (August 10). To the north, the July peak of 0.6894 (July 14), the June high of 0.6899 (June 16), and the critical 0.7000 level may be found. The daily RSI rose to the proximity of the 50 threshold.
Resistance levels: 0.6391 0.6449 0.6522 (4H chart)
Support levels: 0.6361 0.6338 0.6314 (4H chart)
GOLD
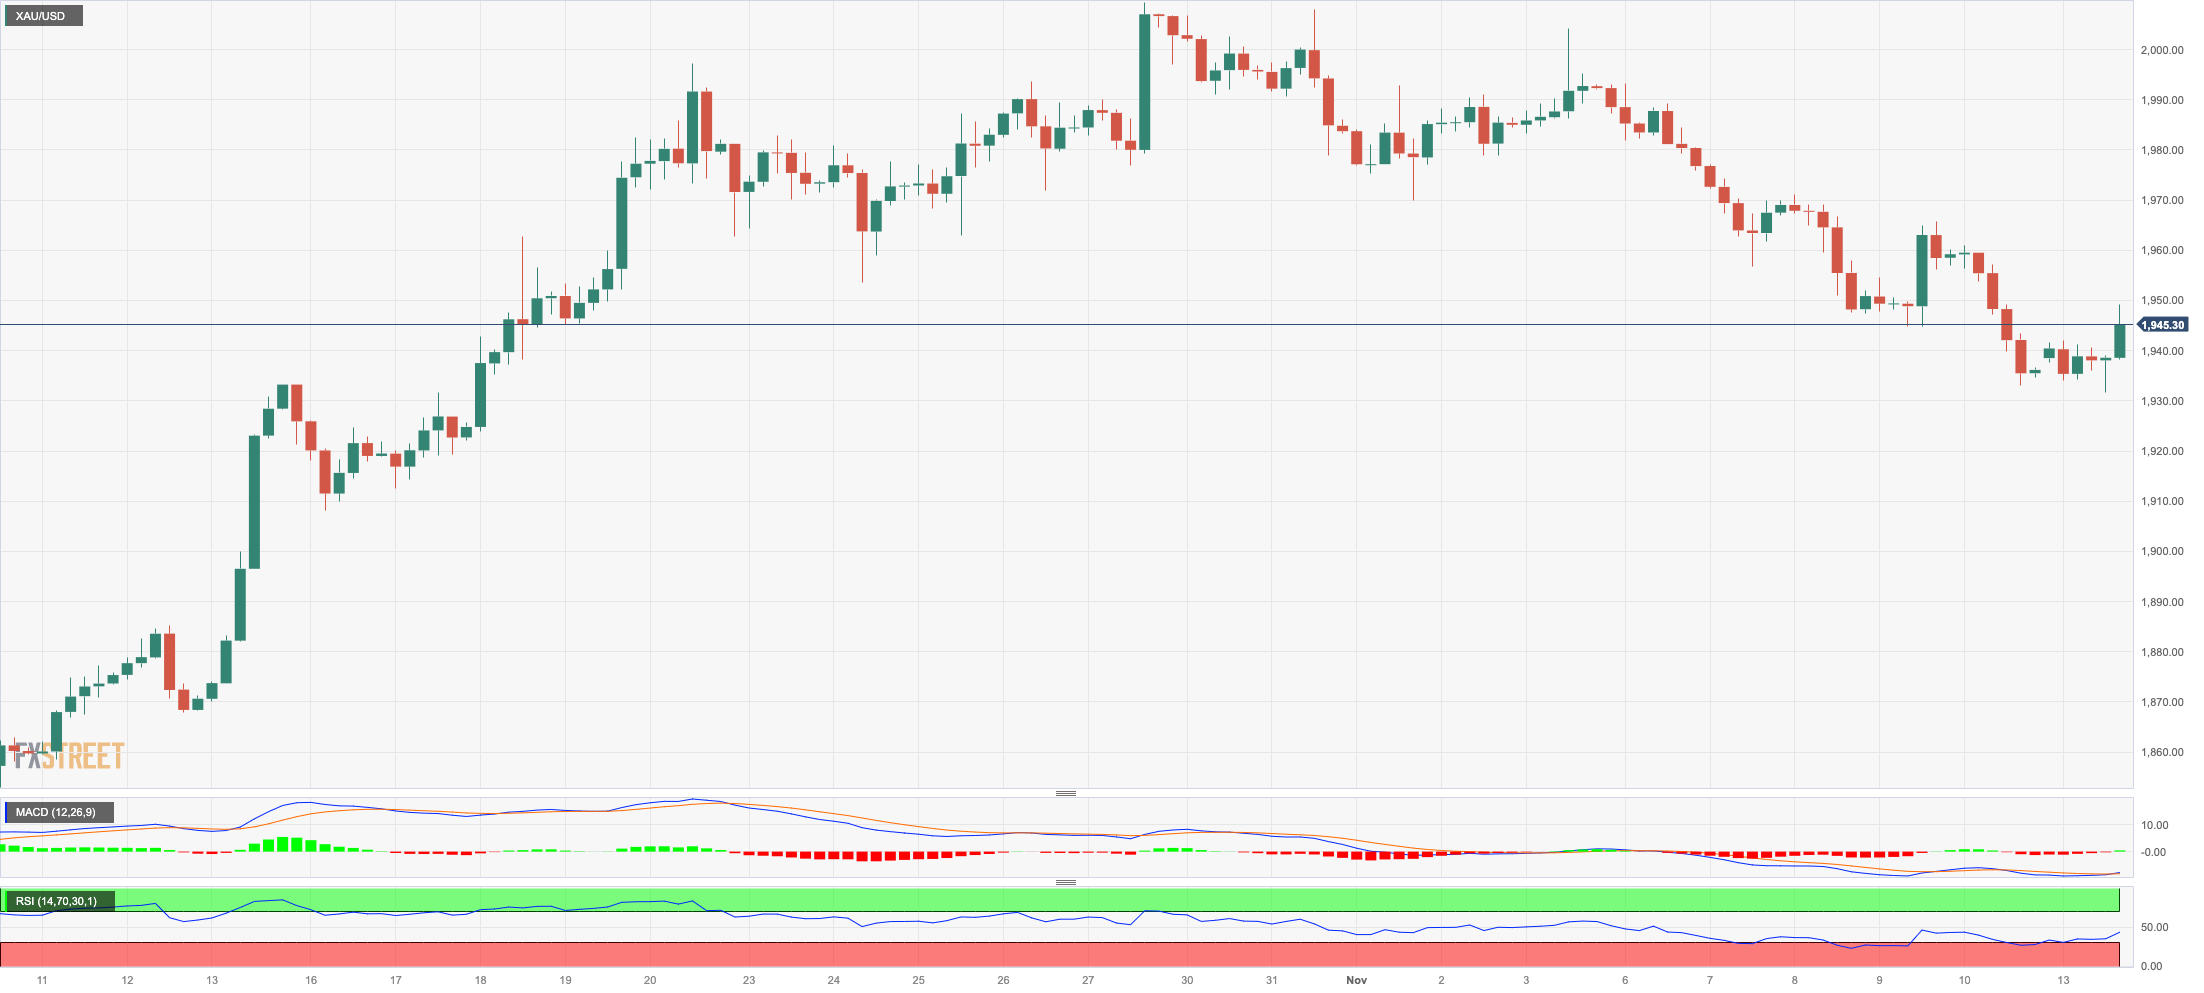
After a brief drop to four-week lows near $1930, gold prices managed to regain some traction and rise to the $1950 region per troy ounce at the beginning of the week.
The late decline in the greenback, in combination with the change of direction in US yields across different maturities, lent fresh legs to the precious metal and sponsored an auspicious start to the week.
Soon, bullion is anticipated to closely track the announcement of US inflation data on November 14. This comes as there is a continuing difference between the market's belief that the Fed has finished raising interest rates and the recent hawkish remarks made by some Fed officials.
If selling pressure increases, gold may go below the November low of $1931 (November 13), which is just ahead of the preliminary 55-day SMA of $1924. The October low of $1810 (October 6) and the 2023 bottom of $1804 (February 28) are all south of here prior to the key contention area around $1800. On the upside, the $2009 high (October 27) looks to be the immediate upward barrier, followed by the 2023 top of $2067 (May 4) and the 2022 peak of $2070 (March 8). The breakout of the latter could put a visit to the all-time high of $2075 (August 7, 2020) back on the radar.
Resistance levels: $1948 $1965 $2009 (4H chart)
Support levels: $1931 $1924 $1908 (4H chart)
CRUDE WTI
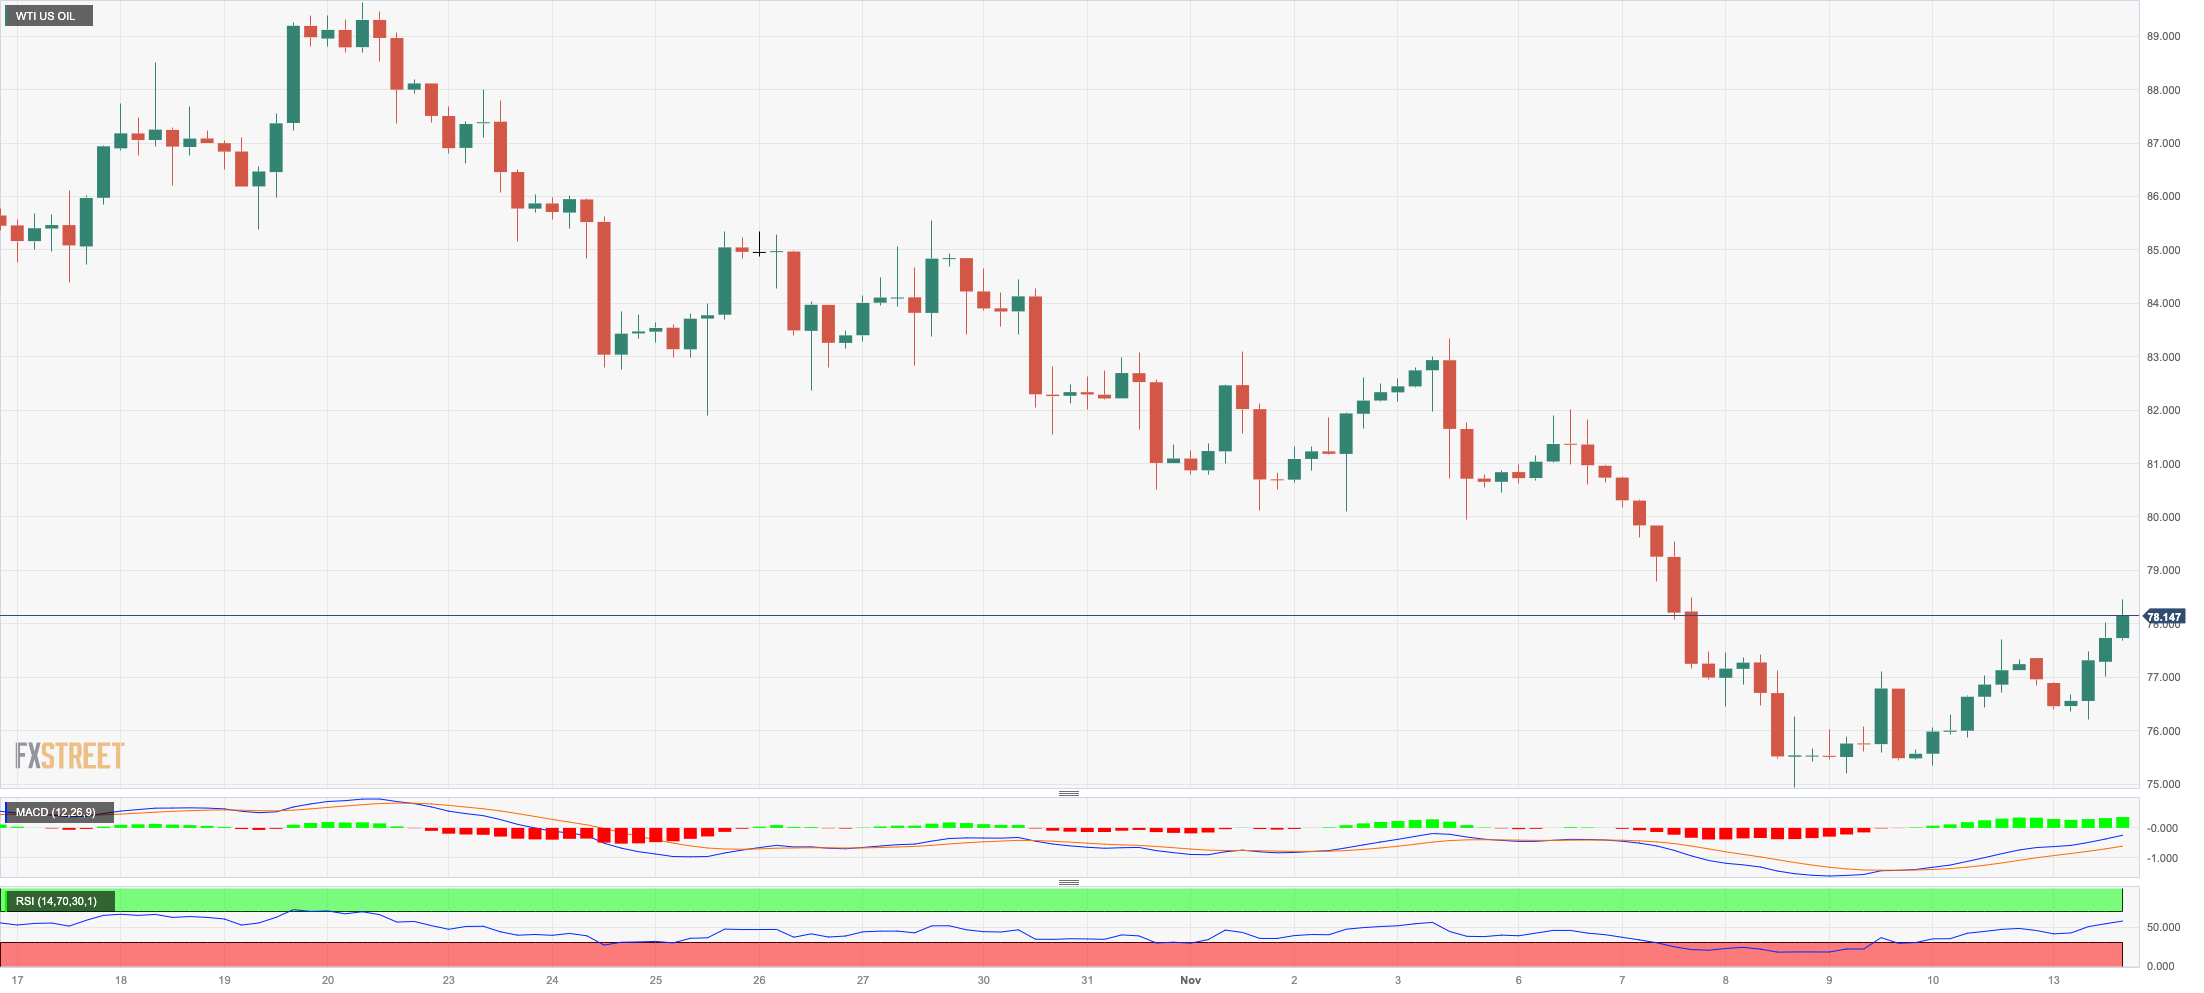
Prices of WTI added to Friday’s bounce and regained the area beyond the $78.00 mark per barrel as well as the critical 200-day SMA ($78.13).
The continuation of the recovery in prices of crude oil came in response to upbeat forecasts from OPEC released on Monday. In fact, the cartel poured cold water over demand concerns after it made a modest upward revision to its projection for the expansion of worldwide oil demand in 2023 while retaining its relatively elevated prediction for 2024.
Traders, in the meantime, seem to have left behind, albeit momentarily, worries surrounding the economic recovery in China as well as the potential continuation of the Fed’s tightening bias.
Further north for WTI emerges the November high of $80.15 (November 3) and the provisional 55-day SMA at $85.65. Extra gains could revisit the weekly top of $89.83 (October 18) prior to the 2023 peak of $94.99 (September 28). In addition, another weekly high emerges at $97.65 (August 30, 2022) ahead of the psychological $100.00 level. Just the opposite, if WTI breaches the November low of $74.96 (November 10) it may then revisit the weekly low of $73.89 (July 17), ahead of the critical $70.00 mark per barrel. The June low of $66.85 (June 12) is lower and comes before the 2023 low of $63.61 (May 4) and the crucial yardstick of $60.00.
Resistance levels: $78.49 $83.56 $85.85 (4H chart)
Support levels: $74.88 $73.81 $70.18 (4H chart)
GER40
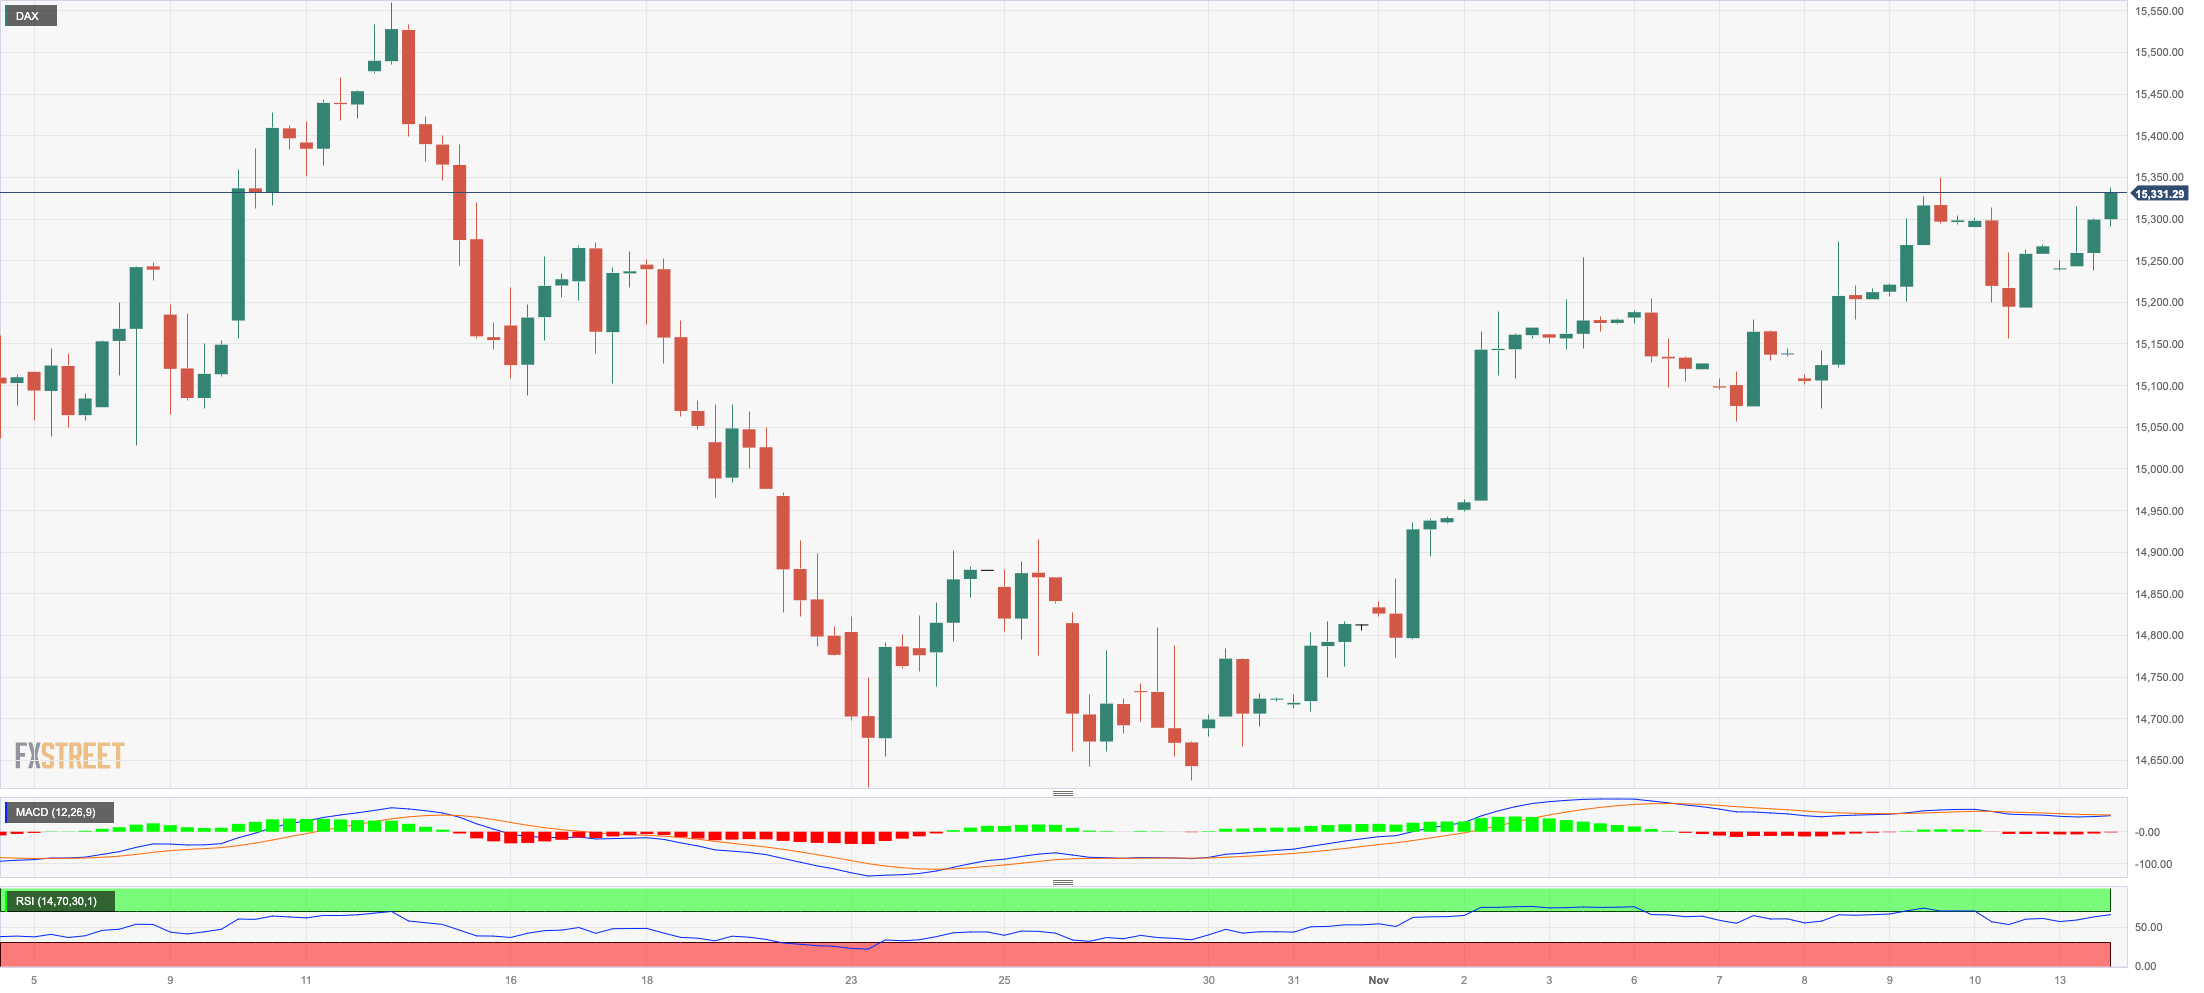
The key German benchmark DAX40 resumed the uptrend and flirted once again with the area of multi-week highs around 15300, where the transitory 55-day SMA also sits.
The move higher in the index was in tandem with the broad-based bullish mood in the rest of the European markets at an auspicious start to the week, which also saw former UK PM D. Cameron return to politics as foreign secretary under R. Sunak’s administration.
The resumption of the uptrend in the DAX40 also came in contrast to the decline in the 10-year bund yields, this time revisiting the 2.70% region.
The DAX40's immediate upward targets include the November high of 15364 (November 9), seconded by the October top of 15575 (October 12), and the crucial 200-day SMA of 15645. After clearing the latter, the index may challenge the September peak of 15989 (September 15), followed by weekly highs of 16042 (August 31) and 16060 (August 10). A likely visit to the all-time top of 16528 (July 31) may loom on the horizon farther up. Instead, the index might be dragged to the October low of 14630 (October 23) before hitting the March low of 14458 (March 20). Following that is the December 2022 low of 13791 (December 20), ahead of the September 2022 low of 11862 (September 20). The
Best Performers: Siemens Energy AG, Fresenius SE, Rheinmetall AG
Worst Performers: Sartorius AG VZO, E.ON SE, Zalando SE
Resistance levels: 15364 15425 15575 (4H chart)
Support levels: 15068 14999 14630 (4H chart)
NASDAQ
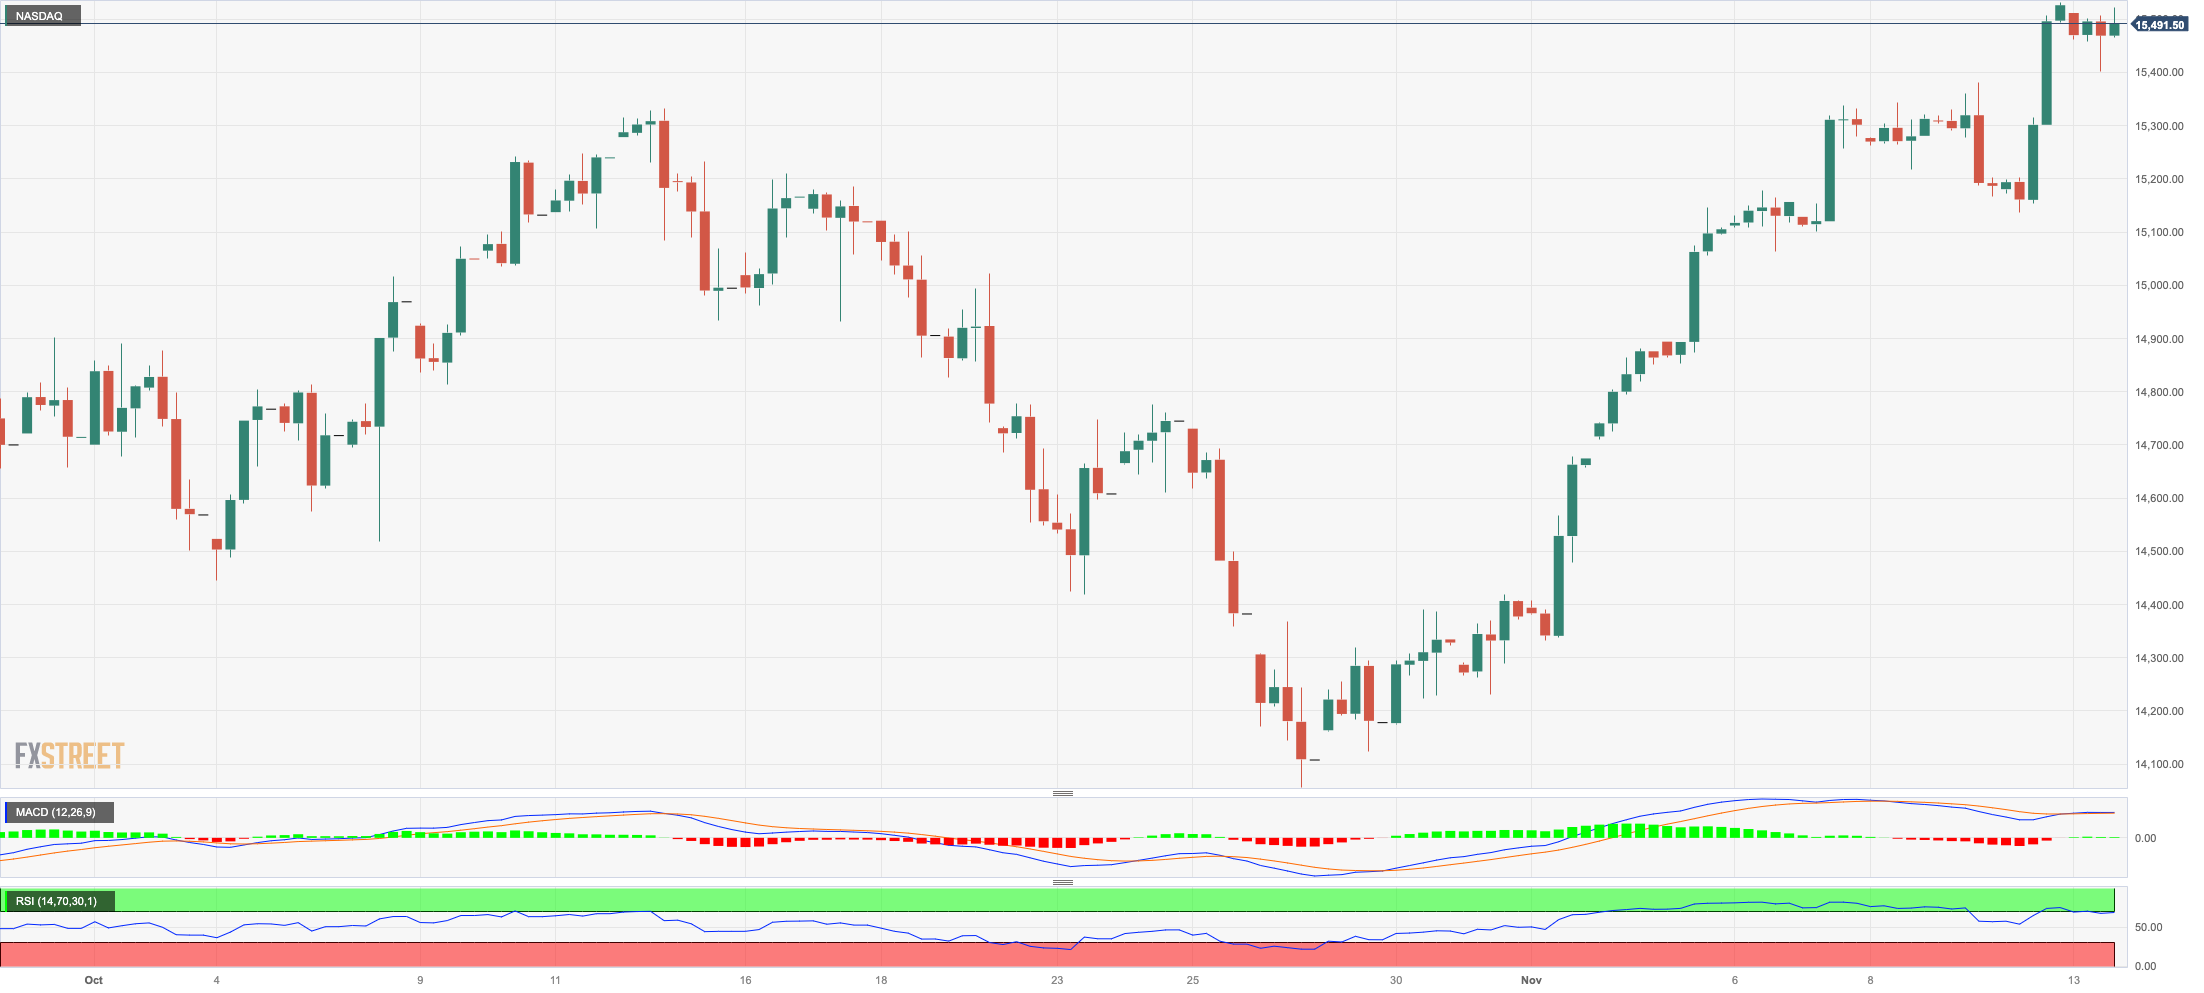
US tech stocks retreated from Friday’s peaks and revisited the area below 15500 when measured by the reference Nasdaq 100 on Monday.
Investors’ prudence ahead of the release of US CPI on Tuesday as well as some profit-taking in light of the steep upside seen since late October appear to have prompted the knee-jerk in the index, while the weaker dollar and the lack of direction in US yields seem to have limited the downside somewhat.
Further Nasdaq gains might push the index up to the November peak of 15535 (November 10) prior to the September high of 15618 (September 1), which comes before the 2023 top of 15932 (July 19) and the round milestone of 16000. On the opposite side, immediate support looks to be around the provisional 55-day SMA at 14993 ahead of the key 200-day SMA of 14110, which is closely followed by the October low of 14058 (October 26). This zone's collapse might return us to the April bottom of 12724 (April 25), ahead of the March low of 11695 (March 13) and the 2023 low of 10696 (January 3). The day-to-day RSI eased below 64.
Top Gainers: DexCom, Lucid Group, Tesla
Top Losers: Illumina, Warner Bros Discovery, American Electric Power
Resistance levels: 15535 15618 15803 (4H chart)
Support levels: 15100 14888 14058 (4H chart)
DOW JONES
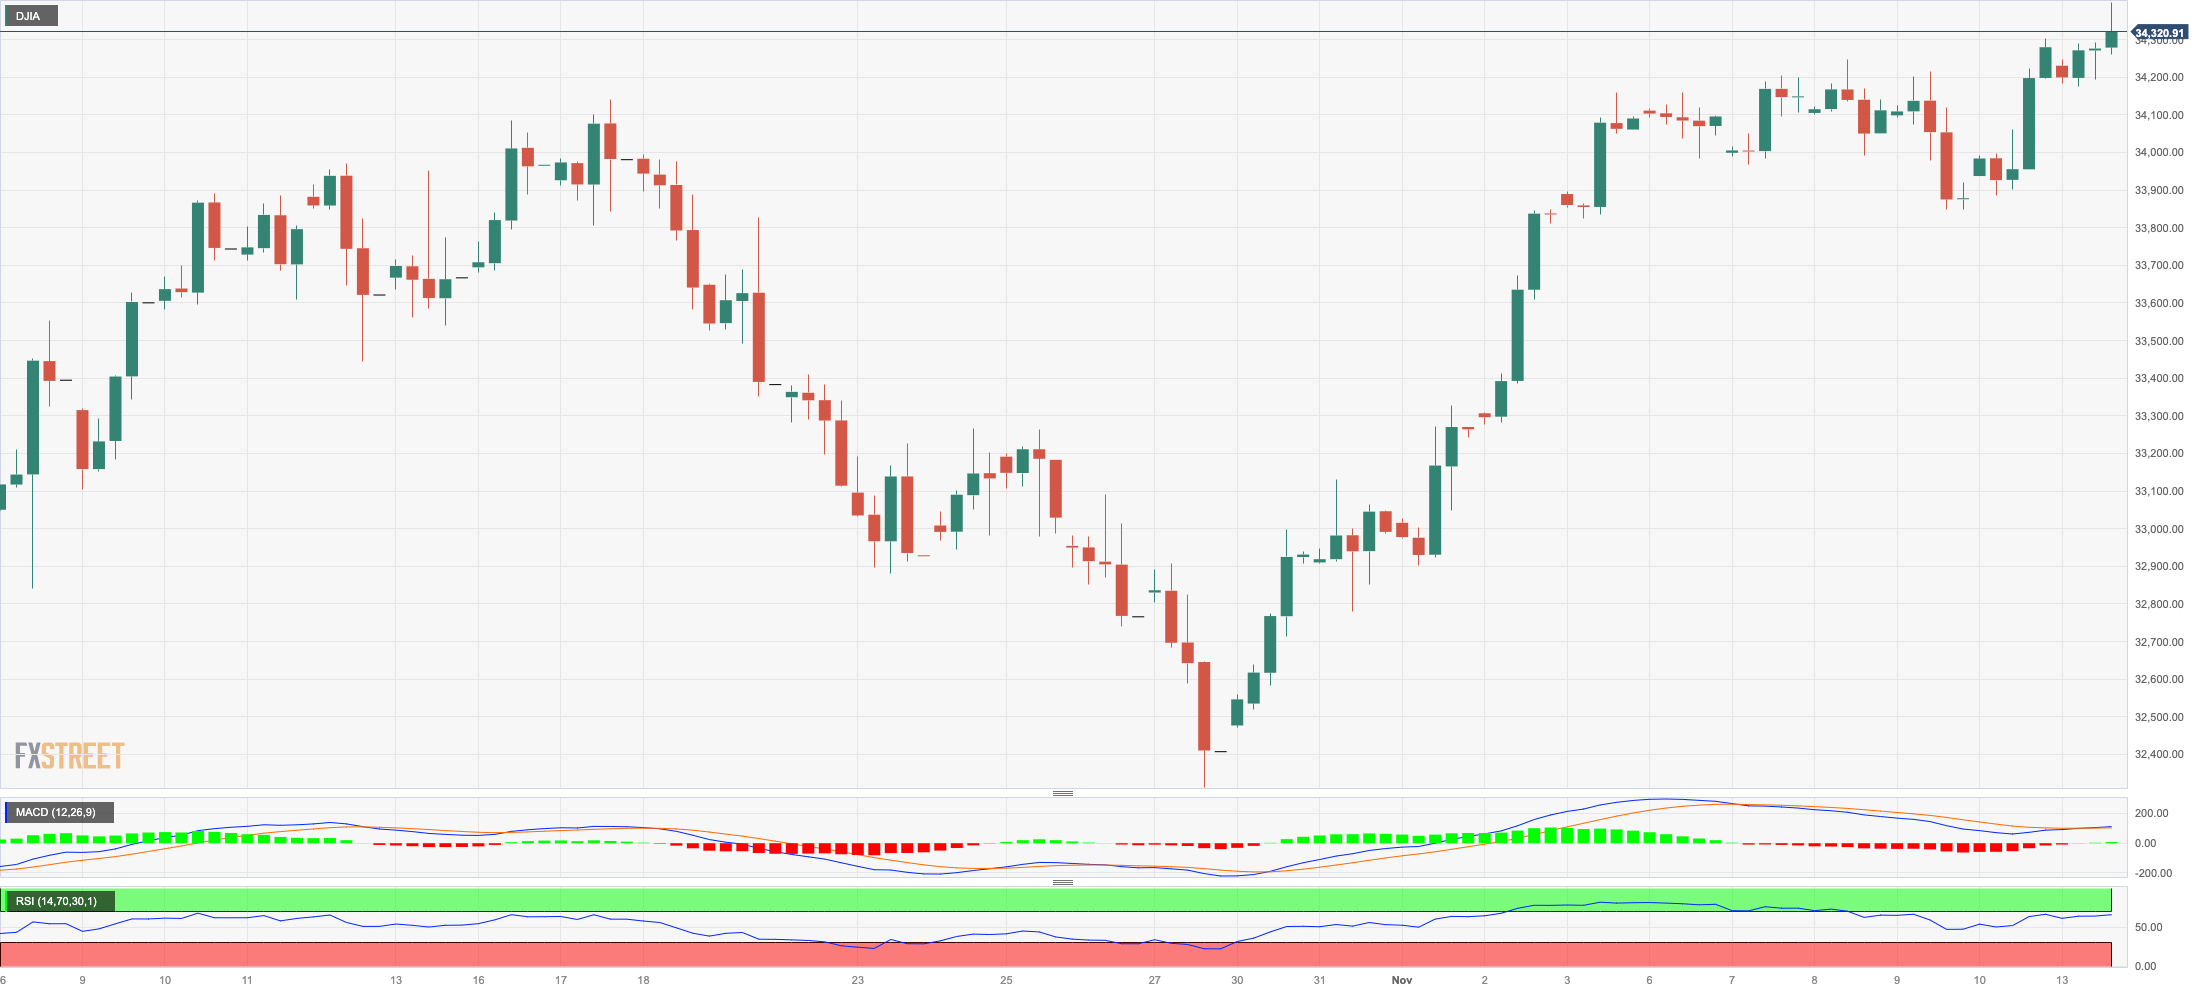
US equities tracked by the Dow Jones added to Friday’s gains and advanced to new two-month highs around 34400 at the beginning of the week.
The second straight session of gains in the blue-chip index came despite investors’ cautiousness ahead of the publication of US inflation figures on Tuesday, offsetting at the same time the negative news after agency Moody’s revised lower the US credit rating to negative (from stable).
All in all, the Dow Jones rose 0.13% to 34328, the S&P500 dropped 0.10% to 4410, and the tech-focused Nasdaq Composite retreated 0.20% to 13770.
The surpass of the November peak of 34405 should prompt the Dow Jones to challenge the September high of 34977 (September 14), which emerges just ahead of the weekly top of 35070 (August 31). Once cleared, the index might confront the 2023 peak of 35679 (August 1). On the flip side, the key 200-day SMA is expected to offer initial contention at 33816 ahead of the October low of 32327 (October 27). Down from here aligns the 2023 bottom of 31429 (March 15) and the 2022 low of 28660 (October 13). The daily RSI advanced past 61.
Top Performers: Boeing, Walt Disney, Caterpillar
Worst Performers: Intel, Nike, Home Depot
Resistance levels: 34405 34977 35070 (4H chart)
Support levels: 33859 33539 32327 31429 (4H chart)
MACROECONOMIC EVENTS

All Information & Updates provided by:

All information relating to the financial markets available on this page has been prepared and issued by FXStreet (Forexstreet SL, Spain, Reg: B62498233) on the basis of publicly available information and all information believed to be reliable and does not conflict with Kuwaiti local laws, and all necessary care has been taken to before the company to ensure that the facts mentioned are correct from the source.
NCM Investment nor any of its directors or employees shall in any way be held responsible for the contents of this news, and the information contained on this page is intended only to provide clients with publicly available information and should not be construed as investment advice, report or analysis and/or constitute an offer or invitation to buy or sell financial instruments of any kind.
RISK WARNING: Forex and CFDs are highly risky leveraged products, as losses can exceed deposits. Please ensure you understand all the risks and take independent advice if necessary. NCM will segregate the clients based on the criteria of the regulator and its bylaws. NCM does not provide any advisory service; the material published does not constitute advice or a recommendation for a transaction in any financial instrument. NCM accepts no responsibility for any use of the content presented and any consequences of that use. Anyone acting on the information provided does so at their own risk.