
- Contact Us:
-

-

-

-


Daily Market Updates
15 Nov 2023
USDJPY
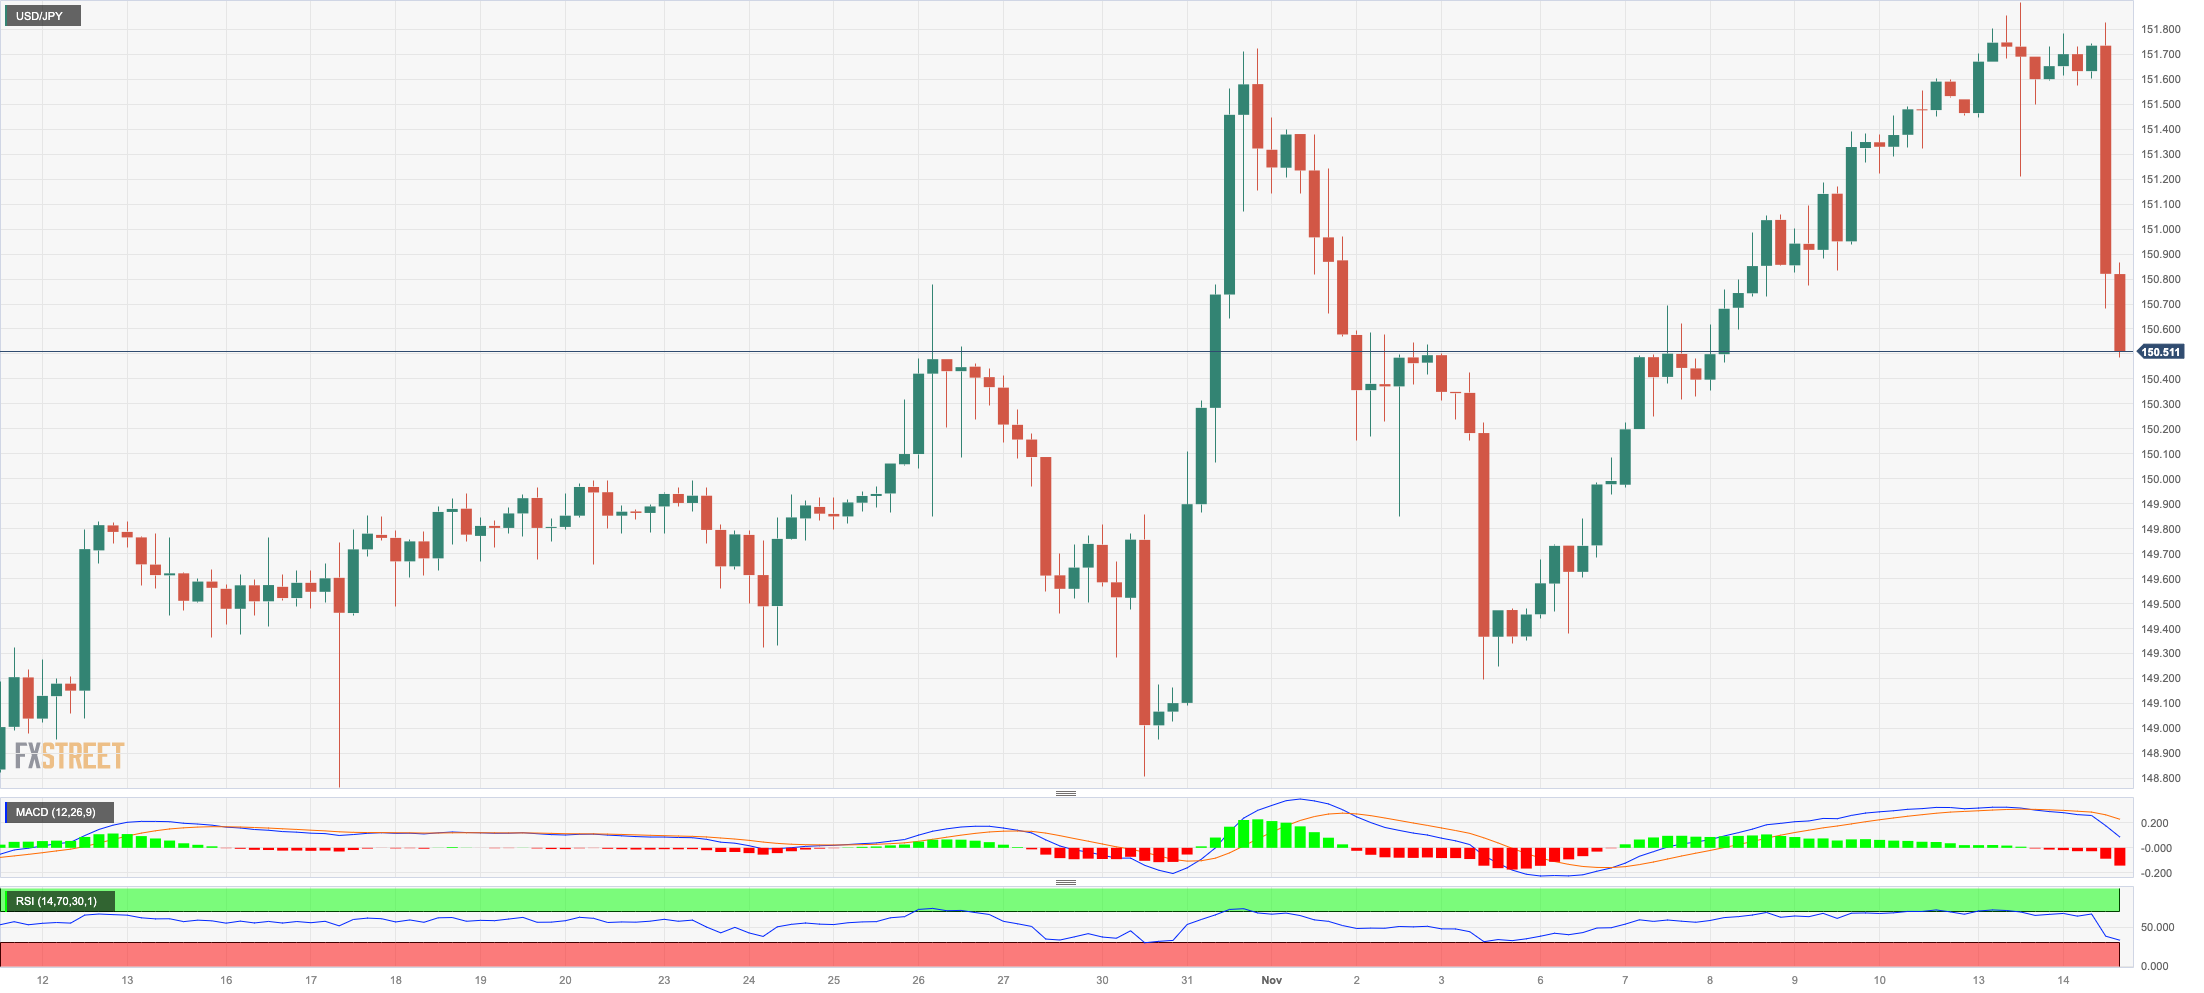
USD/JPY dropped markedly in response to the sharp retracement in the greenback, which was especially magnified following weaker-than-estimated US inflation figures for the month of October.
In addition, the strong decline in US yields across the curve also accompanied the knee-jerk in spot along with the corrective pullback in JGB 10-year yields.
The absence of data releases in the Japanese calendar left all attention on the publication of key advanced Q3 GDP figures and final Industrial Production readings, all due on Wednesday.
If the USD/JPY breaks over the 2023 high of 151.87 (November 13), it may then challenge the 2022 top of 151.94 (October 21), which would be swiftly followed by the round level of 152.00. Just the opposite, the 55-day SMA, at 149.00, looks to be an interim support level, ahead of the weekly low of 148.16 (October 10) and the October low of 147.27 (October 3). The weekly low of 145.89 (September 11) follows next, seconded by the September low of 144.43 (September 1). There are no significant support levels down until the August low of 141.50 (August 7), which is previous to the 200-day SMA of 141.08 and the July low of 137.23 (July 14). On the daily chart, the RSI sank to the 53 region.
Resistance levels: 151.90 151.94 152.00 (4H chart)
Support levels: 150.67 149.90 149.18 (4H chart)
GBPUSD
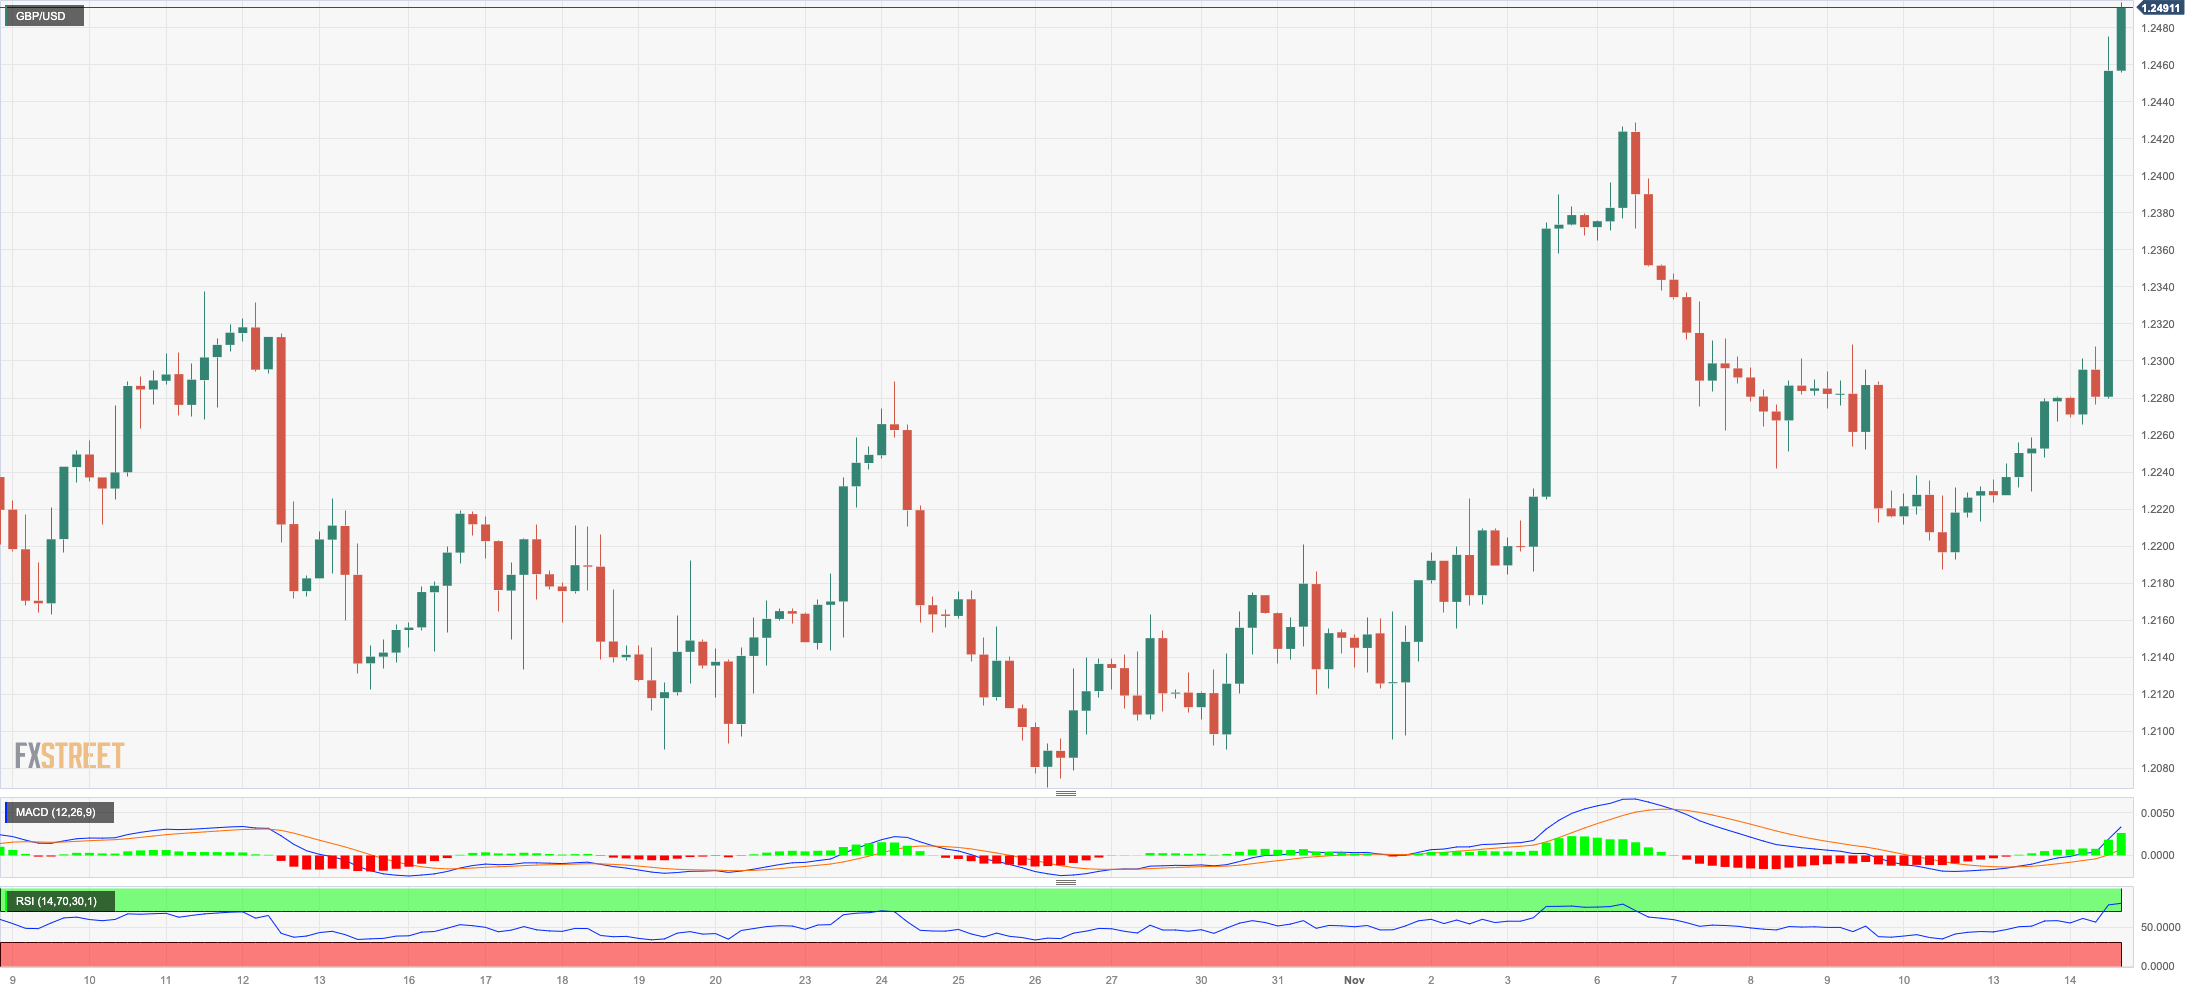
GBP/USD capitalized big time on the pronounced sell-off in the greenback and advanced to fresh nine-week highs in levels just shy of 1.2500 the figure on turnaround Tuesday.
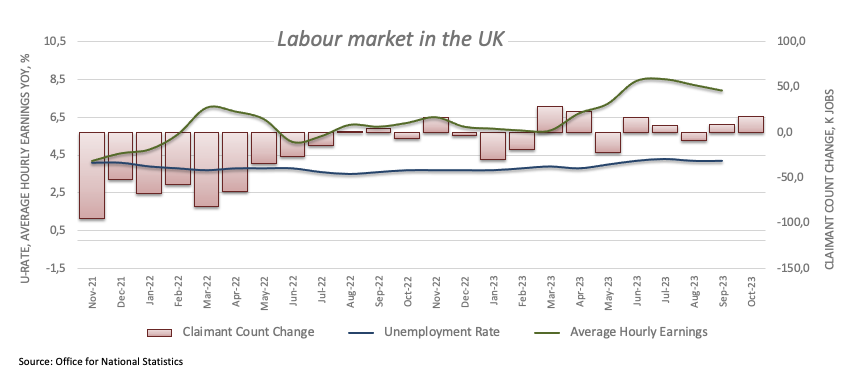
The British pound also derived extra buying interest in response to auspicious results from the UK jobs report, after Employment Change increased by 54K individuals and the jobless rate held steady at 4.2%. In addition, the Claimant Count Change went up by 17.8K people, and Average Earnings inc. Bonus rose 7.9%.
From the BoE, Chief Economist H. Pill said that they need to meet the persistence of inflation with persistent restrictiveness in policy, adding that they don't necessarily need to raise interest rates further but are prepared to do so if needed.
Extra gains could now see GBP/USD retest the provisional 100-day SMA at 1.2514 prior to the weekly high of 1.2548 (11 September). Following that, weekly tops of 1.2746 (August 30), 1.2818 (August 10), and 1.2995 (July 27) are anticipated, all before the psychological 1.3000 mark. On the flip side, there is an immediate contention at the weekly low of 1.2069 (October 26), before the October low of 1.2037 (October 3), which is just above the crucial 1.2000 barrier, and before the 2023 bottom of 1.1802 (March 8). For the day, the RSI surged past the 66 level.
Resistance levels: 1.2493 1.2548 1.2746 (4H chart)
Support levels: 1.2187 1.2095 1.2069 (4H chart)
AUDUSD
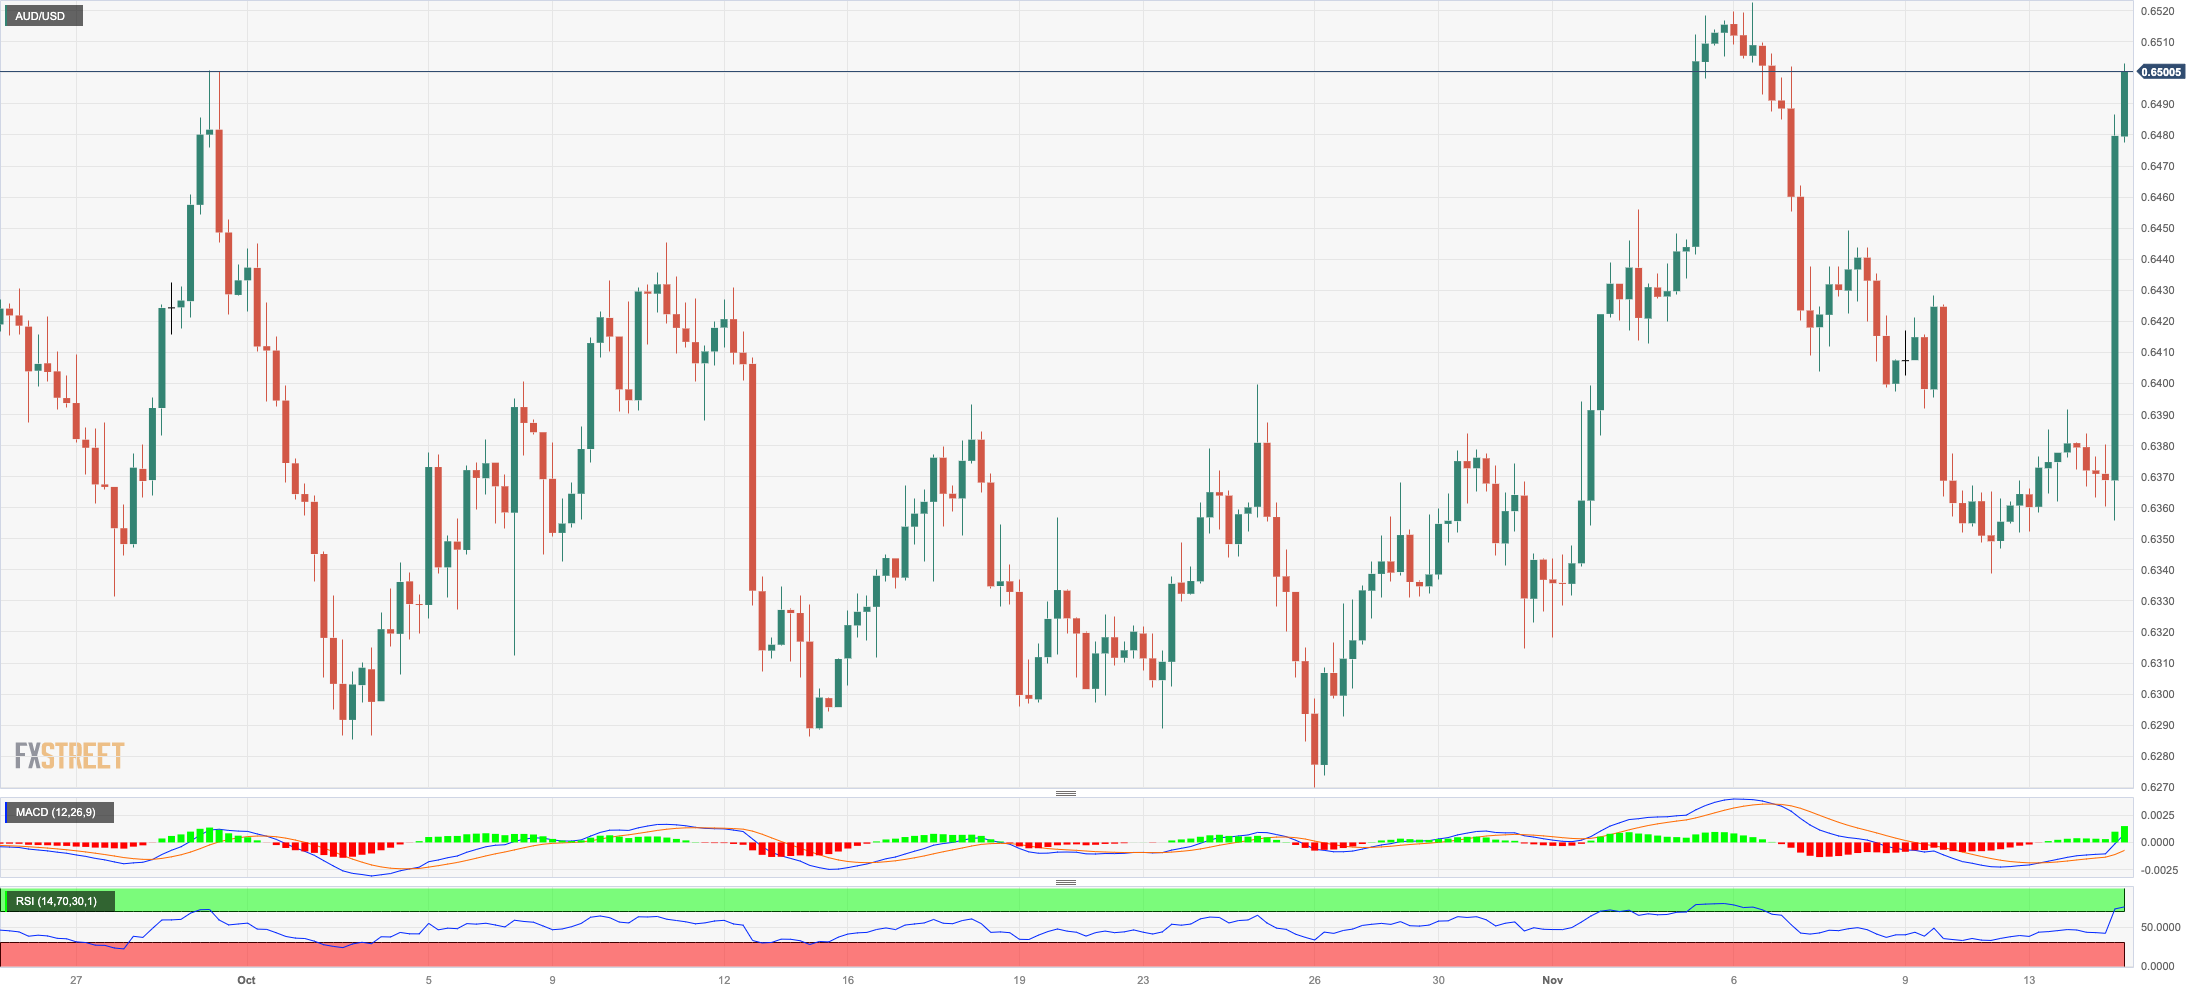
AUD/USD surged significantly and poked with the key 0.6500 region on Tuesday.
The robust climb in the Aussie dollar followed the generalized upbeat tone in the risk complex in response to the needle-like pullback in the greenback, especially after lower-than-expected US CPI reignited speculation of rate cuts by the Fed.
Extra strength for the pair also came from the broad-based strong performance of the commodity universe, where copper prices and iron ore prices built on recent gains.
In Oz, the Westpac Consumer Confidence Index eased to 79.9 for the current month.
If bulls push harder, AUD/USD could now confront the November high of 0.6522 (November 6), ahead of the 200-day SMA at 0.6599, and the weekly top of 0.6616 (August 10). The July peak of 0.6894 (July 14), the June high of 0.6899 (June 16), and the key 0.7000 threshold may be located to the north. In contrast, the 2023 low of 0.6270 (October 26) comes next prior to the round level of 0.6200, and the 2022 low of 0.6169 (October 13). The daily RSI leapt beyond 60.
Resistance levels: 0.6493 0.6522 0.6616 (4H chart)
Support levels: 0.6361 0.6338 0.6314 (4H chart)
GOLD
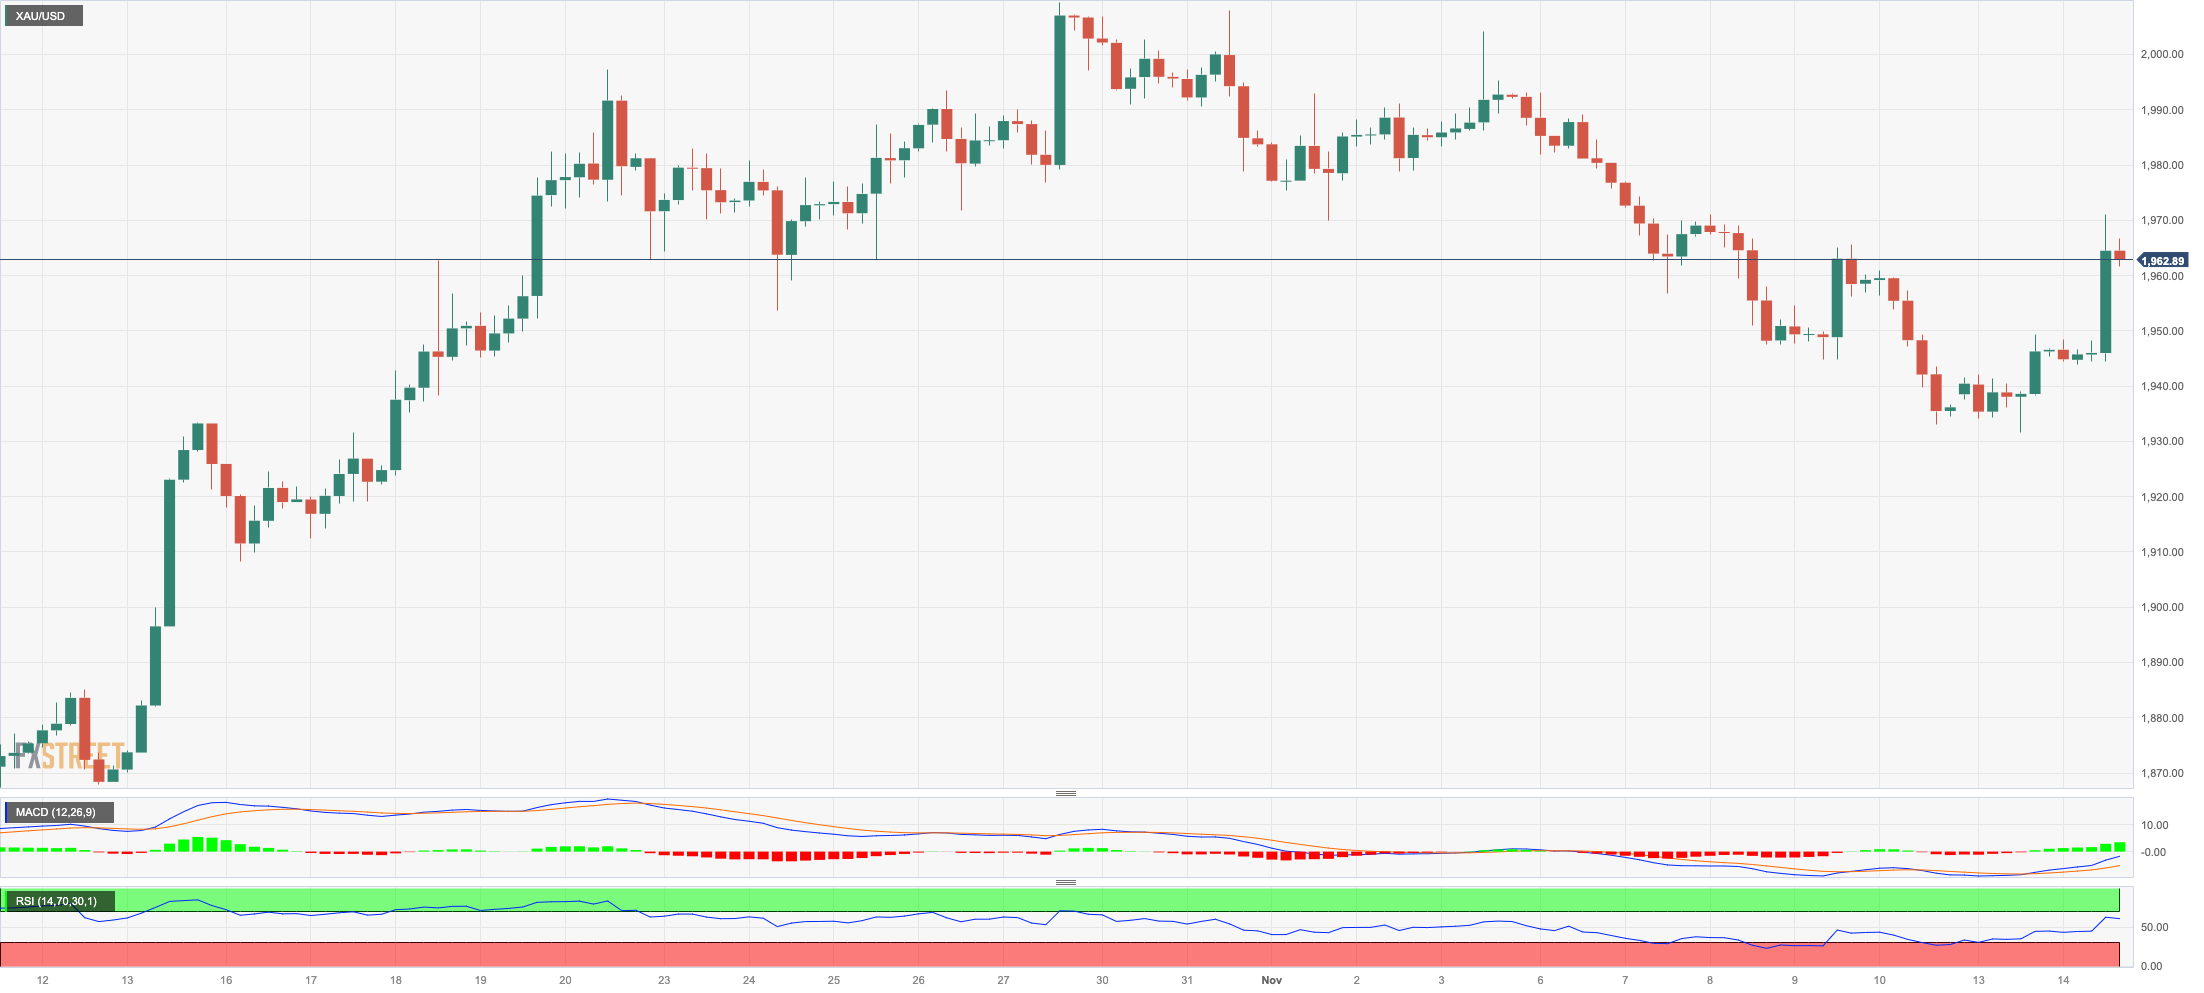
Prices of the troy ounce of the precious metal added to the auspicious start of the week and rose to multi-day highs past the $1970 level on Tuesday.
The move higher in the yellow metal came on the back of heightened weakness in the greenback and declining US yields across the curve.
In addition, discouraging US CPI prints favoured the resurgence of speculation about potential rate cuts by the Federal Reserve (likely in June–July 2024), all eventually underpinning further the uptick in bullion.
Immediately to the upside for gold now emerges the October top of $2009 (October 27) seconded by the 2023 peak of $2067 (May 4) and the 2022 high of $2070 (March 8). The breakout of the latter could put a visit to the all-time top of $2075 (August 7, 2020) back on the radar. Having said that, if selling pressure increases, gold may go below the November low of $1931 (November 13), which is just ahead of the preliminary 55-day SMA of $1925. The October low of $1810 (October 6) and the 2023 bottom of $1804 (February 28) are all south of here prior to the key contention area around $1800.
Resistance levels: $1971 $2009 $2048 (4H chart)
Support levels: $1931 $1926 $1908 (4H chart)
CRUDE WTI
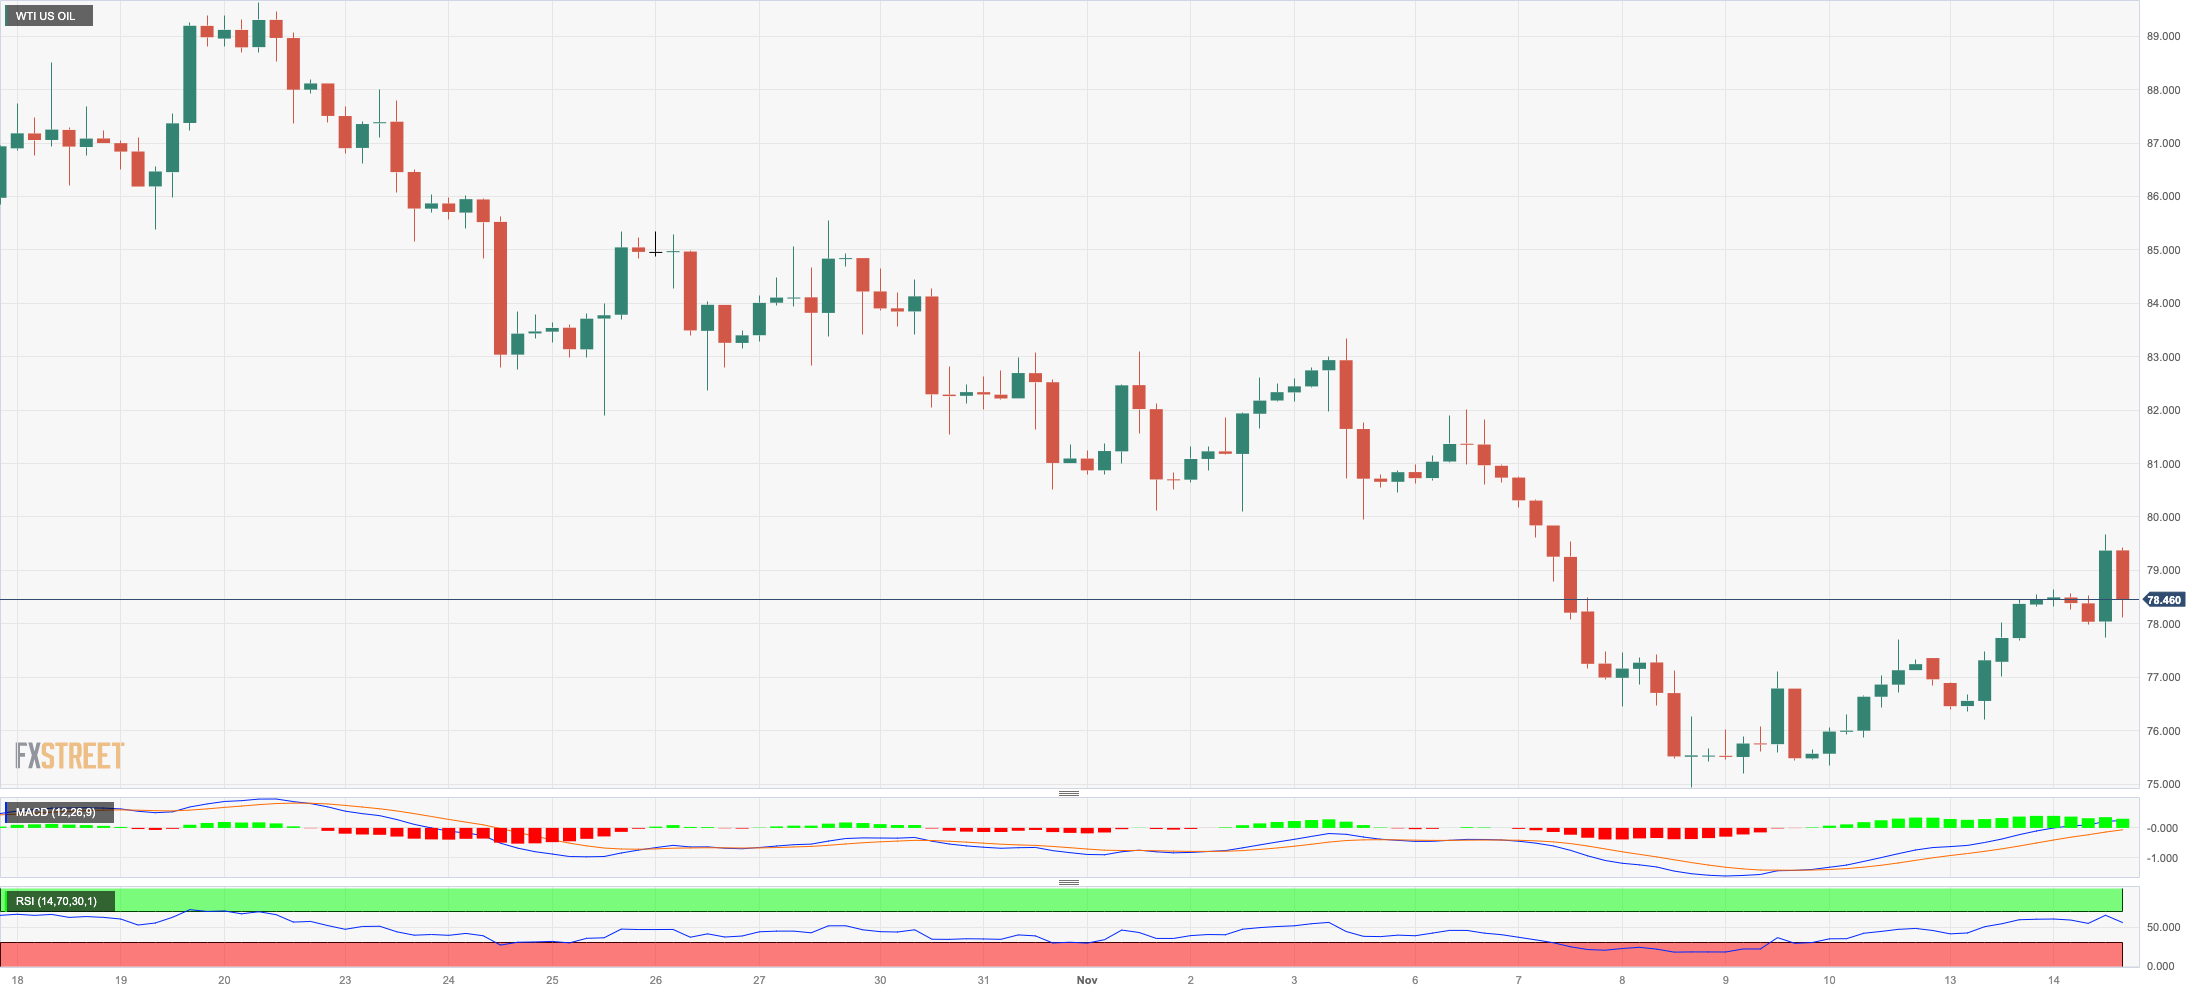
WTI prices traded in an inconclusive fashion around the $78.00 mark per barrel following two consecutive sessions of gains on Tuesday.
Indeed, crude oil prices failed to take any advantage of the weaker dollar and the resurgence of expectations of rate cuts by the Fed at some point in H1 2024, while demand concerns appear to have weighed on the commodity on Tuesday.
The lack of a clear direction in WTI also came despite the fact that the IEA has increased its forecast for global oil demand growth in 2024 to 930 kbpd, up from the previous estimate of 880 kbpd. Additionally, the agency has revised its 2023 global oil demand growth forecast to 2.4 mbpd, compared to the previous estimate of 2.3 mbpd.
Moving forward, the EIA will publish its usual weekly report on US crude oil supplies in the week to November 3 on Wednesday.
For WTI, the November high of $80.15 (November 3) and the provisional 55-day SMA of $85.62 emerge farther north. Extra gains may return to the weekly top of $89.83 (October 18) before the 2023 peak of $94.99 (September 28). In addition, a weekly high of $97.65 (August 30, 2022) develops ahead of the psychological $100.00 mark. On the contrary, if WTI breaks below the November low of $74.96 (November 10), it may next revisit the weekly low of $73.89 (July 17), just ahead of the key $70.00 mark per barrel. The June low of $66.85 (June 12) is lower and precedes the 2023 low of $63.61 (May 4) and the key yardstick of $60.00.
Resistance levels: $79.72 $83.56 $85.85 (4H chart)
Support levels: $74.88 $73.81 $70.18 (4H chart)
GER40
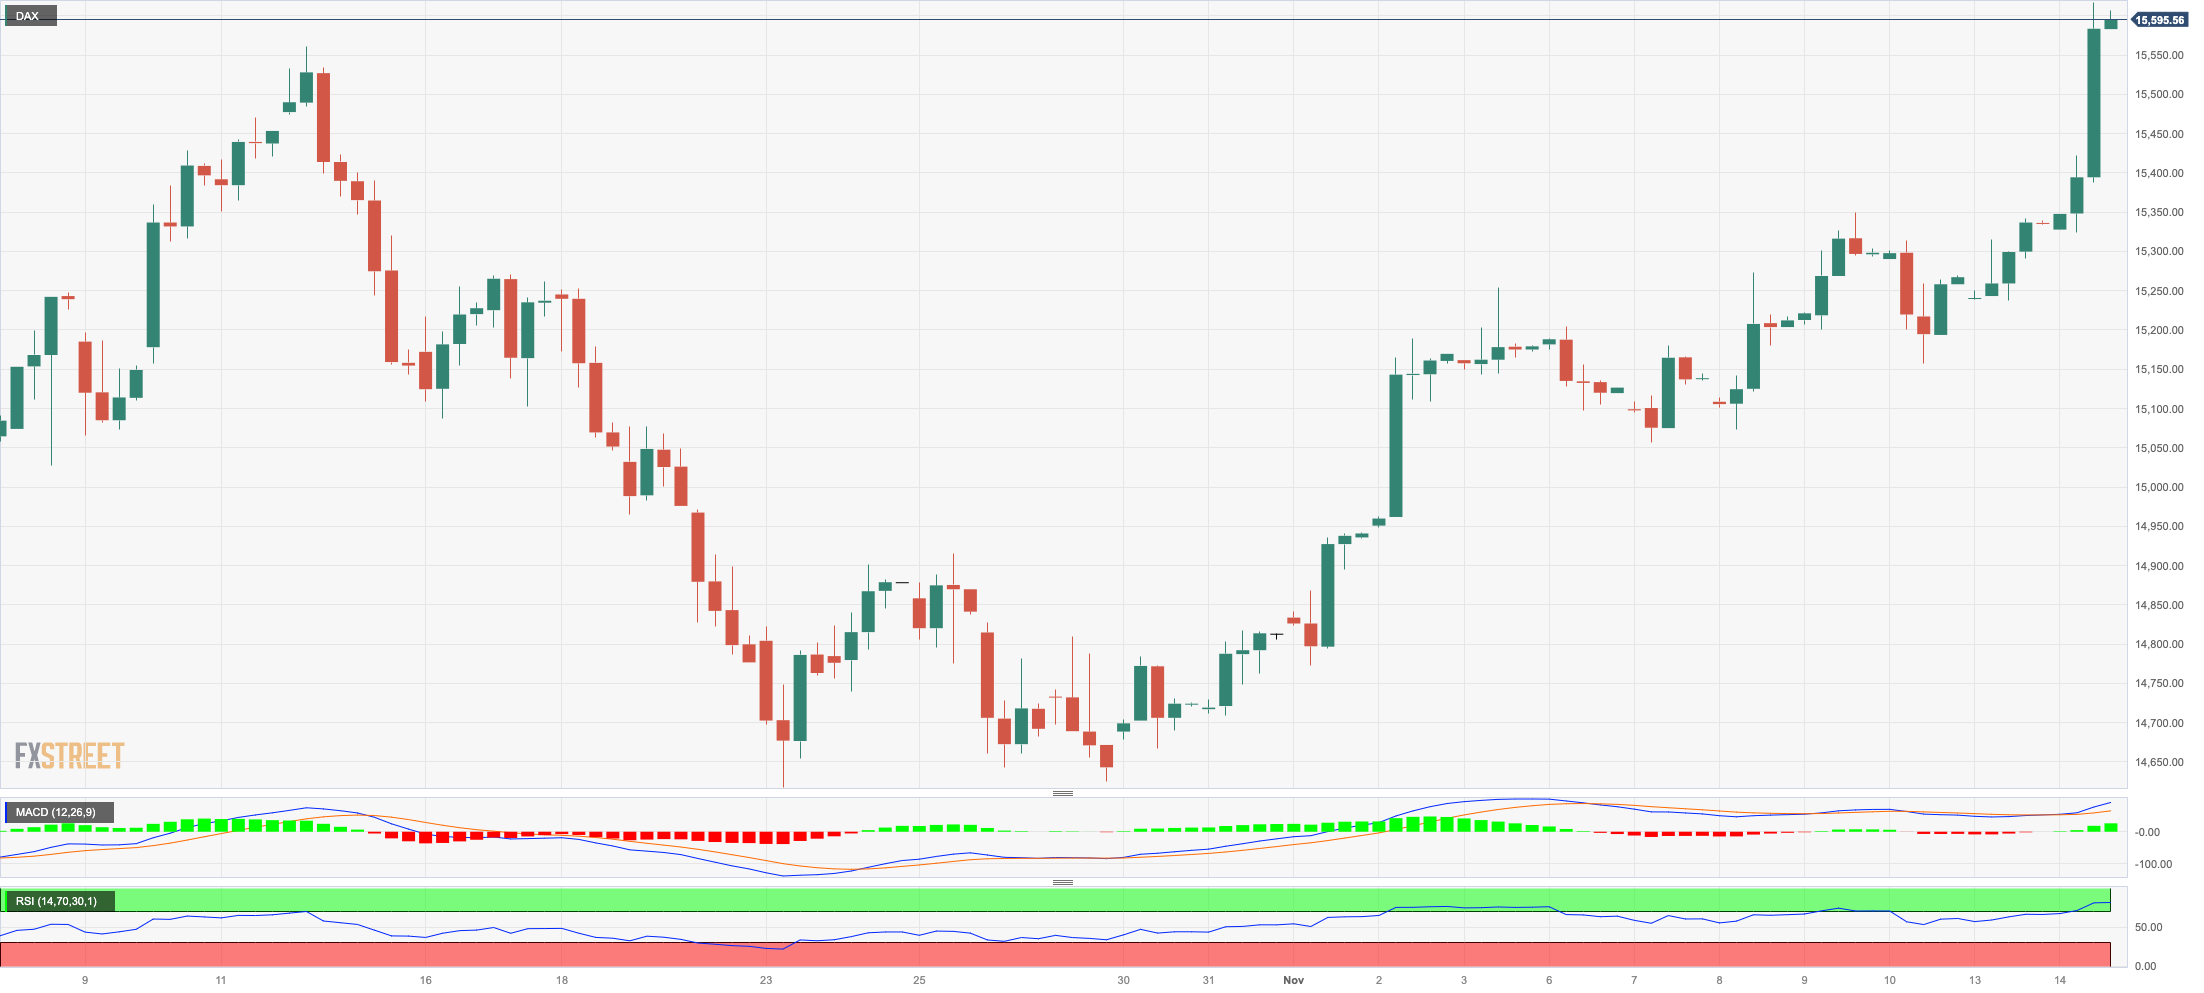
Germany’s benchmark DAX40 maintained the optimism in place on Tuesday and surged to two-month peaks north of the 15600 level, an area close to the significant 200-day SMA.
In fact, below-consensus US CPI boosted expectations of potential rate cuts by the Fed in the first half of the next year, underpinning the bullish sentiment across the board and therefore encouraging the index to keep the multi-week recovery unchanged for the time being.
Extra gains in the DAX40 came in stark contrast to the drop in the 10-year bund yields below 2.60% for the first time since mid-September.
The November high of 15632 (November 14) comes just ahead of the critical 200-day SMA of 15645. Following clearance of the latter, the DAX40 may challenge the September top of 15989 (September 15), and weekly peaks of 16042 (August 31) and 16060 (August 10). Further up, a possible visit to the all-time high of 16528 (July 31) may loom. Instead, the index might be dragged to its October low of 14630 (October 23) before reaching its March low of 14458 (March 20). The December 2022 low of 13791 (December 20) comes next, followed by the September 2022 low of 11862 (September 20). The daily RSI surged past the 65 level.
Best Performers: Zalando SE, Sartorius AG VZO, Vonovia
Worst Performers: Rheinmetall AG, Commerzbank, Deutsche Telekom AG
Resistance levels: 15632 15810 15989 (4H chart)
Support levels: 15171 15068 14630 (4H chart)
NASDAQ
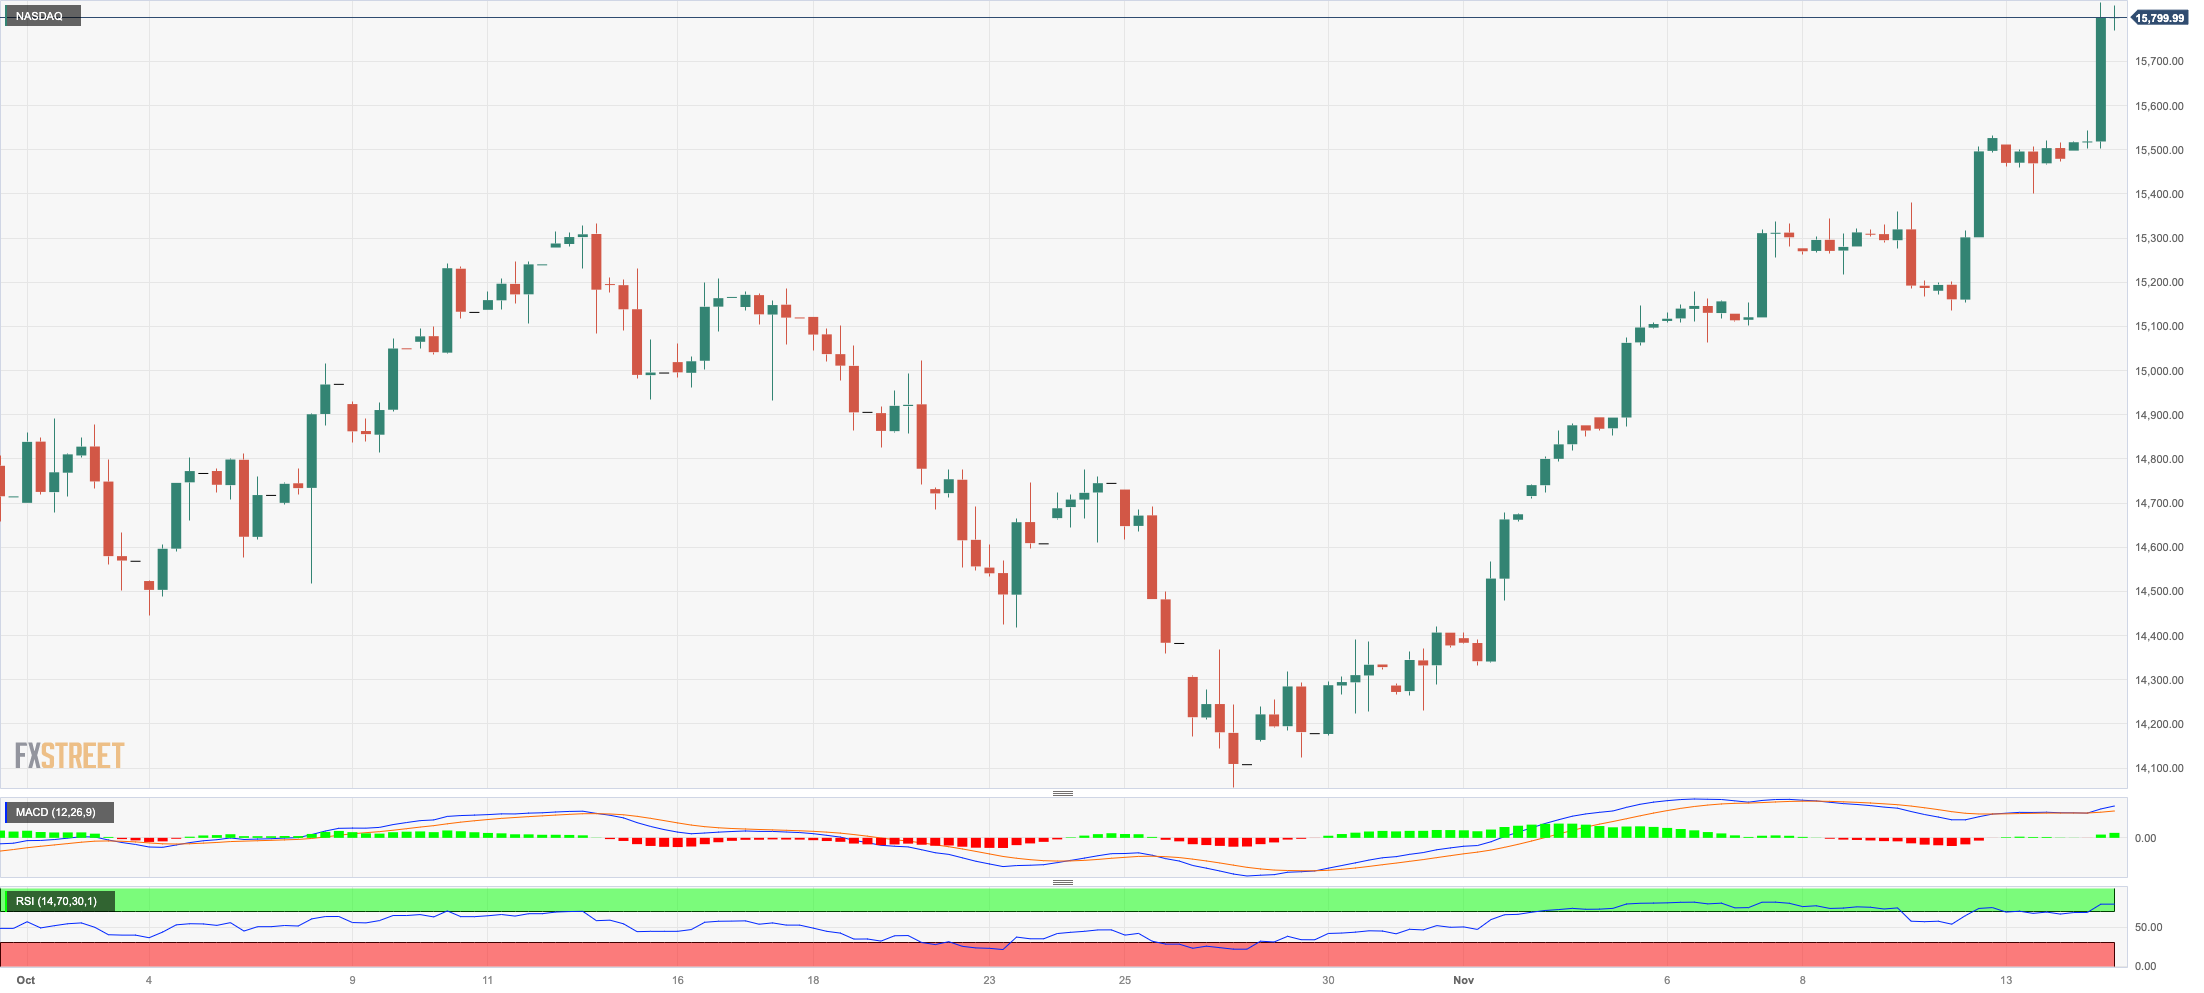
The key tech index Nasdaq 100 rose to levels last traded in mid-July past the 15800 level on turnaround Tuesday.
The sharp move higher in tech stocks followed the equally marked decline in the dollar, while the continuation of the downward bias in US yields across the curve also contributed to the optimism among traders.
In addition, investors’ rising perception that the Fed might be done hiking rates was reinforced after US inflation figures fell short of consensus in October, which eventually morphed into extra wings for the bullish sentiment.
Further Nasdaq increases might propel the index to the 2023 peak of 15932 (July 19) prior to the round milestone of 16000. For all that, immediate support appears to be at the preliminary 55-day SMA at 15006, which comes ahead of the important 200-day SMA of 14130, and the October low of 14058 (October 26). The breakdown of this zone might take us back to the April low of 12724 (April 25), ahead of the March low of 11695 (March 13) and the 2023 low of 10696 (January 3). The RSI for the day surpassed the 68 yardstick.
Top Gainers: Enphase, Globalfoundries, Marvell
Top Losers: O’Reilly Automotive, Vertex, PepsiCo
Resistance levels: 15834 15932 16607 (4H chart)
Support levels: 15171 14922 14058 (4H chart)
DOW JONES
The upside momentum remained well and sound around US equities tracked by the Dow Jones on Tuesday.
That said, the stock benchmark advanced to the boundaries of three-month peaks past the 34900 yardstick on the back of mounting hopes that the Federal Reserve might start reducing its interest rates as soon as in the summer of 2024, all in response to lower-than-expected readings from US inflation in October.
On the whole, the Dow Jones advanced 1.38% to 34810, the S&P500 rose 1.88% to 4494, and the tech-oriented Nasdaq Composite gained 2.28% to 14081.
In light of the ongoing price action, Dow Jones should now challenge the September high of 34977 (September 14), which emerges slightly ahead of the weekly top of 35070. Once passed, the index might face the 2023 peak of 35679 (August 1) prior to the all-time high of 36952 (January 5, 2022). On the flip side, the crucial 200-day SMA is projected to provide early support at 33822, ahead of the October low of 32327 (October 27). The 2023 bottom of 31429 (March 15) and the 2022 low of 28660 (October 13) are both located down here. The daily RSI jumped past 67.
Top Performers: Home Depot, Goldman Sachs, Dow
Worst Performers: The Travelers, UnitedHealth, Procter&Gamble
Resistance levels: 34920 34977 35070 (4H chart)
Support levels: 33859 33594 32327 (4H chart)
MACROECONOMIC EVENTS
All Information & Updates provided by:

All information relating to the financial markets available on this page has been prepared and issued by FXStreet (Forexstreet SL, Spain, Reg: B62498233) on the basis of publicly available information and all information believed to be reliable and does not conflict with Kuwaiti local laws, and all necessary care has been taken to before the company to ensure that the facts mentioned are correct from the source.
NCM Investment nor any of its directors or employees shall in any way be held responsible for the contents of this news, and the information contained on this page is intended only to provide clients with publicly available information and should not be construed as investment advice, report or analysis and/or constitute an offer or invitation to buy or sell financial instruments of any kind.
RISK WARNING: Forex and CFDs are highly risky leveraged products, as losses can exceed deposits. Please ensure you understand all the risks and take independent advice if necessary. NCM will segregate the clients based on the criteria of the regulator and its bylaws. NCM does not provide any advisory service; the material published does not constitute advice or a recommendation for a transaction in any financial instrument. NCM accepts no responsibility for any use of the content presented and any consequences of that use. Anyone acting on the information provided does so at their own risk.