
- Contact Us:
-

-

-

-


Daily Market Updates
16 Nov 2023
USDJPY
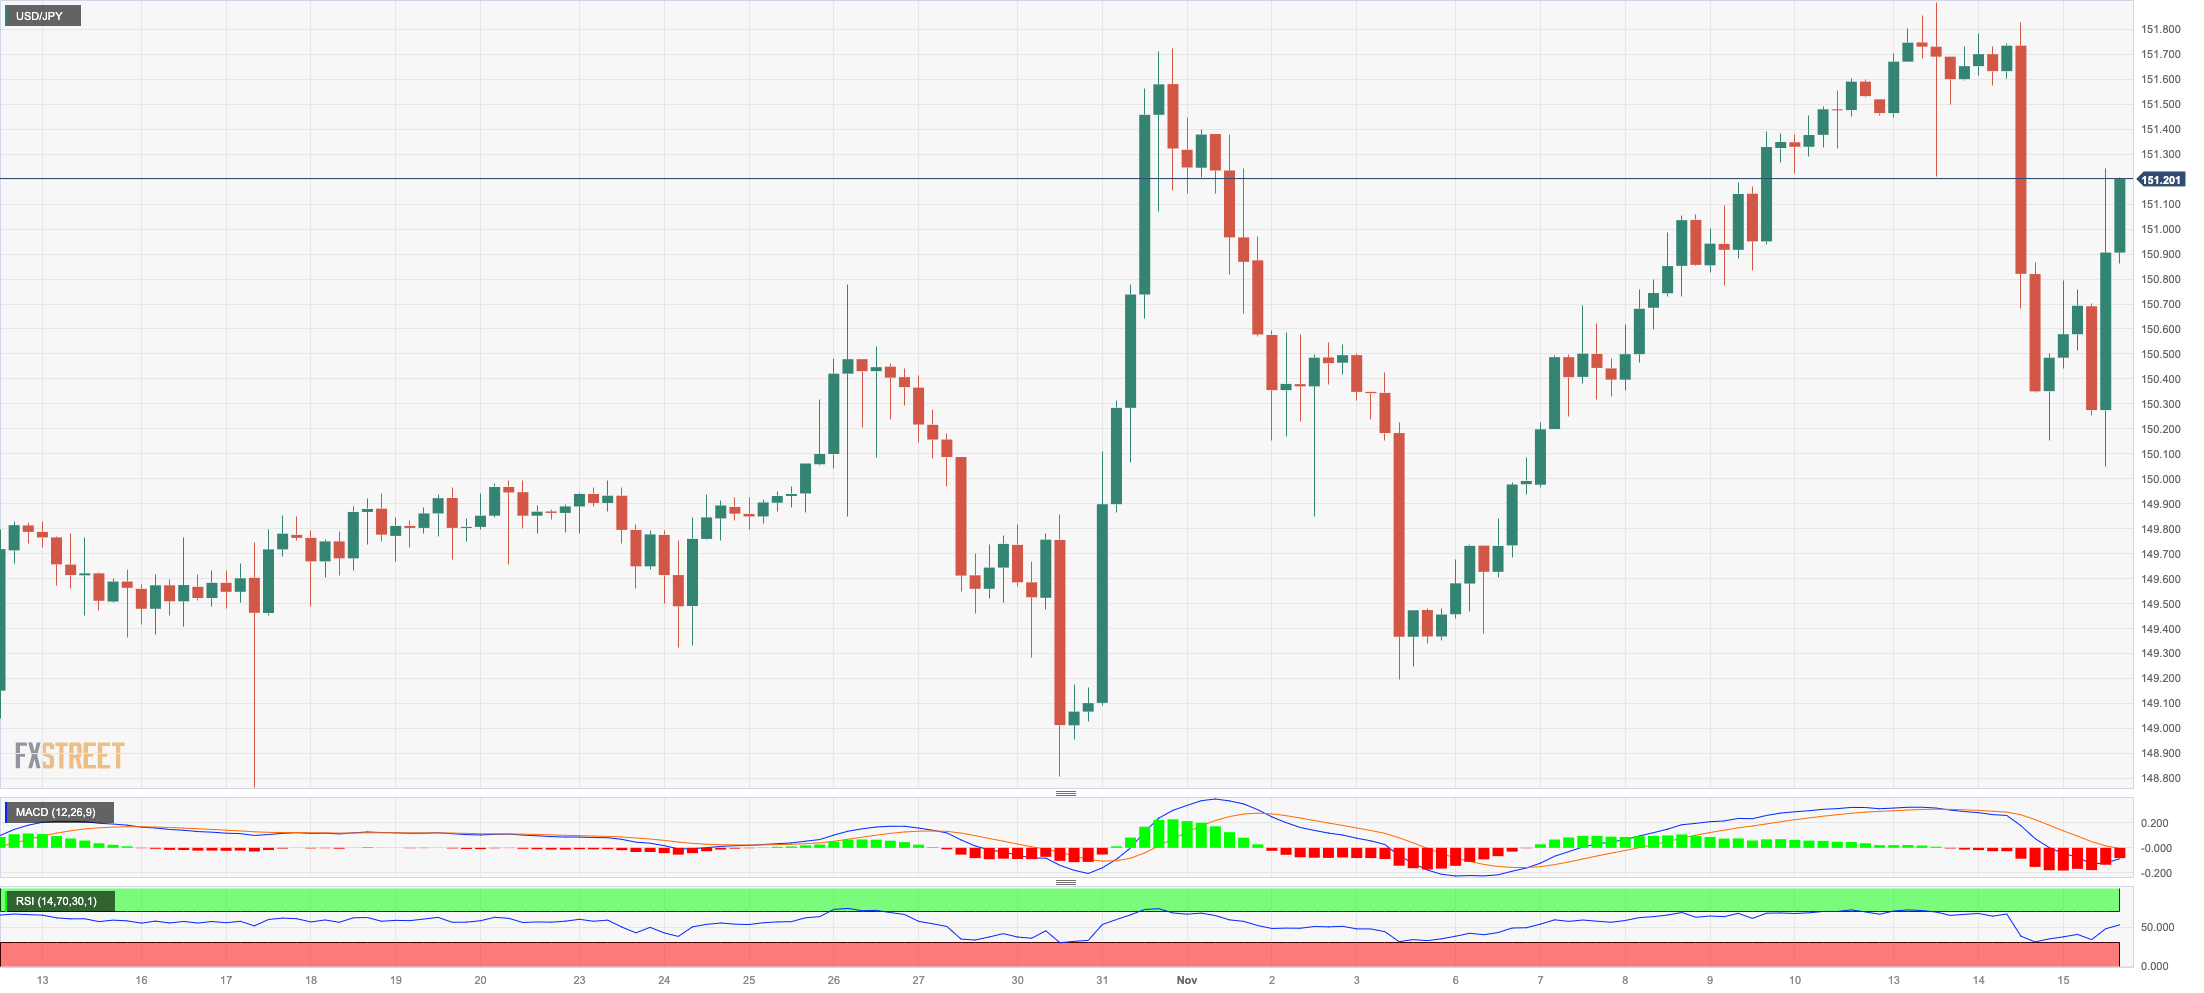
USD/JPY resumed the upside and rapidly left behind Tuesday’s corrective pullback, advancing once again past the 151.00 barrier on Wednesday.
The rebound in the greenback in combination with rising US yields across various timeframes contributed to the daily improvement in spot, while the JGB 10-year yields retreated to multi-week lows near 0.75%.
Additionally, discouraging flash prints from the Japanese Q4 GDP figures added to the selling pressure in the yen, as the economy is now projected to contract 0.5% QoQ and 2.1% over the last twelve months. There was a silver lining, however, as Industrial Production contracted less than expected by 4.4% in the year to September.
If the USD/JPY breaks over the 2023 high of 151.90 (November 13), it may then test the 2022 top of 151.94 (October 21), which would be quickly followed by the round level of 152.00. On the contrary, the 55-day SMA at 149.08 appears to be an intermediate support level, ahead of the October low of 147.27 (October 3). Following that is the weekly low of 145.89 (September 11), ahead of the September low of 144.43 (September 1). There are no substantial support levels from there until the August low of 141.50 (August 7), which precedes the 200-day SMA of 141.18 and the July low of 137.23 (July 14). On the daily chart, the RSI improved to the boundaries of 56.
Resistance levels: 151.90 151.94 152.00 (4H chart)
Support levels: 150.04 149.18 148.80 (4H chart)
GBPUSD
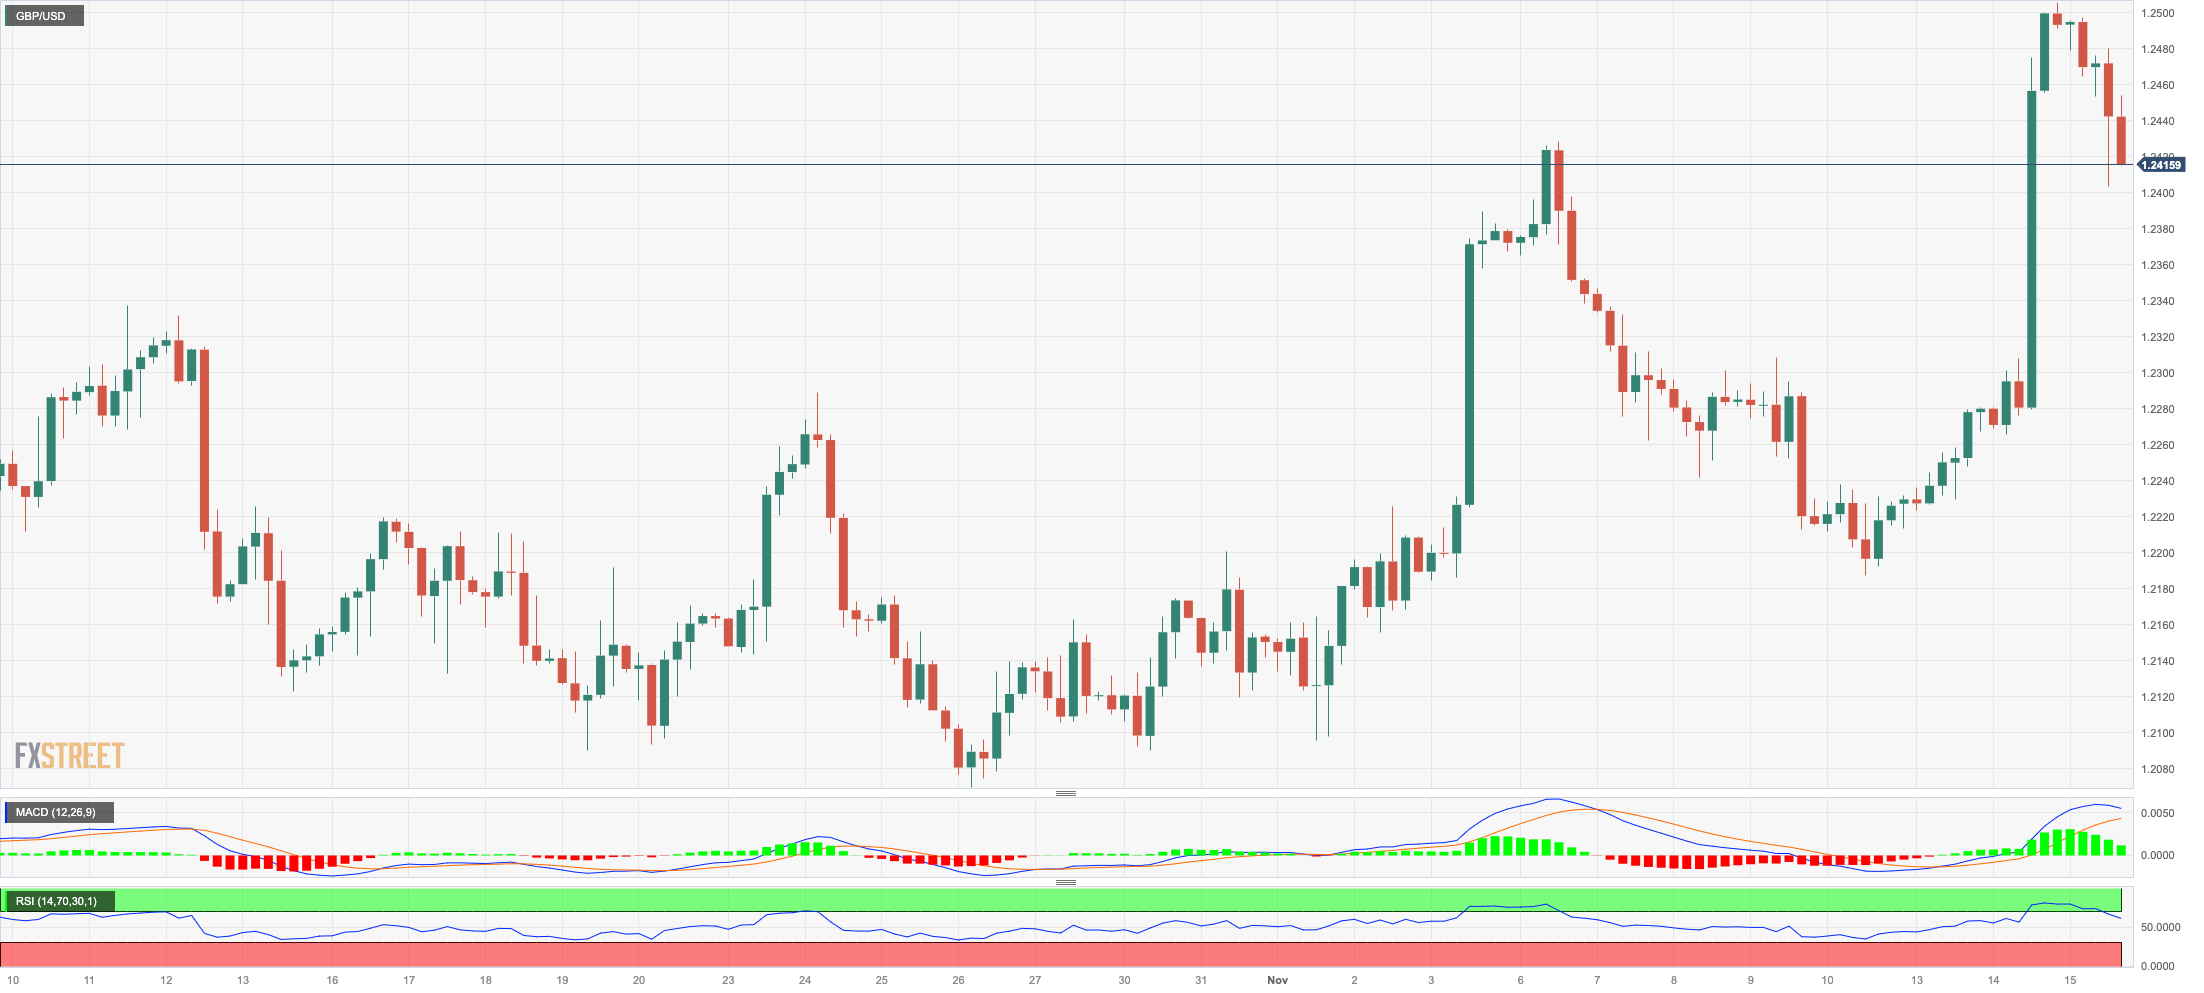
Following a move to the 1.2500 region, GBP/USD succumbed to the rebound in the greenback and dropped to as low as the 1.2400 neighbourhood, where initial contention appears to have emerged.
The daily pullback in Cable came after three consecutive daily advances, including Tuesday’s move to nine-week peaks just past 1.2500 the figure in response to the increased loss of momentum in the dollar in the wake of softer-than-expected US CPI.
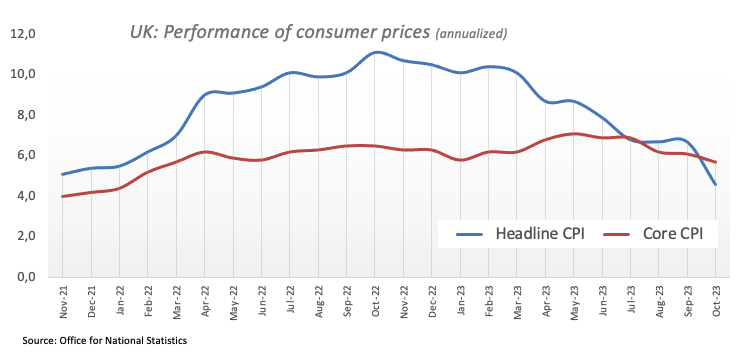
Further weakness hurting the sterling came after UK inflation figures rose less than previously estimated in October. On this, the headline CPI gained 4.6% in the year to October and 5.7% YoY when it came to the Core CPI.
GBP/USD may possibly revisit the provisional 100-day SMA at 1.2512 once it clears the November high of 1.2505 (November 14). Further up comes the weekly top of 1.2548 (September 11) prior to weekly peaks of 1.2746 (August 30), 1.2818 (August 10), and 1.2995 (July 27), all ahead of the critical 1.3000 level. On the other hand, there is immediate contention at the weekly low of 1.2187 (November 10) seconded by another weekly low of 1.2069 (October 26), and the October low of 1.2037 (October 3). The loss of the latter could put the important 1.2000 barrier to the test, prior to the 2023 bottom of 1.1802 (March 8). The RSI grinded lower to the sub-61 area.
Resistance levels: 1.2505 1.2548 1.2746 (4H chart)
Support levels: 1.2208 1.2187 1.2095 (4H chart)
AUDUSD
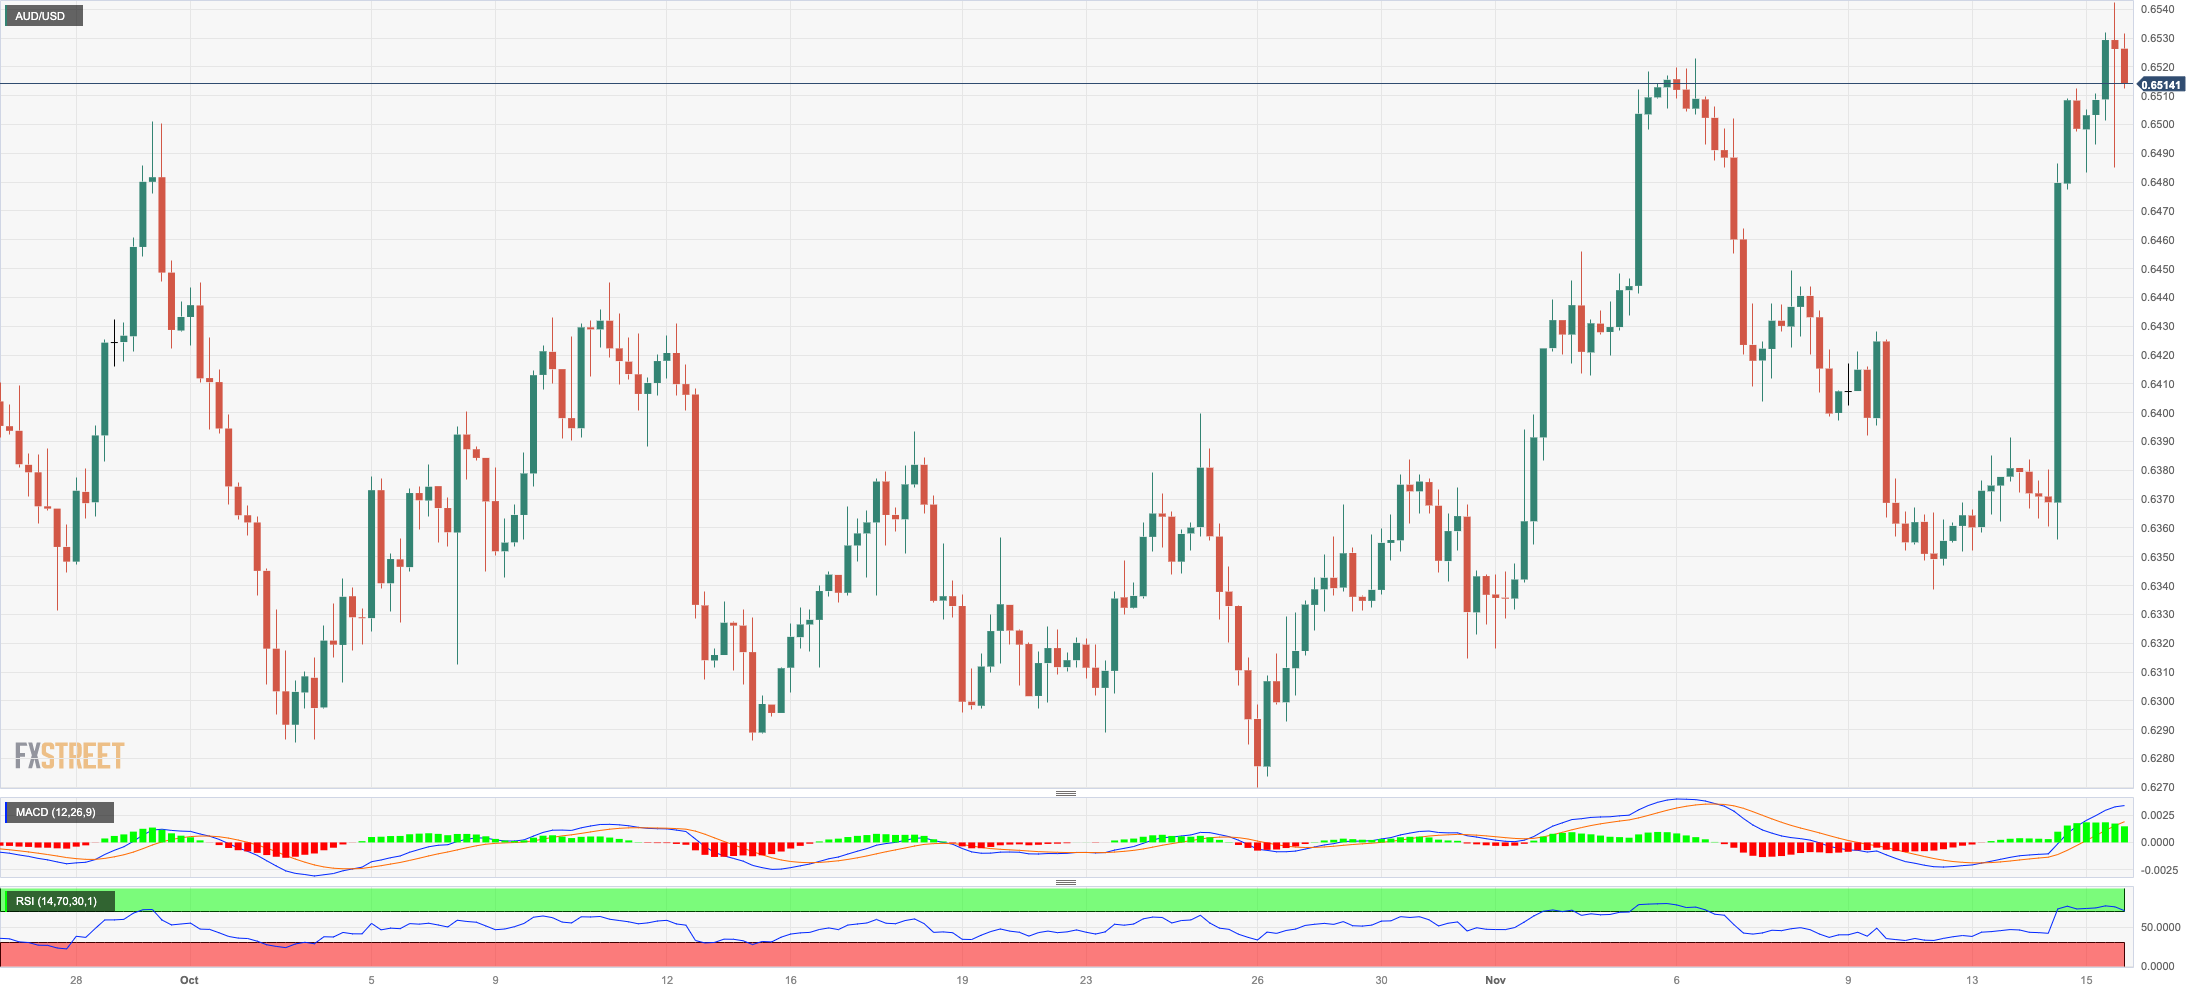
The corrective advance in the greenback was no impediment to extra gains in AUD/USD, which this time revisited the 0.6540 region for the first time since mid-August on Wednesday.
The third consecutive daily gain in the Aussie dollar appeared underpinned by auspicious prints from the Chinese docket as well as by the generalized upbeat tone in the commodity universe.
Also adding to the upside pressure in the AUD was the rise of 4% YoY in the Wage Price Index during the July–September period.
If bulls push stronger, the AUD/USD may potentially face the key 200-day SMA at 0.6597 prior to the weekly high of 0.6616 (August 10). North from here aligns the July top of 0.6894 (July 14), seconded by the June peak of 0.6899 (June 16), all ahead of the critical 0.7000 barrier. In comparison, there is a temporary support at the 55-day SMA at 0.6394 ahead of the 2023 low of 0.6270 (October 26). The breakdown of this region leaves the pair vulnerable to a probable drop to the round level of 0.6200, followed by the 2022 low of 0.6169 (October 13). The daily RSI advanced past 61.
Resistance levels: 0.6541 0.6616 0.6739 (4H chart)
Support levels: 0.6376 0.6338 0.6270 (4H chart)
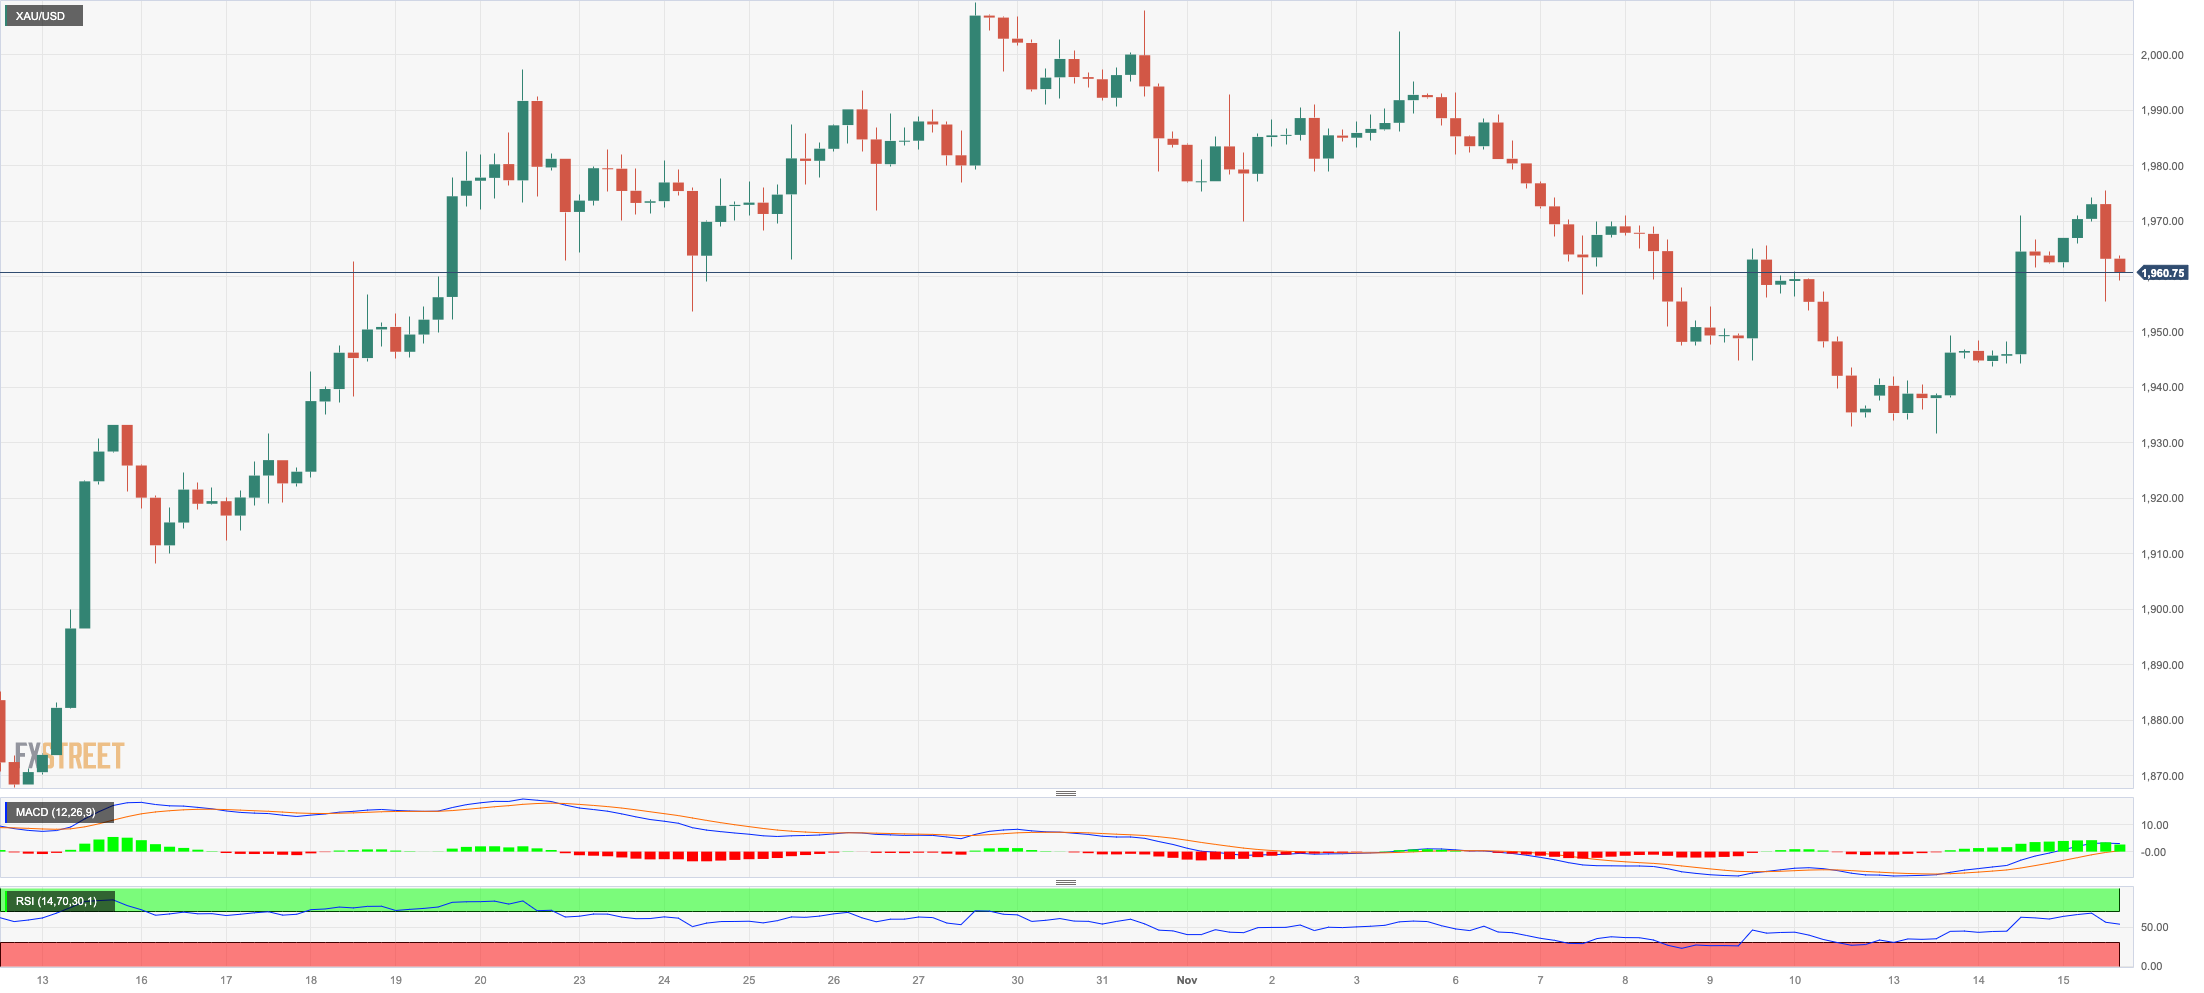
GOLD
Gold prices could not sustain an early move to the $1975 zone and ended up surrendering part of the weekly gains to the decent rebound in the greenback on Wednesday.
Also weighing on the precious metal appeared the marked bounce in US yields across the curve, as investors kept gauging the latest US inflation figures vs. the prospects of potential interest rate cuts by the Federal Reserve at some point in the first half of 2024.
Immediately to the upside for gold is the weekly peak of $1975 (November 15) ahead of the October high of $2009 (October 27). The breakout of this level could prompt a test of the 2023 top of $2067 (May 4) to emerge on the horizon prior to the 2022 peak of $2070. (March 8) and the all-time high of $2075 (August 7, 2020). However, if selling pressure develops, gold may challenge the November low of $1931 (November 13), ahead of the preliminary 55-day SMA of $1925. Down from here aligns the October low of $1810 (October 6) seconded by the 2023 low of $1804 (February 28) and the key contention region of $1800.
Resistance levels: $1975 $2009 $2048 (4H chart)
Support levels: $1931 $1908 $1867 (4H chart)
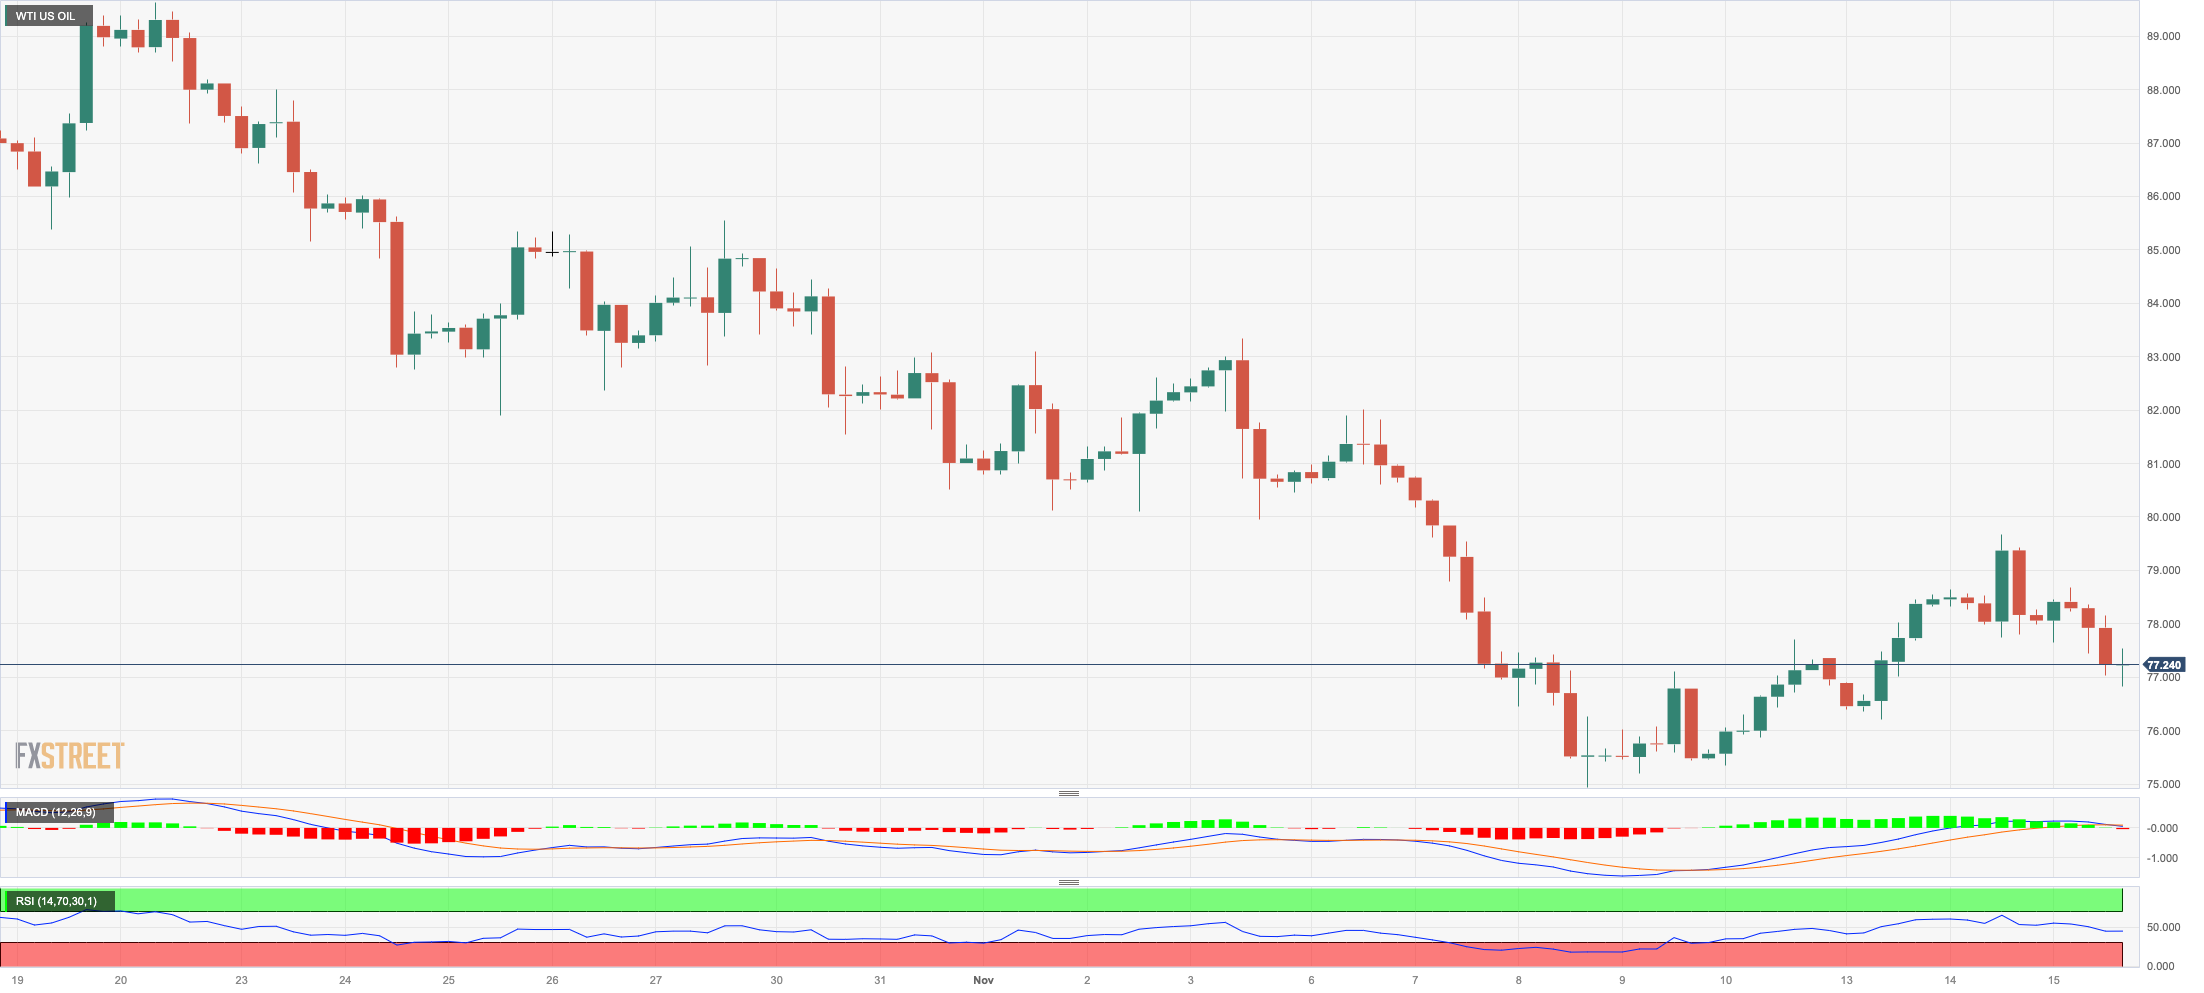
CRUDE WTI
Prices of the American benchmark for sweet light crude oil retreated to two-day lows in the sub-$77.00 zone on Wednesday.
In fact, prices of WTI traded on the defensive in response to the larger-than-estimated weekly build in US crude oil supplies, as reported by the EIA earlier on Wednesday. On this, the agency reported that US crude oil inventories rose by 3.600M barrels in the week to November 3, while supplies at Cushing went up by 1.900M barrels, Weekly Distillate Stocks shrank by 1.400M barrels, and gasoline stockpiles dropped by 1.500M barrels.
In addition, omnipresent concerns surrounding China and the persistent increase in US oil output also put prices under extra downside pressure midweek.
Further north for WTI, the November high of $80.15 (November 3) and the provisional 55-day SMA of $85.54 appear. Extra gains might return to the weekly high of $89.83 (October 18) before the 2023 peak of $94.99 (September 28). Furthermore, a weekly high of $97.65 (August 30, 2022) emerges ahead of the psychological $100.00 level. On the other hand, if WTI falls below the November low of $74.96 (November 10), it may dispute the weekly low of $73.89 (July 17), just ahead of the critical $70.00 mark per barrel. The June low of $66.85 (June 12) is next followed by the crucial $60.00 yardstick and the 2023 low of $63.61 (May 4).
Resistance levels: $79.72 $83.56 $85.85 (4H chart)
Support levels: $76.80 $74.88 $73.81 (4H chart)
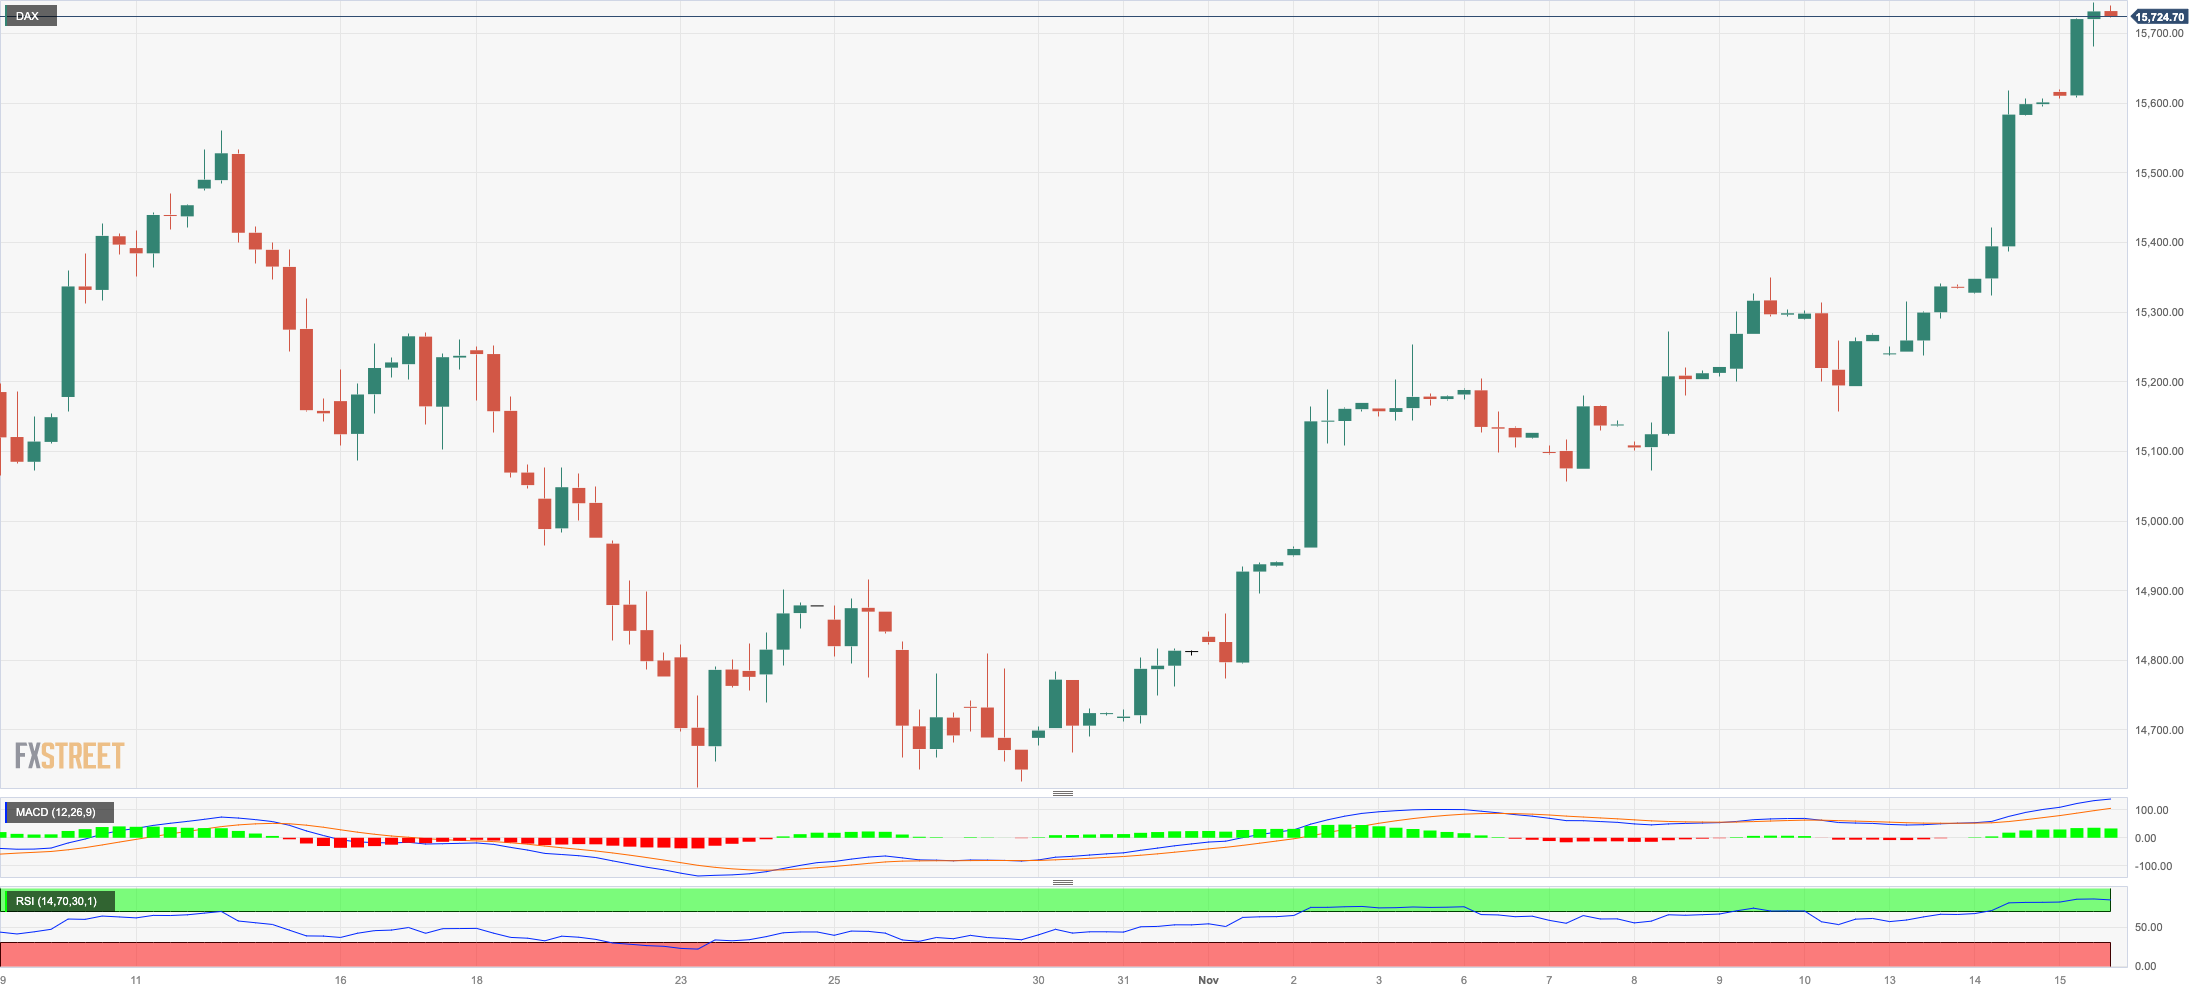
GER40
The DAX40 advanced for the third consecutive session and approached the 15800 region on Wednesday.
The march north in the index came in response to encouraging prints from the Chinese calendar, while another measure of US inflation (Producer Prices) also came in short of markets’ consensus for the month of October.
In the meantime, the upbeat tone among traders remained underpinned by expectations of rate cuts by the Fed in H1 2024 as well as a prolonged pause in the ECB’s normalization programme.
The daily uptick in the German index this time was accompanied by a decent rebound in the 10-year bund yields, which regained the 2.65% level.
Next on the upside for the DAX40 appears the September high of 15989 (September 15), followed by weekly tops of 16042 (August 31) and 16060 (August 10). The surpass of the latter could pave the way for a visit to the all-time peak of 16528 (July 31). Just the opposite, the index might be dragged to the interim 55-day SMA at 15340 prior to the October low of 14630 (October 23) and the March low of 14458 (March 20). Following that is the December 2022 low of 13791 (December 20), ahead of the September 2022 low of 11862 (September 20). The daily RSI increased past the 68 yardstick.
Best Performers: Infineon, Siemens Energy AG, Zalando SE
Worst Performers: Heidelbergcement, Vonovia, E.ON SE
Resistance levels: 15759 15810 15989 (4H chart)
Support levels: 15409 15171 15068 (4H chart)
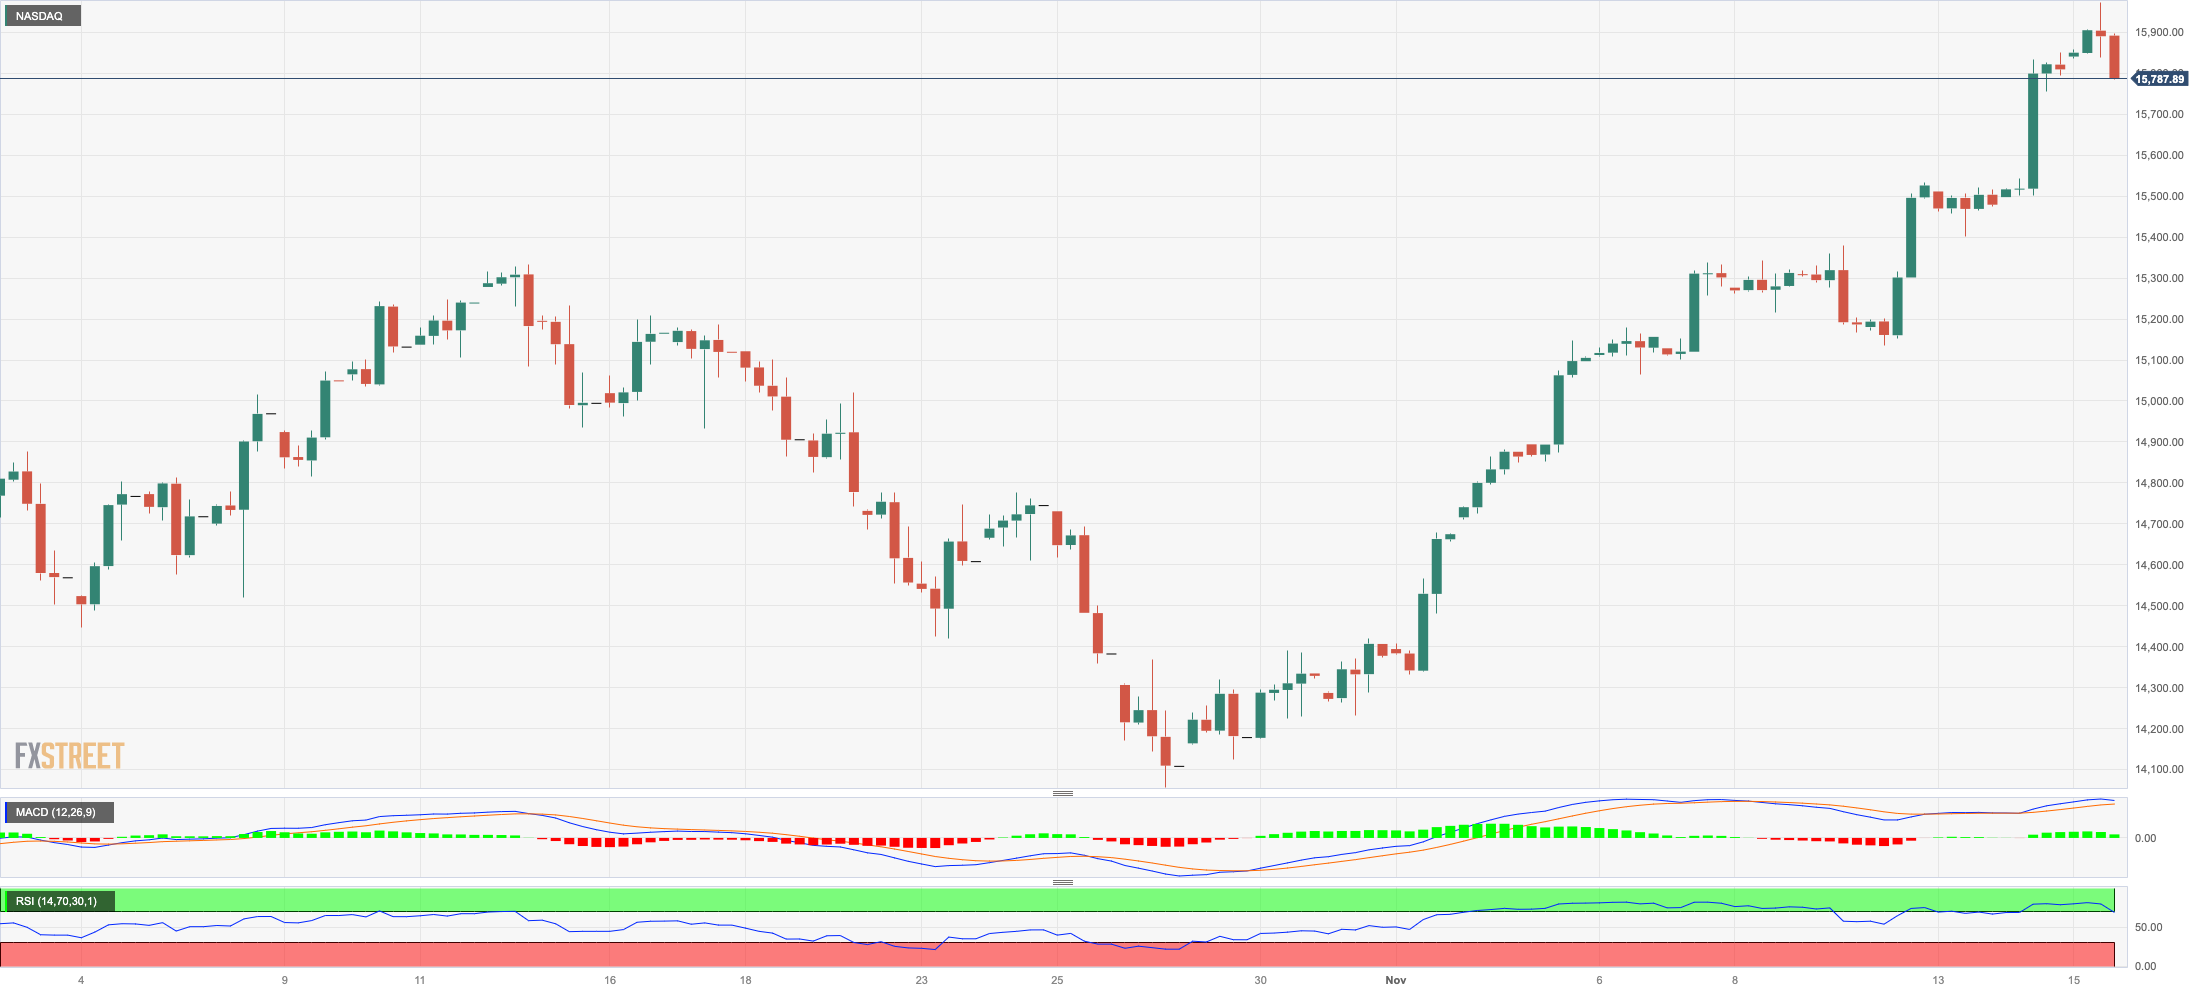
NASDAQ
In line with the rest of its US peers, the tech Nasdaq 100 extended the weekly uptrend on Wednesday, this time revisiting an area last seen in mid-July around 15900.
The bid bias remained well and sound as investors assessed the lower-than-estimated US Producer Prices, which further reinforced the case for potential rate cuts in the next year.
On the not-so-bright side of the index, the dollar’s recovery and the rebound in US yields across the board seem to have limited the upside potential in the tech sector.
Further Nasdaq gains may drive the index to the 2023 top of 15932 (July 19), closely followed by the round milestone of 16000. Having said that, immediate support looks to be at the preliminary 55-day SMA of 15014, ahead of the critical 200-day SMA of 14148 and the October low of 14058 (October 26). This zone's collapse might prompt the index to refocus on the April bottom of 12724 (April 25), prior to the March low of 11695 (March 13) and the 2023 low of 10696 (January 3). The day's RSI climbed to the 69 region.
Top Gainers: JD.com Inc Adr, Sirius XM, Moderna
Top Losers: Constellation Energy, Vertex, Cadence Design
Resistance levels: 15904 15932 16607 (4H chart)
Support levels: 15116 14954 14058 (4H chart)
DOW JONES
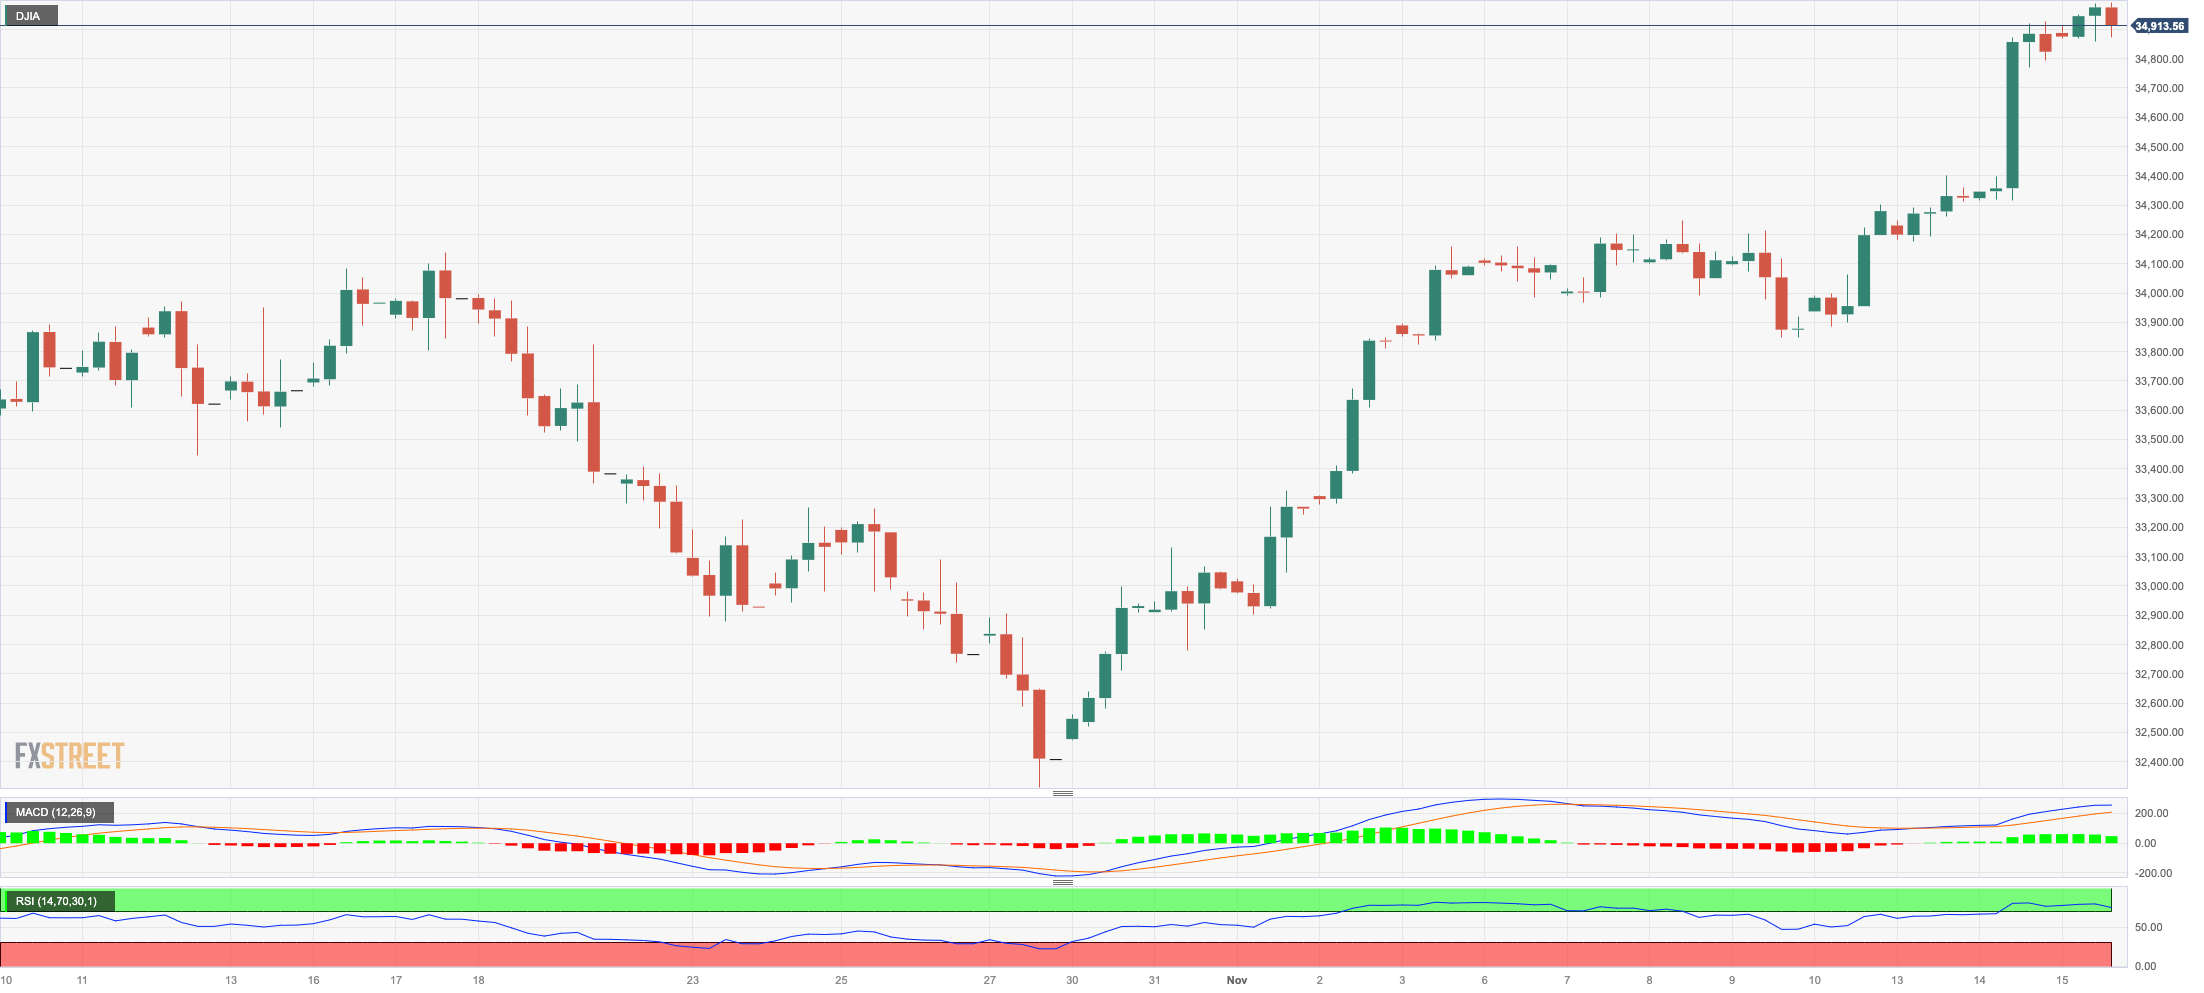
Another optimistic session in US stocks saw the benchmark Dow Jones advance to levels just shy of the 35000 threshold for the first time since late August on Wednesday.
Supporting the above, another measure of inflation, this time Producer Prices, came in short of expectations and underpinned Tuesday’s soft CPI readings, all bolstering investors’ perception that the Fed is done hiking rates and could start reducing rates as soon as June 2024.
All in all, the Dow Jones gained 0.38% to 34959, the S&P500 advanced 0.28% to 4508, and the tech-heavy Nasdaq Composite rose 0.25% to 14129.
Given the current market movement, Dow Jones should now test the weekly high of 35070. After that, the index may meet the 2023 top of 35679 (August 1) before reaching the all-time peak of 36952 (January 5, 2022). The important 200-day SMA, on the other hand, is expected to give early resistance at 338926, ahead of the October low of 32327 (October 27). The bottom in 2023 is 31429 (March 15), and the low in 2022 is 28660 (October 13). The daily RSI flirted with the overbought zone near 69.
Top Performers: Walt Disney, Intel, Nike
Worst Performers: Merck&Co, Procter&Gamble, McDonald’s
Resistance levels: 34996 35070 35578 (4H chart)
Support levels: 34292 33859 33647 (4H chart)
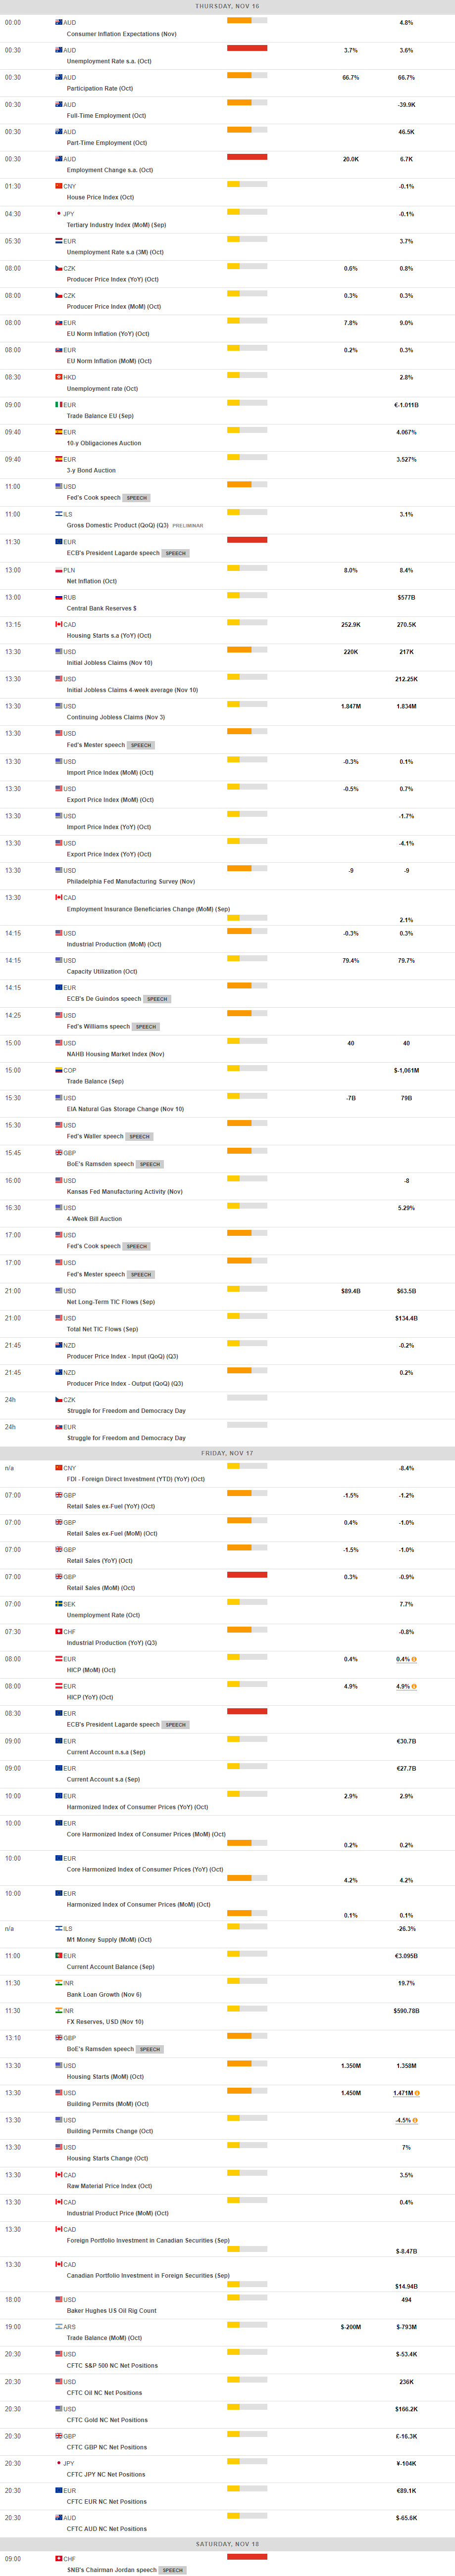
MACROECONOMIC EVENTS
All Information & Updates provided by:

All information relating to the financial markets available on this page has been prepared and issued by FXStreet (Forexstreet SL, Spain, Reg: B62498233) on the basis of publicly available information and all information believed to be reliable and does not conflict with Kuwaiti local laws, and all necessary care has been taken to before the company to ensure that the facts mentioned are correct from the source.
NCM Investment nor any of its directors or employees shall in any way be held responsible for the contents of this news, and the information contained on this page is intended only to provide clients with publicly available information and should not be construed as investment advice, report or analysis and/or constitute an offer or invitation to buy or sell financial instruments of any kind.
RISK WARNING: Forex and CFDs are highly risky leveraged products, as losses can exceed deposits. Please ensure you understand all the risks and take independent advice if necessary. NCM will segregate the clients based on the criteria of the regulator and its bylaws. NCM does not provide any advisory service; the material published does not constitute advice or a recommendation for a transaction in any financial instrument. NCM accepts no responsibility for any use of the content presented and any consequences of that use. Anyone acting on the information provided does so at their own risk.