
- Contact Us:
-

-

-

-


Daily Market Updates
17 Nov 2023
USDJPY
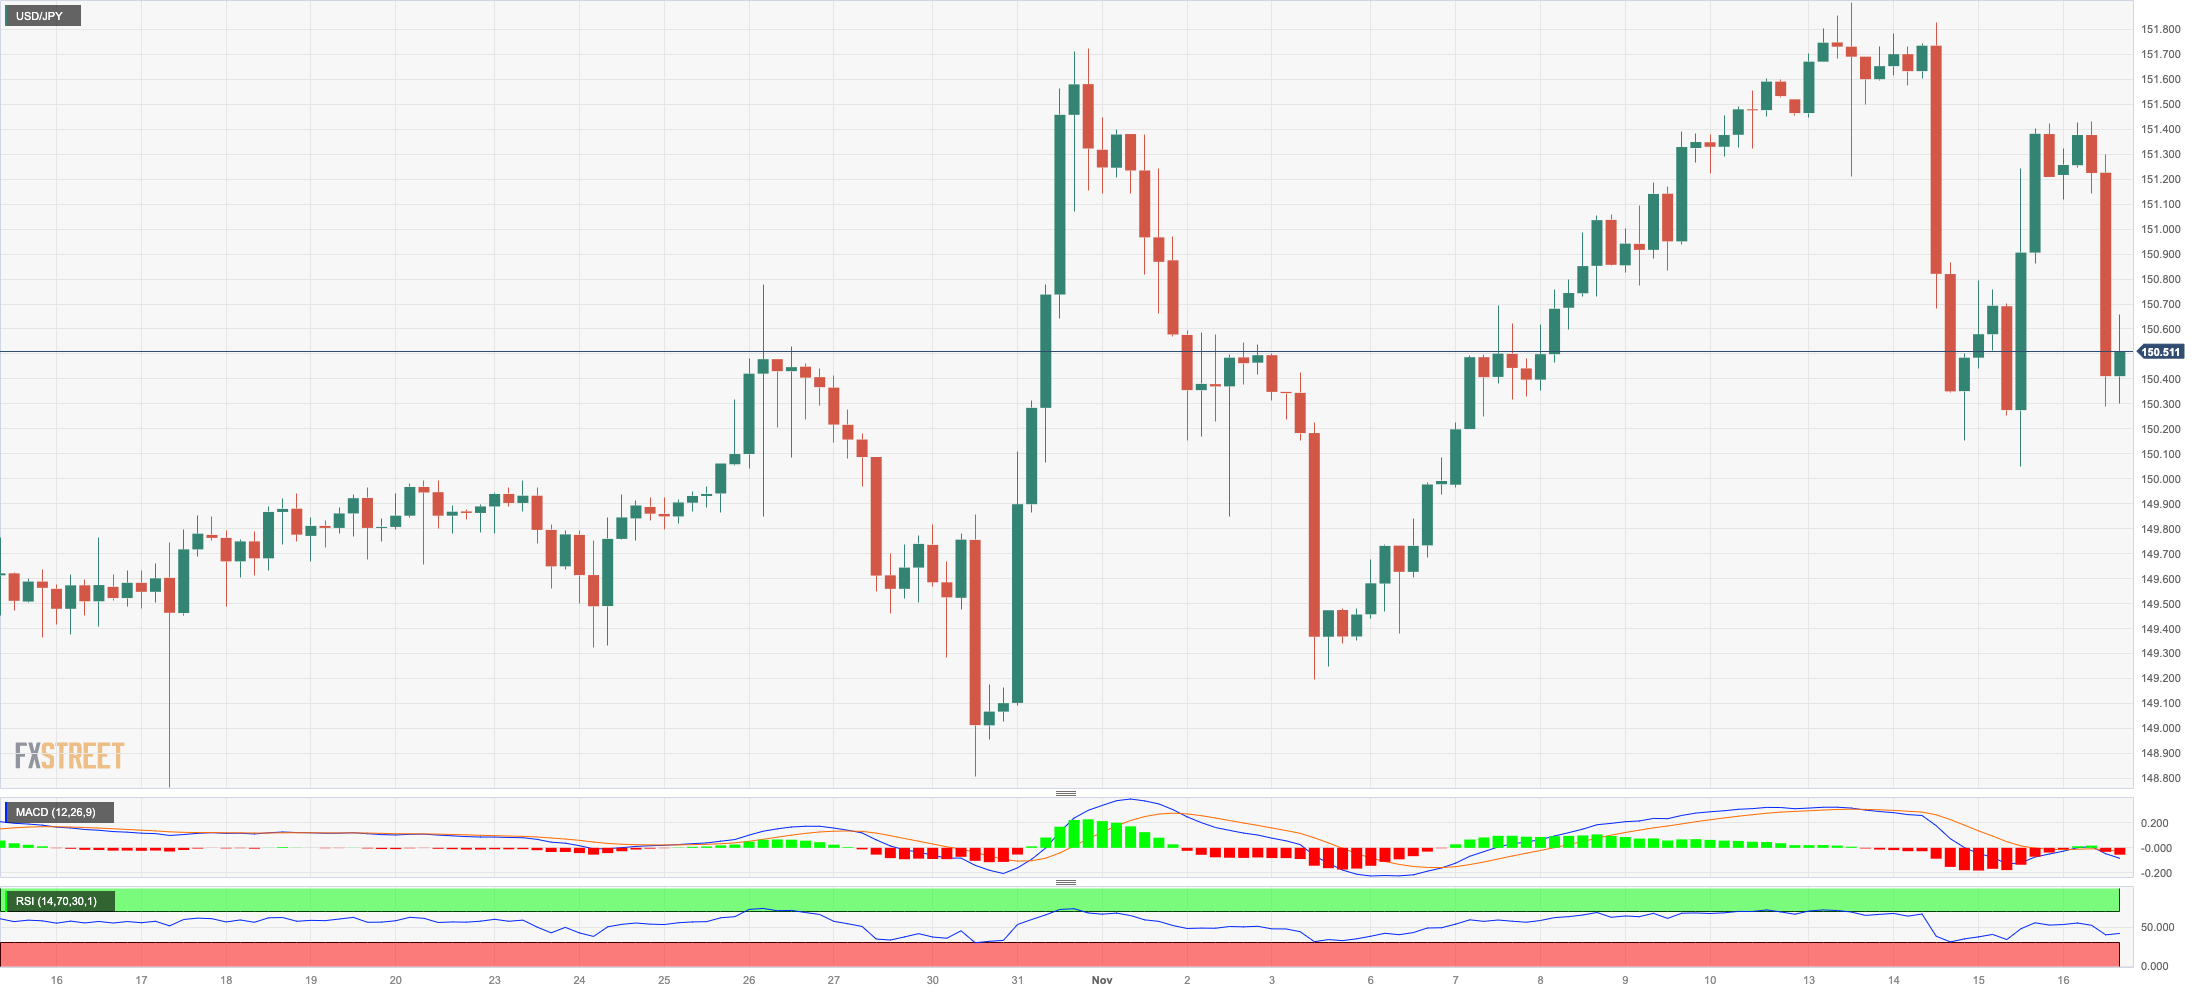
Ups and downs around the greenback in combination with declining US yields across different maturities and the small uptick in the JGB 10-year yields all underpinned the selling pressure in USD/JPY on Thursday.
Indeed, spot traded within a tight range and just above the 151.00 mark following Wednesday’s important rebound, always against the backdrop of the omnipresent surveillance of the BoJ and markets’ cautiousness over potential FX intervention.
Data-wise, in Japan, the trade deficit came in at ¥662.5B in October, Foreign Bond Investment shrank by ¥68.2B in the week to November 11, Machinery Orders contracted less than expected by 2.2% in the year to September, and the Tertiary Industry Index by 1.0% in September vs. the previous month.
If the USD/JPY breaks over the 2023 high of 151.90 (November 13), it may then challenge the 2022 top of 151.94 (October 21), closely followed by the round milestone of 152.00. On the flip side, the 55-day SMA at 149.19, seems to be an intermediate support level, ahead of the October low of 147.27 (October 3). The weekly low of 145.89 (September 11) comes next and lines up before the September low of 144.43 (September 1). From there, there are no significant support levels until the August low of 141.50 (August 7), which precedes the 200-day SMA of 141.28 and the July low of 137.23 (July 14). The RSI deflated to the sub-52 zone.
Resistance levels: 151.42 151.90 151.94 (4H chart)
Support levels: 150.04 149.18 148.80 (4H chart)
GBPUSD
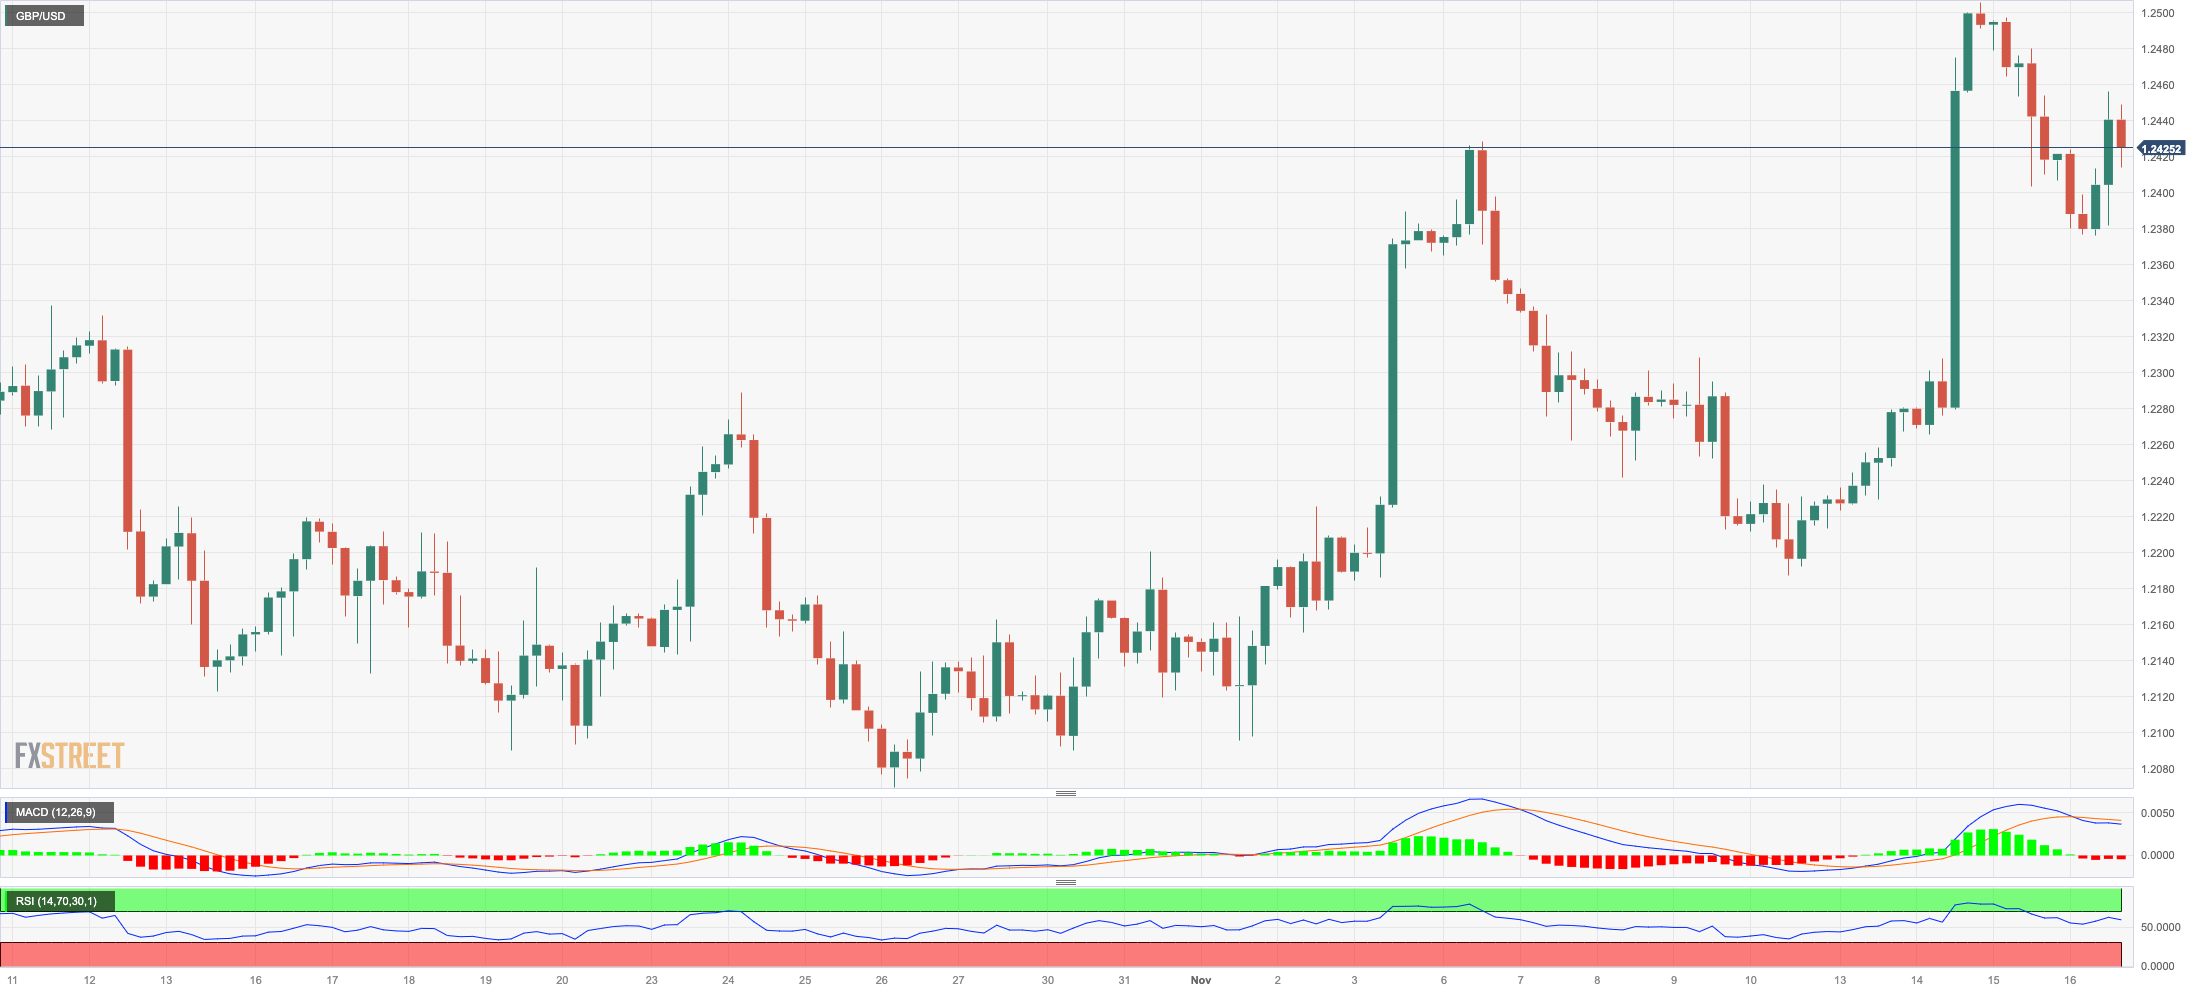
GBP/USD set aside Wednesday’s losses and posted humble gains after bouncing off two-day lows in the 1.2380 region, just to reclaim the area beyond 1.2400 in the latter part of Thursday’s session.
The bearish session in the greenback reignited some fresh buying interest around the British pound, which in turn appears to have left behind now-rising speculation of a pause in the BoE’s hiking cycle.
These rumours were particularly magnified after UK inflation figures rose less than initially estimated during October.
There were no data releases scheduled across the Channel on Thursday.
GBP/USD may revisit the intermediate 100-day SMA at 1.2512 after it clears the November high of 1.2505 (November 14). The weekly top of 1.2548 (September 11) is followed by weekly peaks of 1.2746 (August 30), 1.2818 (August 10), and 1.2995 (July 27), all of which are ahead of the critical 1.3000 threshold. On the other hand, the weekly low of 1.2187 (November 10) emerges as the immediate contention followed by weekly lows of 1.2069 (October 26) and 1.2037 (October 3). If the latter is lost, the important 1.2000 barrier may be tested before the 2023 low of 1.1802 is achieved (March 8). The day-to-day RSI edged marginally higher north of the 60 yardstick.
Resistance levels: 1.2505 1.2548 1.2746 (4H chart)
Support levels: 1.2376 1.2212 1.2187 (4H chart)
AUDUSD
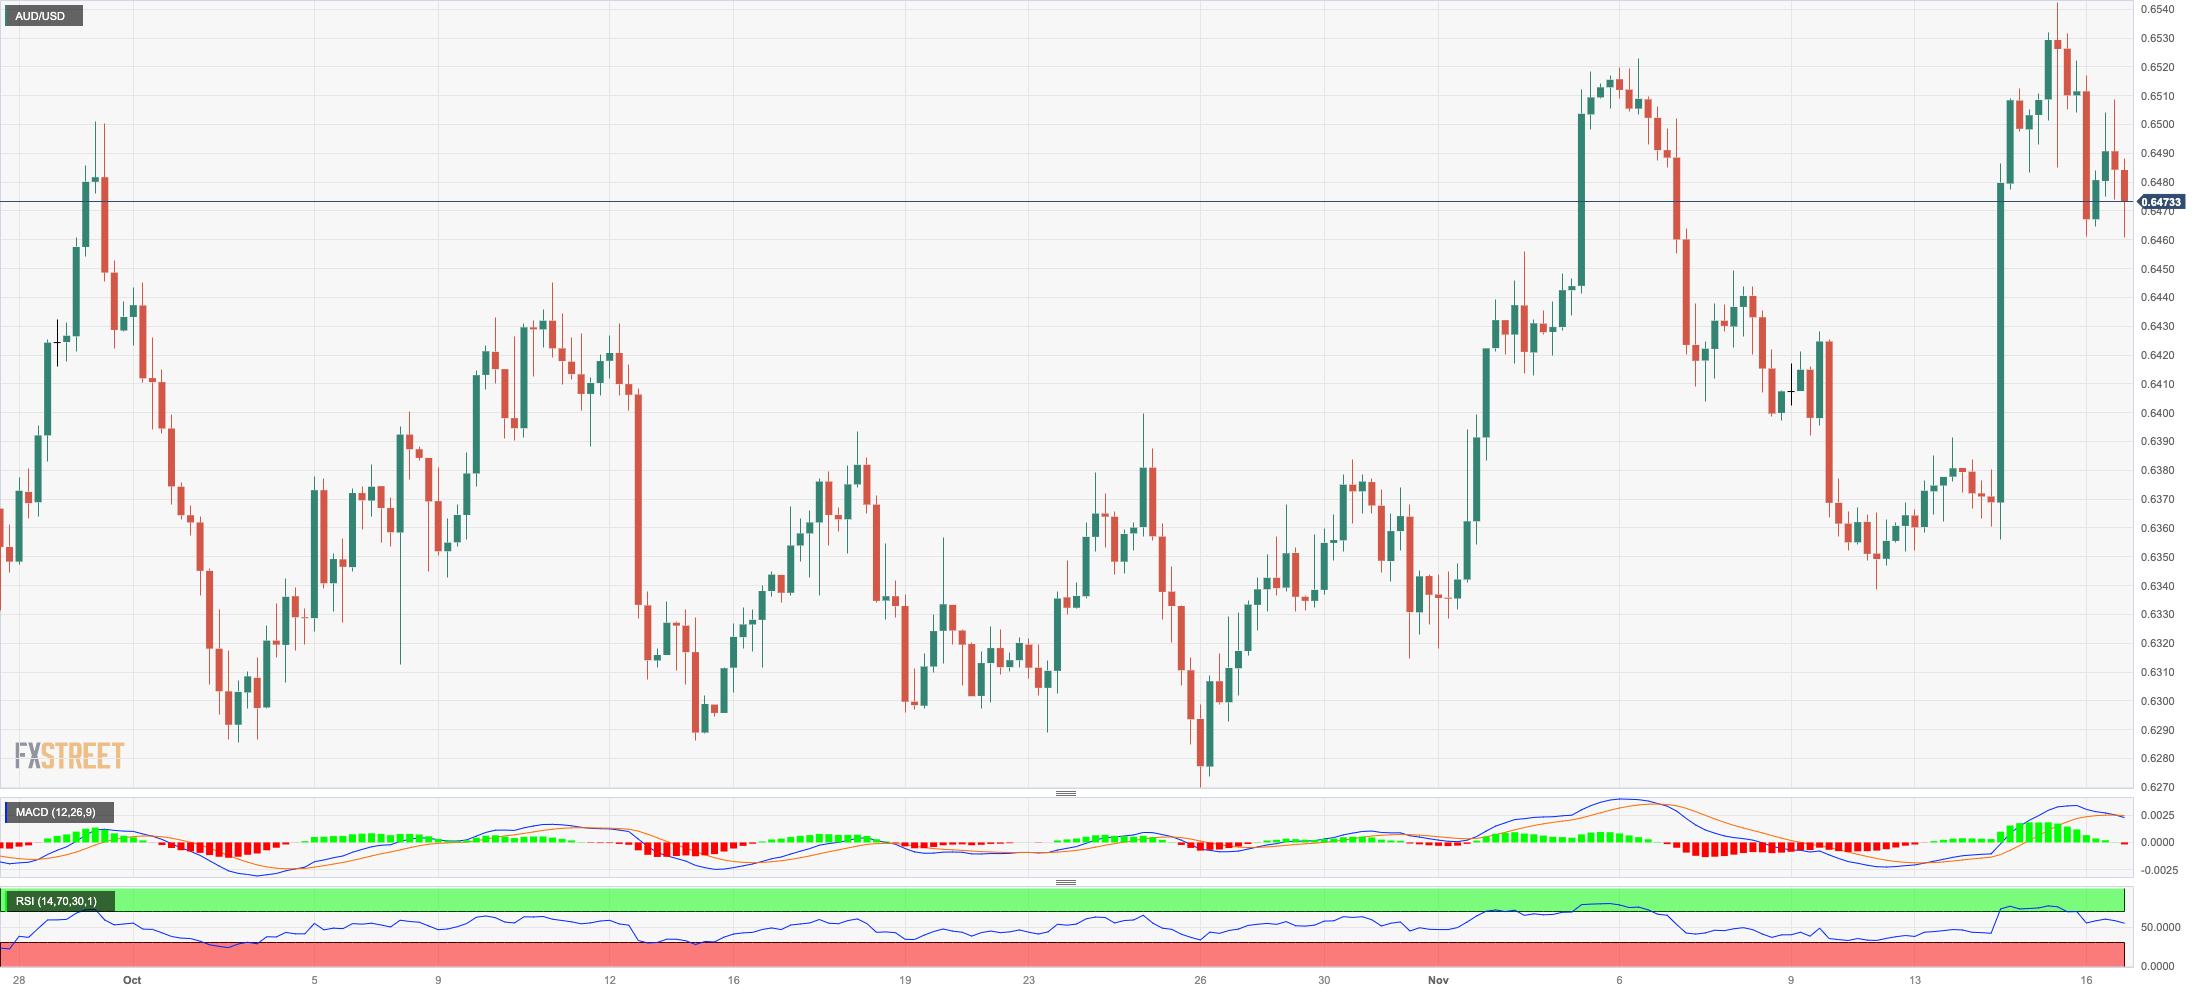
AUD/USD failed to capitalize on the corrective move in the greenback and traded with marked losses after three consecutive daily advances on Thursday.
Furthermore, the broad-based positive performance of the commodity complex did nothing to help the Aussie dollar either despite copper prices and the tonne of iron ore extended their march north.
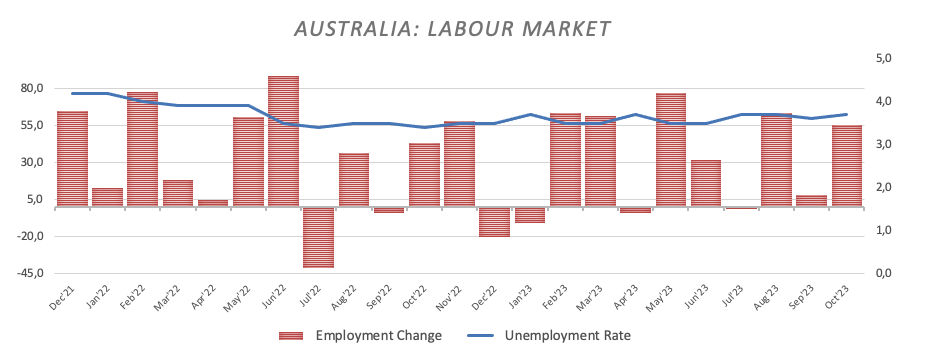
In addition, the currency seems to have paid no attention to the healthy figures from the domestic labour market in October, where Employment Change increased by 55K individuals amidst an uptick in the jobless rate to 3.7%. Other data saw Consumer Inflation Expectations rise to 4.9% in November (from 4.8%).
If bulls push stronger, the AUD/USD could break above the November peak of 0.6541 (November 15) and potentially face the key 200-day SMA at 0.6595 prior to the weekly high of 0.6616 (August 10). North from here aligns the July top of 0.6894 (July 14), seconded by the June peak of 0.6899 (June 16), all ahead of the critical 0.7000 barrier. In comparison, there is a temporary support at the 55-day SMA at 0.6394 ahead of the 2023 low of 0.6270 (October 26). The breakdown of this region leaves the pair vulnerable to a probable drop to the round level of 0.6200, followed by the 2022 low of 0.6169 (October 13). The daily RSI receded to the 57 zone.
Resistance levels: 0.6541 0.6616 0.6739 (4H chart)
Support levels: 0.6376 0.6338 0.6270 (4H chart)
GOLD
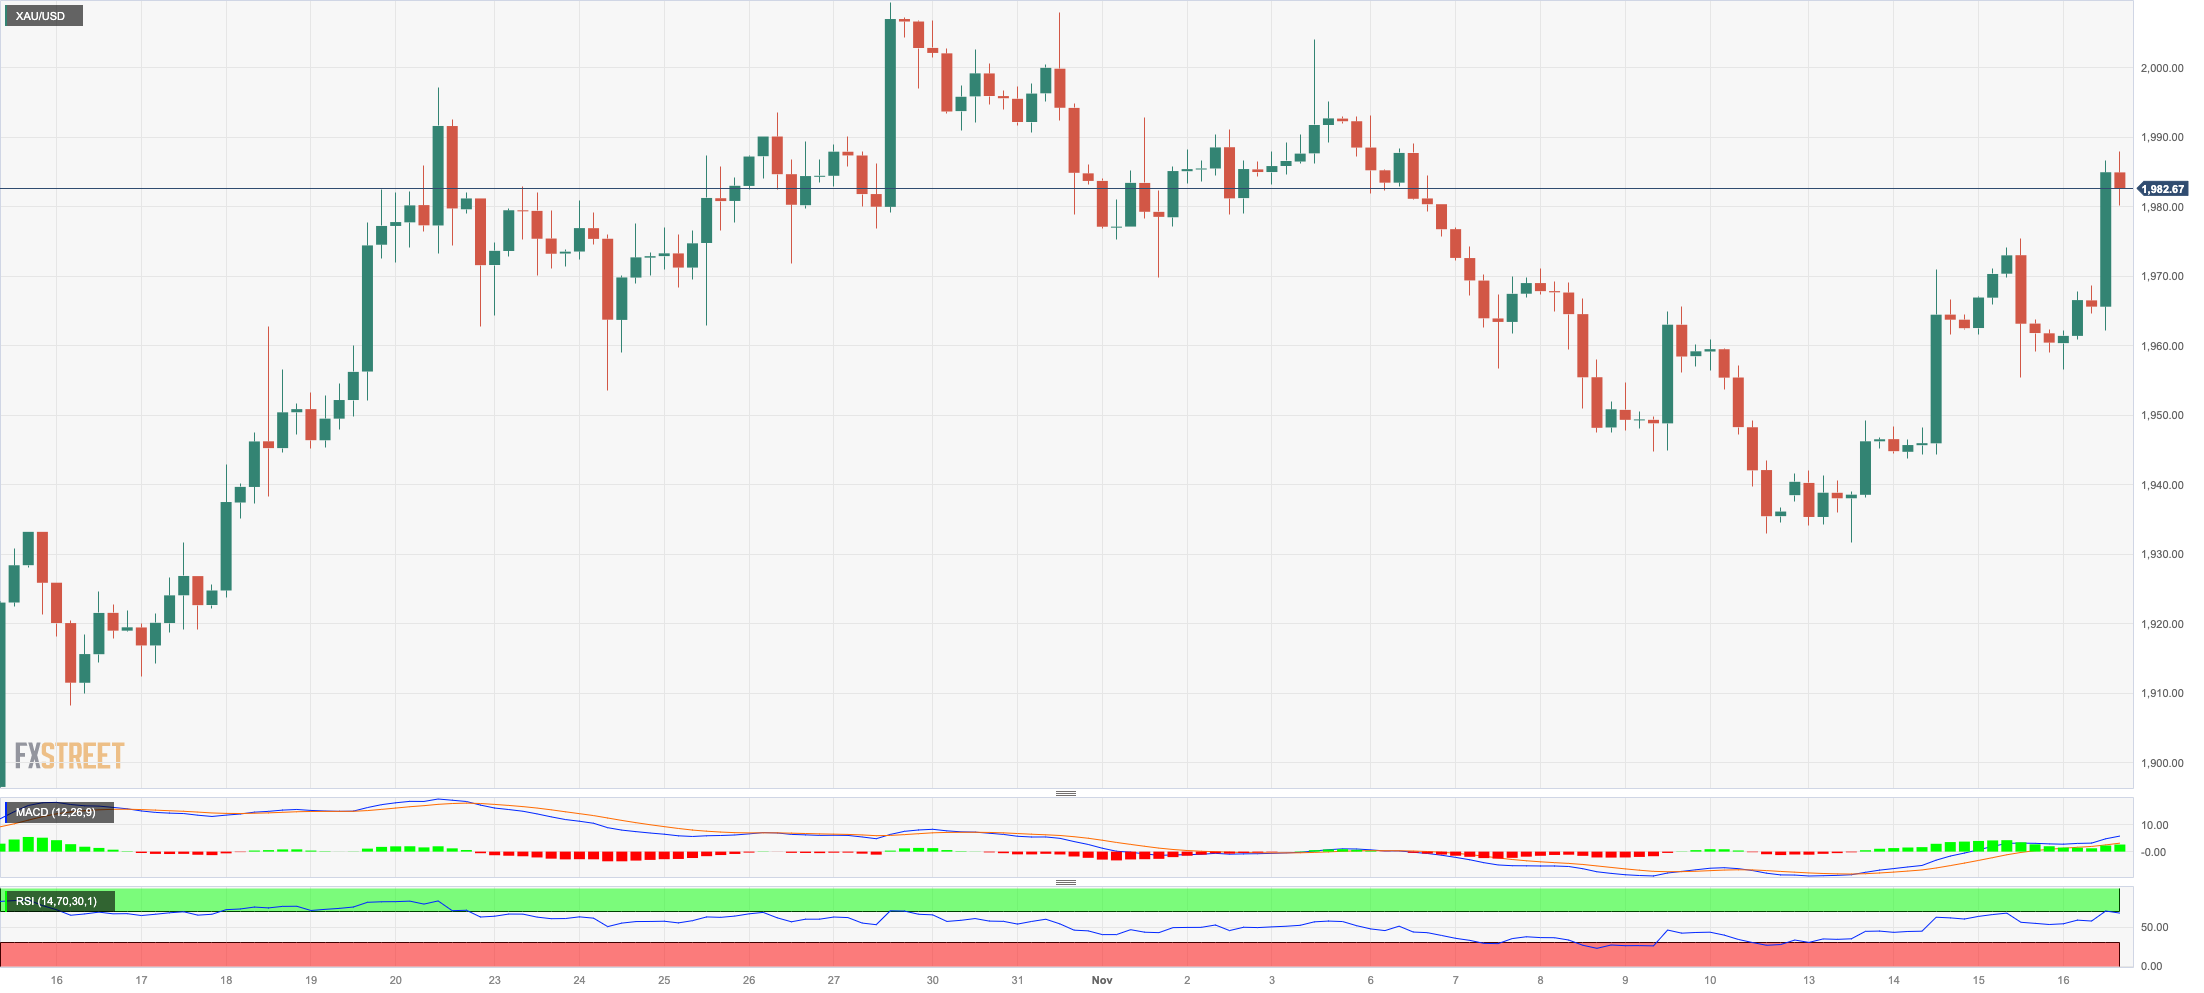
Prices of the yellow metal climbed to fresh nine-day highs near the $1990 region per troy ounce on Thursday.
Indeed, the daily pullback was reinforced by the selling pressure hitting the dollar and the resumption of the downtrend in US yields across different timeframes.
In the meantime, the precious metal is expected to closely follow the Fed dynamics for direction against the backdrop of increasing market chatter over the likelihood that the Fed could start cutting its interest rates in H1 2024.
Immediately to the upside for gold is the weekly peak of $1988 (November 16) ahead of the October high of $2009 (October 27). The breakout of this level could prompt a test of the 2023 top of $2067 (May 4) to emerge on the horizon prior to the 2022 peak of $2070 (March 8) and the all-time high of $2075 (August 7, 2020). Instead, if selling pressure develops, gold may challenge the November low of $1931 (November 13), ahead of the preliminary 55-day SMA of $1926. Down from here aligns the October low of $1810 (October 6) seconded by the 2023 low of $1804 (February 28) and the key contention region of $1800.
Resistance levels: $1988 $2009 $2048 (4H chart)
Support levels: $1955 $1933 $1908 (4H chart)
CRUDE WTI
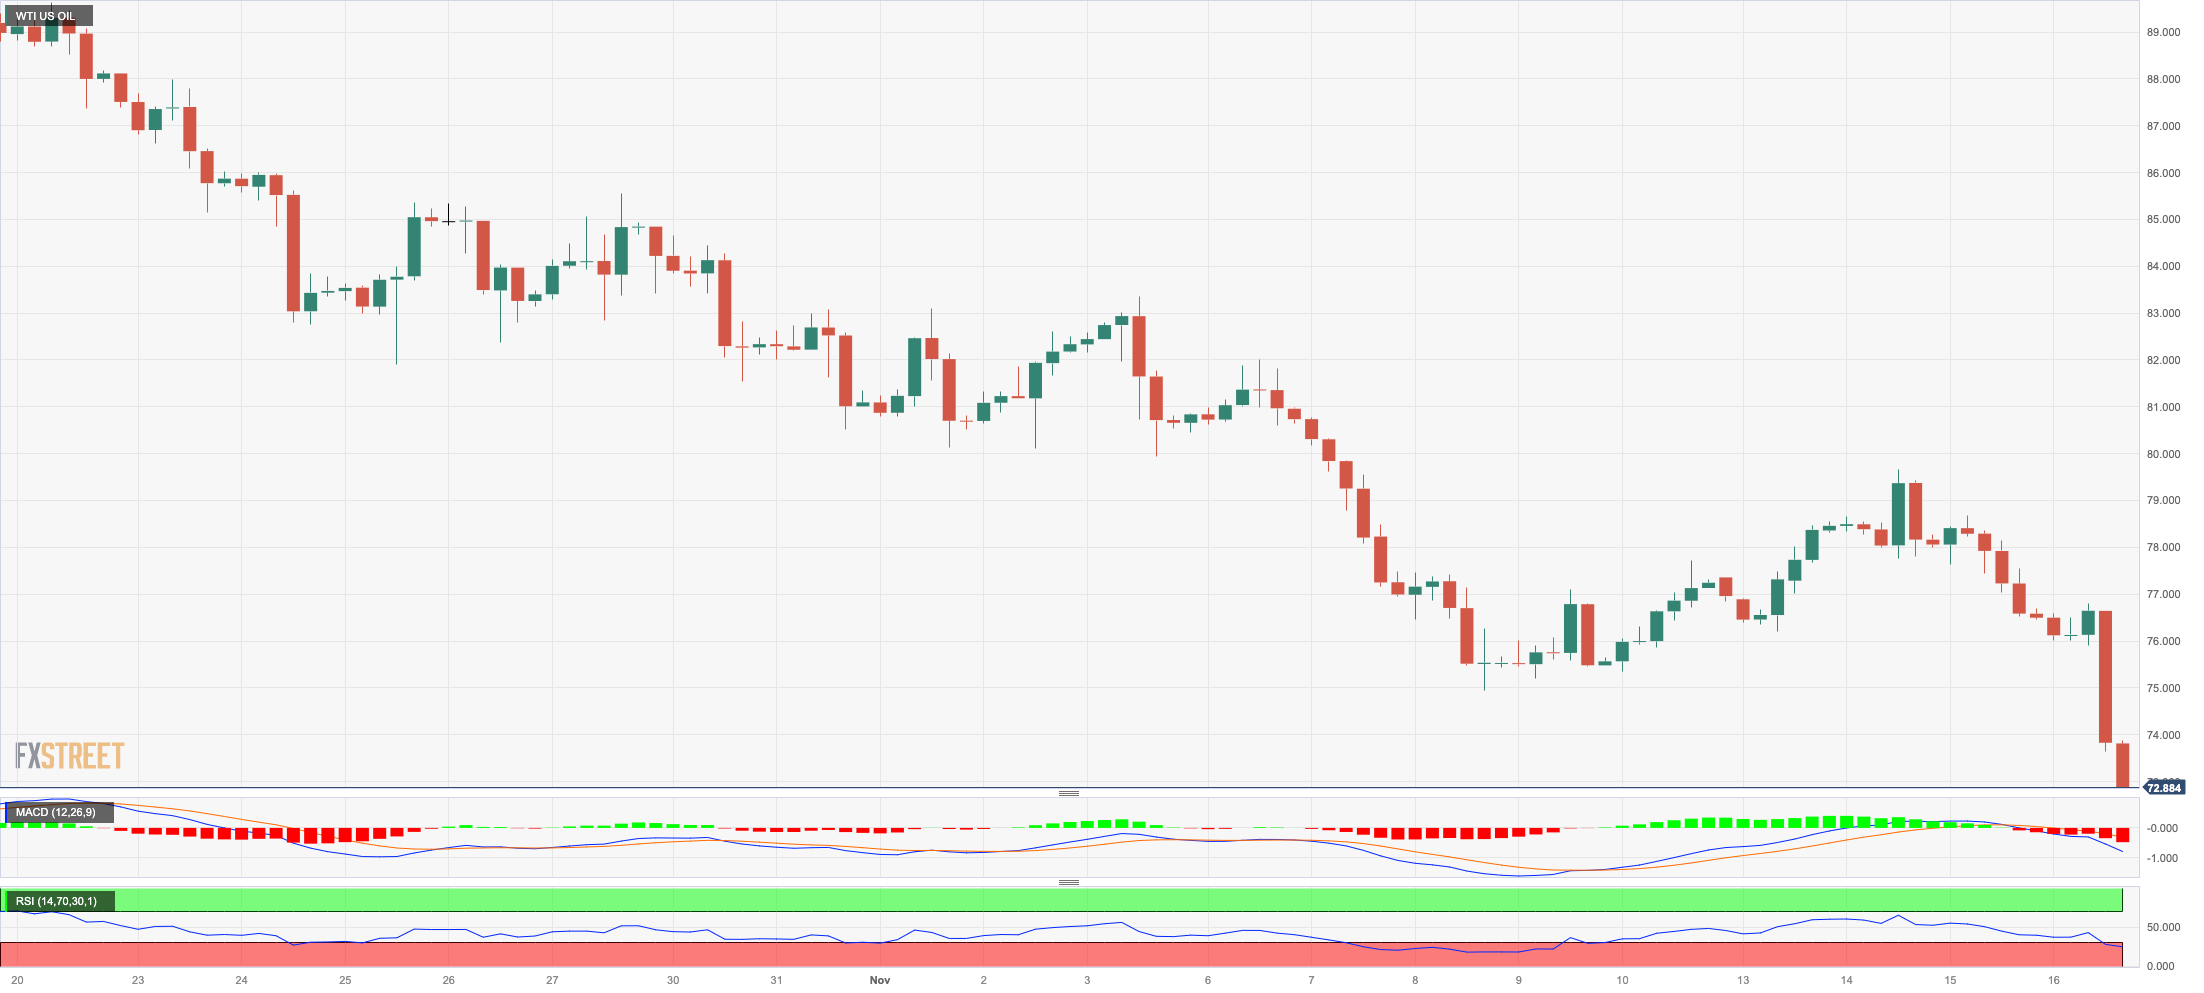
Further weakness dragged the prices of WTI to new four-month lows around the $72.00 mark per barrel on Thursday, an area also coincident with the key 200-month SMA.
The third decline in a row in the commodity this time came on the back of oversupply concerns, following the intense increase in US oil output in combination with a larger-than-expected build in US crude oil inventories during last week (+3.6M barrels), as reported by the EIA on Wednesday.
In addition, concerns surrounding the economic outlook in China and Europe also added to traders’ worries, all in contrast to the recently published reports from both the IEA and OPEC, which indicated further supply tightness in the latter part of the year.
WTI's November high of $80.15 (November 3) and the provisional 55-day SMA of $85.33 are seen farther north. Extra gains might confront the weekly top of $89.83 (October 18) before the 2023 peak of $94.99 (September 28). A weekly high of $97.65 (August 30, 2022) also appears ahead of the psychological $100.00 barrier. If WTI goes below the November low of $72.94 (November 10), it may challenge the key $70.00 mark per barrel prior to the 2023 low of $63.61 (May 4) and the important $60.00 yardstick.
Resistance levels: $79.72 $83.56 $85.85 (4H chart)
Support levels: $72.33 $70.18 $67.01 (4H chart)
GER40
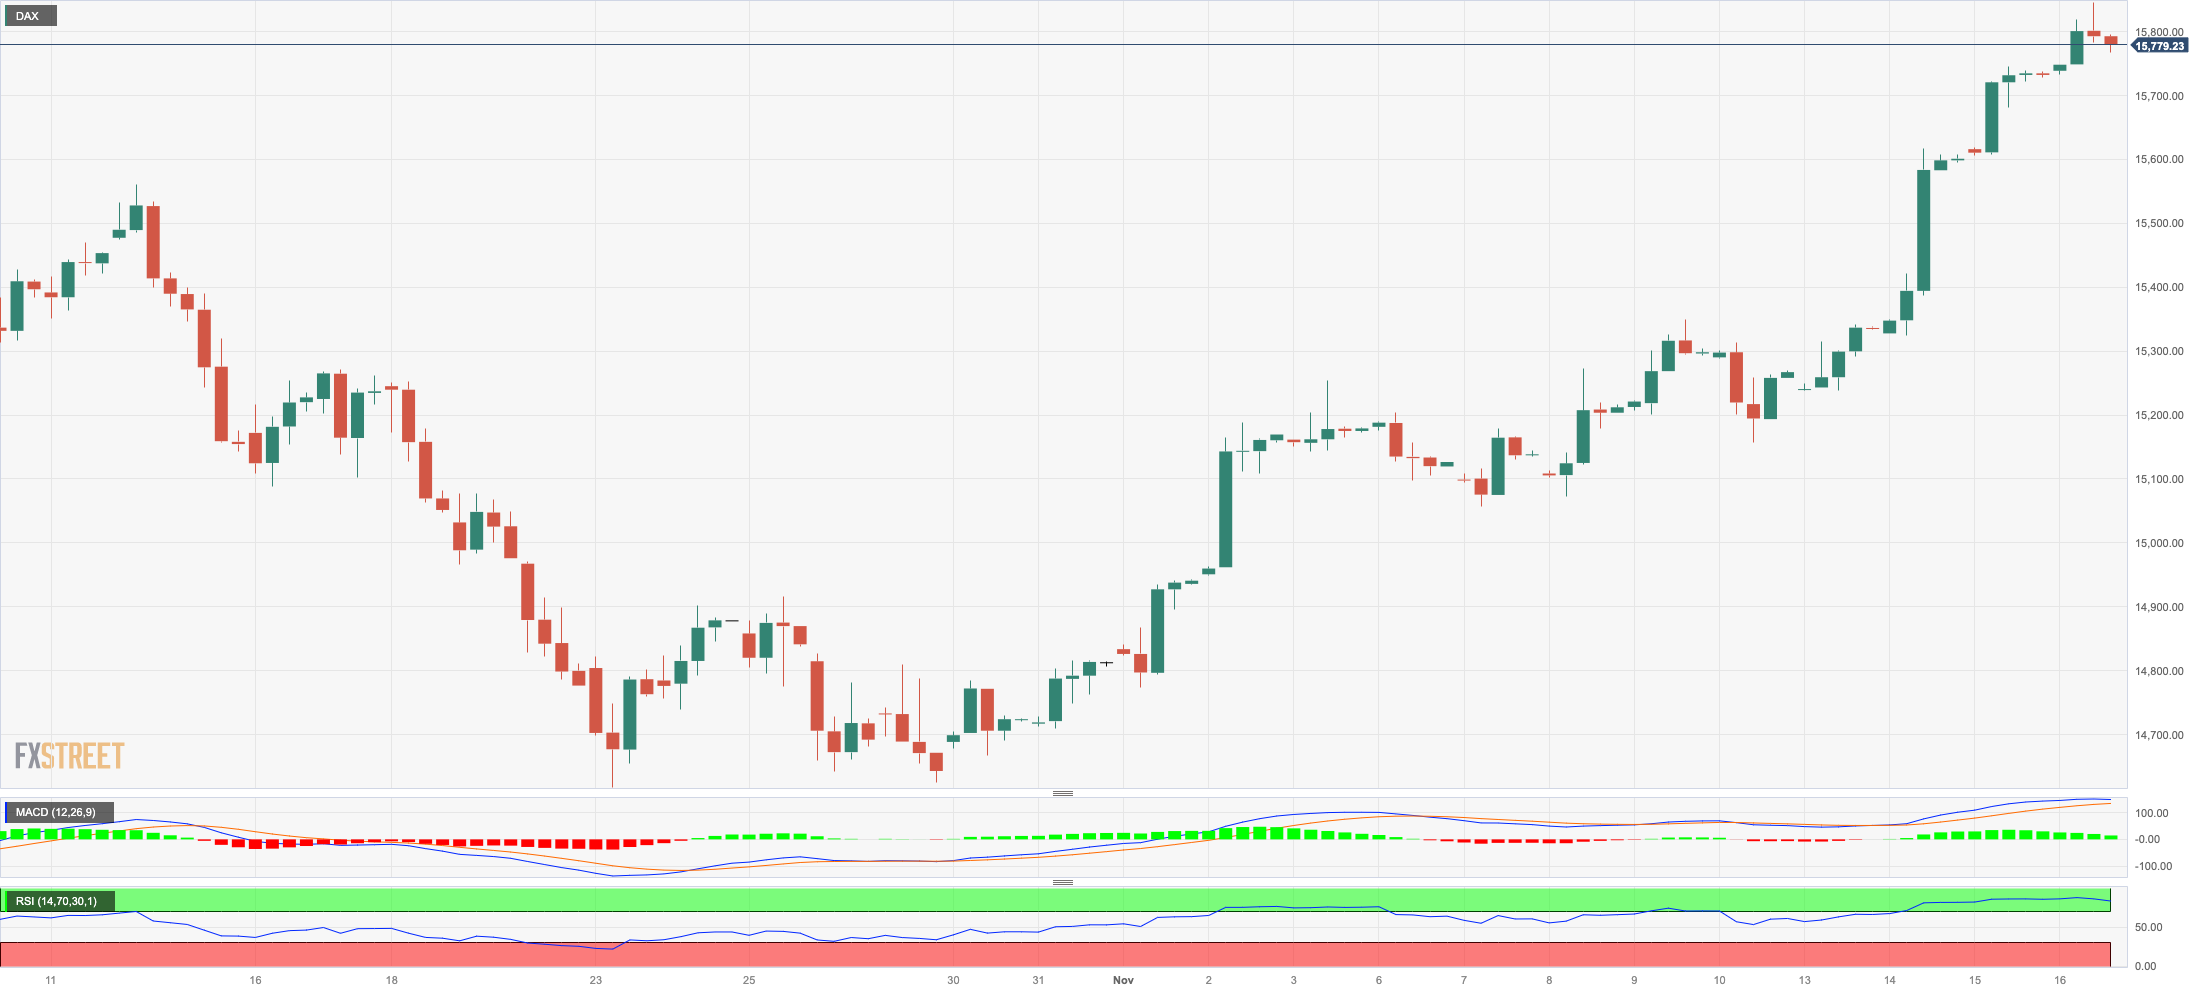
Germany’s reference DAX40 rose to new two-month tops past the 15800 level on Thursday. The move, however, fizzled out towards the end of the session, leaving equities with just humble gains for the day.
In the meantime, the index clinched its fourth session in a row with gains as market participants continued to assess the recent lower-than-expected US inflation figures, below-consensus CPI results in the UK, Chinese upbeat data releases from some key fundamentals, as well as the increasing probability that the Fed might start reducing rates as soon as in the spring of 2024.
The positive session in stocks came in contrast to the resumption of the downside pressure in 10-year bund yields, which approached the 2.55% region for the first time since mid-September.
The DAX40's next target is the November top of 15862 (November 16) prior to the September peak of 15989 (September 15). North from here aligns the weekly highs of 16042 (August 31) and 16060 (August 10) ahead of the all-time top of 16528 (July 31). On the contrary, the index might be pulled to the important 200-day SMA at 15649 before the intermediate 55-day SMA at 15337. The loss of this level might put a test of the October low of 14630 (October 23) back on the radar prior to the March low of 14458 (March 20). The December 2022 low of 13791 (December 20) comes next, seconded by the September 2022 low of 11862 (September 20). The everyday RSI surpassed the 69 yardstick.
Best Performers: Siemens AG, E.ON SE, Infineon
Worst Performers: Zalando SE, Siemens Energy AG, BASF
Resistance levels: 15862 15989 16042 (4H chart)
Support levels: 15409 15171 15068 (4H chart)
NASDAQ
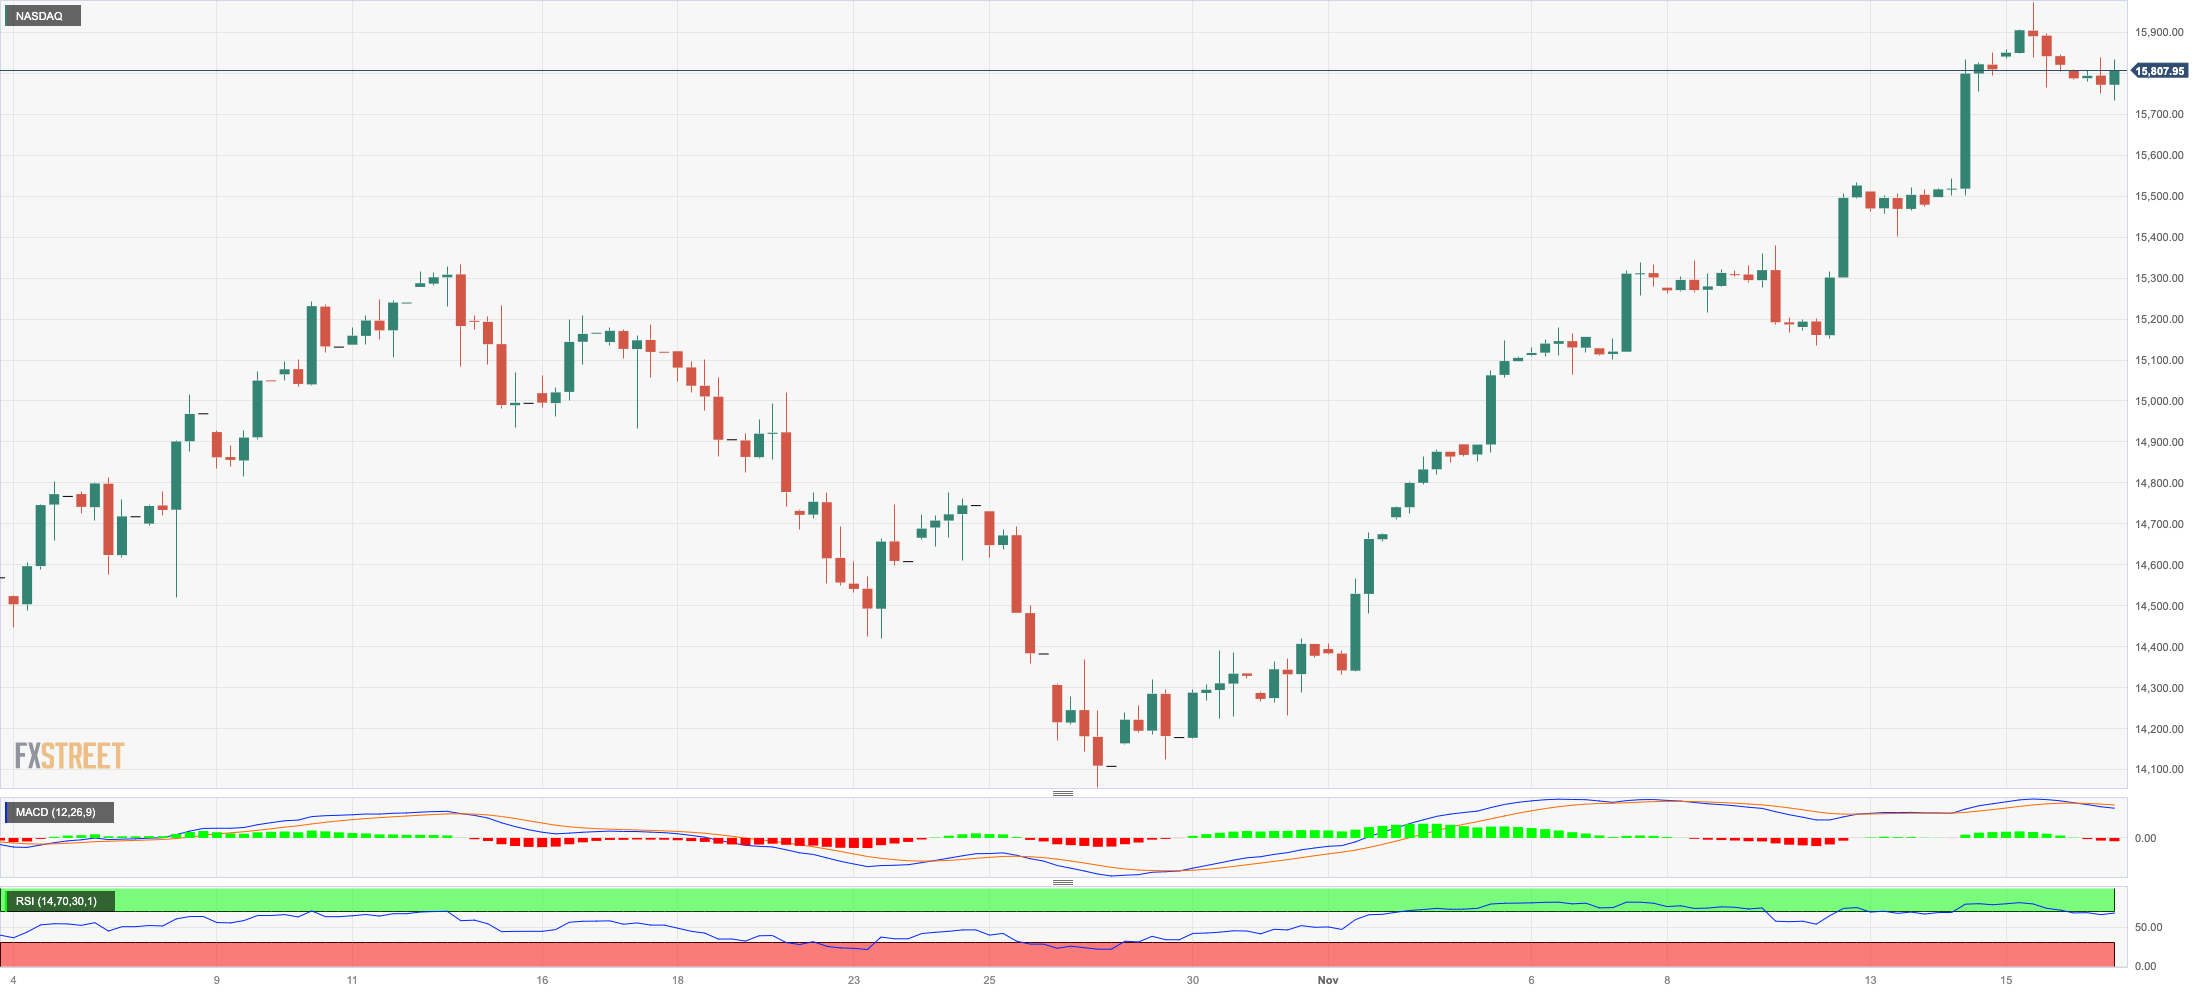
The tech reference Nasdaq 100 came under mild downside pressure after two straight sessions of gains.
Despite the daily pullback, the index remained well on track to close its third consecutive week in positive territory.
The knee-jerk in the tech sector came on the back of the inconclusive price action in the greenback and some renewed recession concerns, while the marked decline in US yields across the curve appears to have limited the downside.
Additional Nasdaq advances might propel the index to the November peak of 15904 (November 15) ahead of the 2023 high of 15932 (July 19), which is quickly followed by the round milestone of 16000. However, immediate support appears to be at the preliminary 55-day SMA of 15021, prior to the crucial 200-day SMA of 14165 and the October low of 14058 (October 26). Further losses might put the April bottom of 12724 (April 25) to the test before the March low of 11695 (March 13) and the 2023 low of 10696 (January 3). The RSI for the day settled around 68.
Top Gainers: Intel, Intuitive Surgical, DexCom
Top Losers: Cisco, Palo Alto Networks, Warner Bros Discovery
Resistance levels: 15904 15932 16607 (4H chart)
Support levels: 15127 14983 14058 (4H chart)
DOW JONES
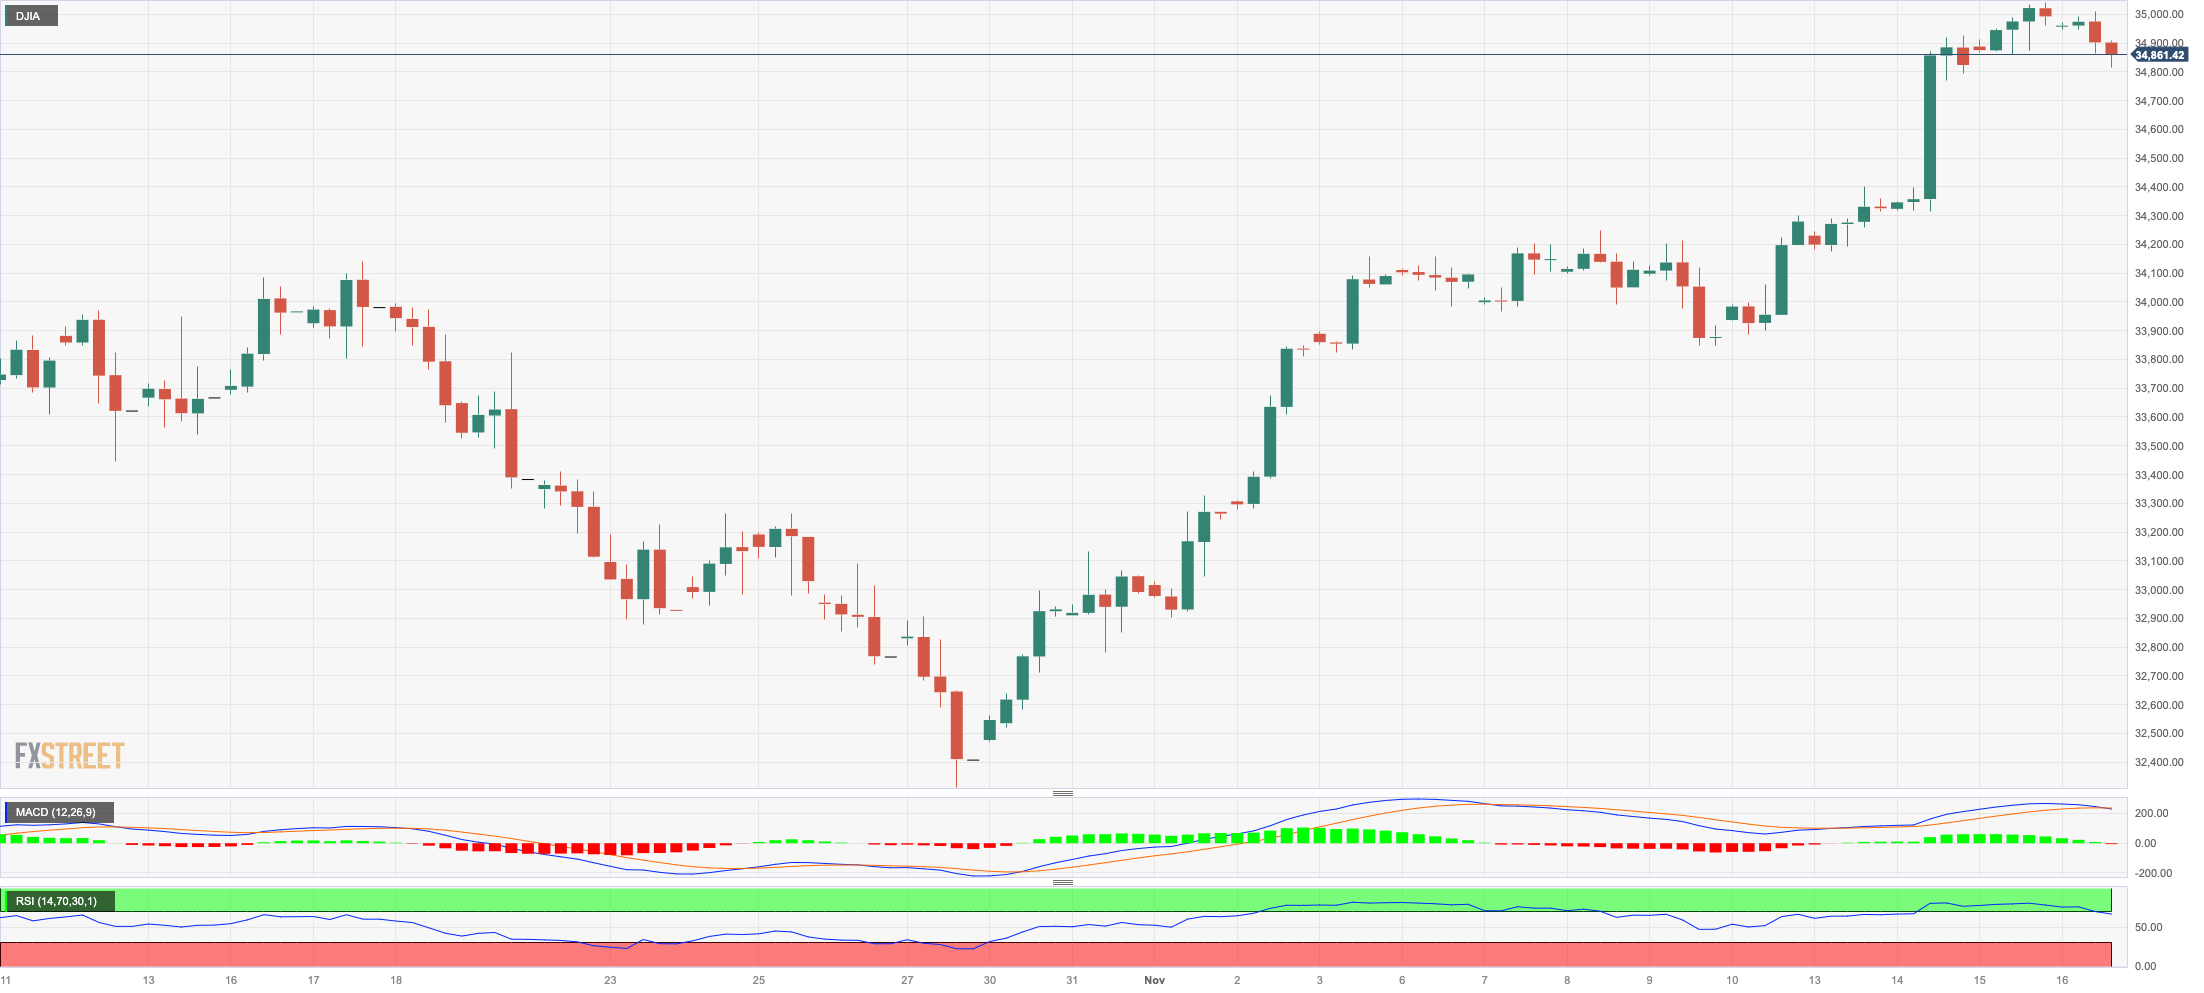
US equities tracked by the Dow Jones left behind two consecutive daily advances, including Wednesday’s move to three-month highs just above the 35000 yardstick, and retreated modestly on Thursday.
Recession fears appear to have weighed on investors’ sentiment following increasing weekly Initial Claims and discouraging prints from Industrial Production, the Philly Fed index, and the housing sector barometer, the NAHB index.
Indeed, those results poured cold water over optimism that the Fed might start reducing its interest rates as soon as in the summer of 2024, triggering some selling mood eventually.
Overall, the Dow Jones dropped 0.35% to 34868, the S&P500 eased 0.08% to 4499, and the tech-benchmark Nasdaq Composite receded 0.04% to 14097.
Given the recent market trend, the Dow Jones should now target the November peak of 35051 (November 15), which is closely followed by the weekly high of 35070 (August 31). The index may then hit the 2023 top of 35679 (August 1) before reaching the all-time high of 36952 (January 5, 2022). Having said that, the crucial 200-day SMA is projected to provide early resistance at 33830, ahead of the October low of 32327 (October 27). The 2023 low is 31429 (March 15), and the 2022 low is 28660 (October 13). The daily RSI retreated to the sub-65 zone.
Top Performers: Intel, McDonald’s, Travelers
Worst Performers: Cisco, Walmart, Walgreen Boots
Resistance levels: 35051 35070 35578 (4H chart)
Support levels: 34304 33859 33647 (4H chart)
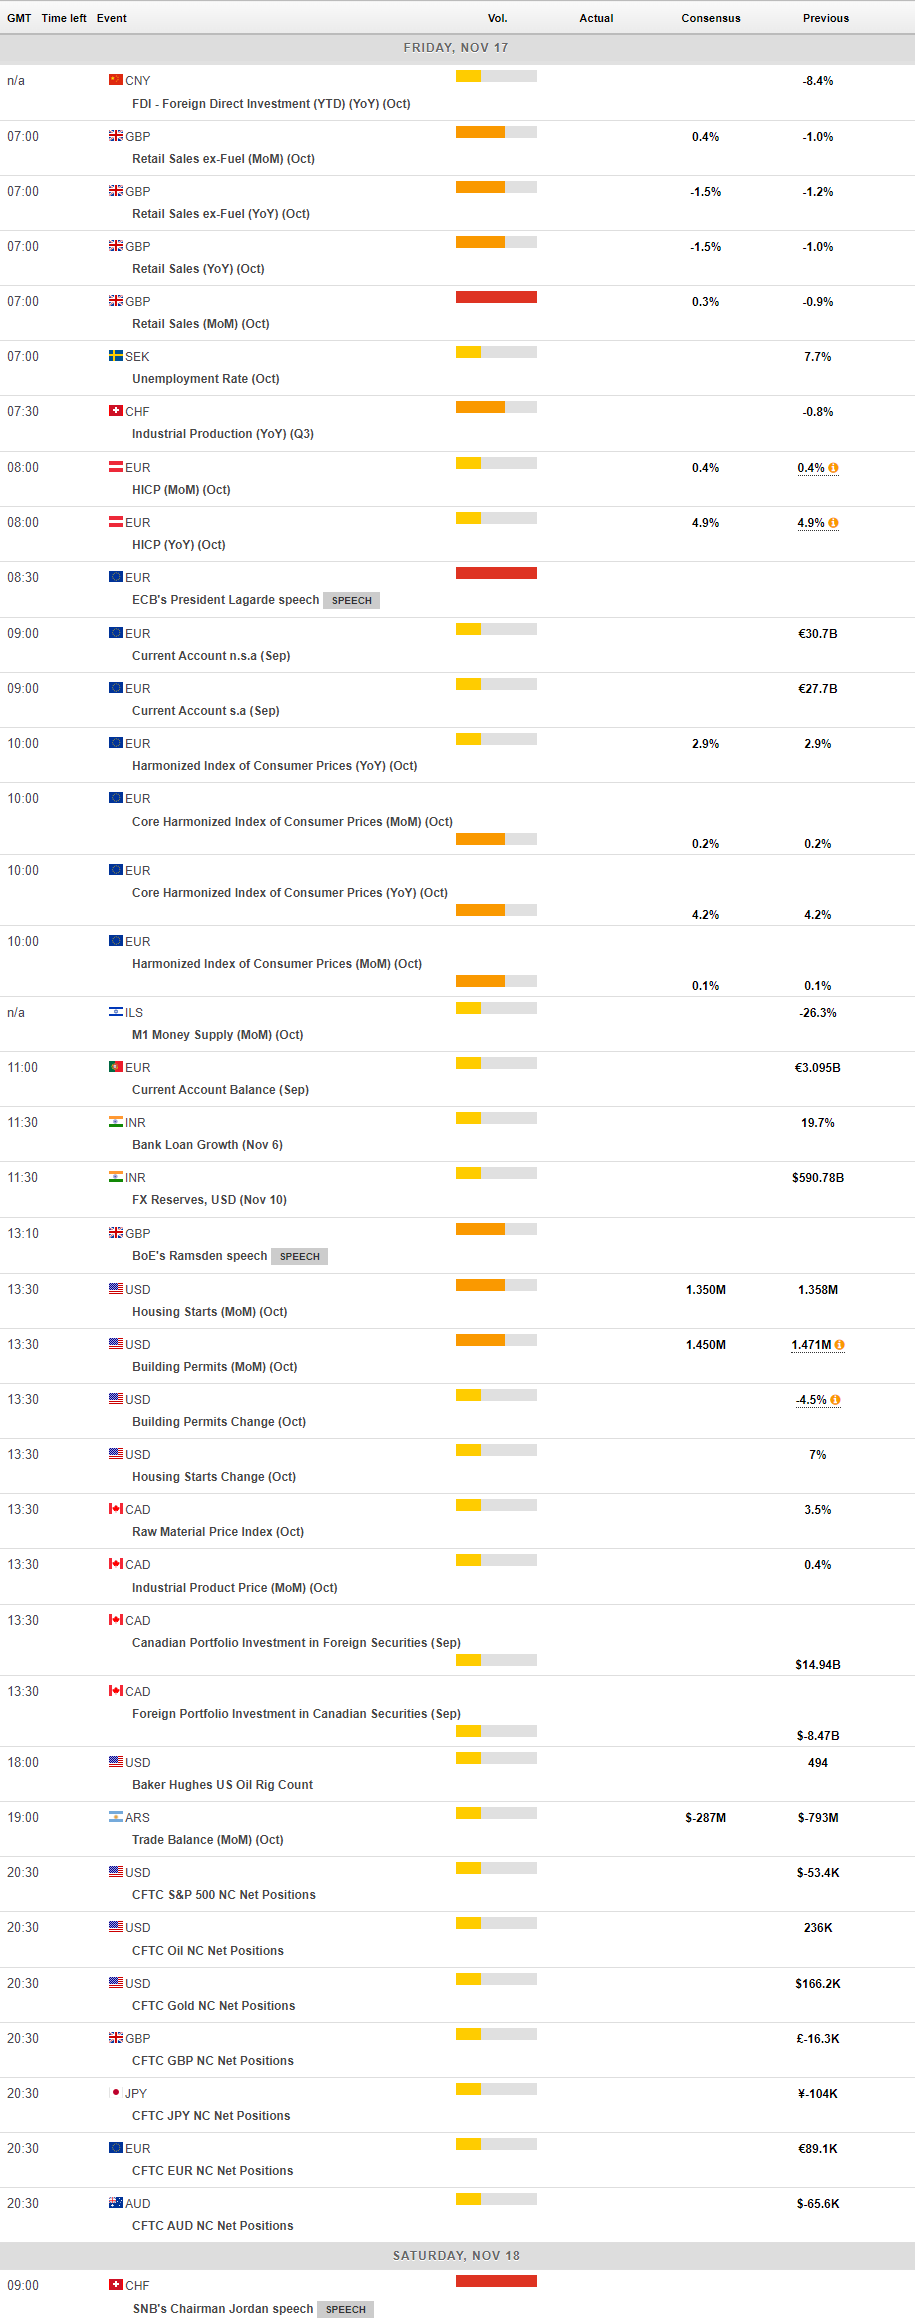
MACROECONOMIC EVENTS
All Information & Updates provided by:

All information relating to the financial markets available on this page has been prepared and issued by FXStreet (Forexstreet SL, Spain, Reg: B62498233) on the basis of publicly available information and all information believed to be reliable and does not conflict with Kuwaiti local laws, and all necessary care has been taken to before the company to ensure that the facts mentioned are correct from the source.
NCM Investment nor any of its directors or employees shall in any way be held responsible for the contents of this news, and the information contained on this page is intended only to provide clients with publicly available information and should not be construed as investment advice, report or analysis and/or constitute an offer or invitation to buy or sell financial instruments of any kind.
RISK WARNING: Forex and CFDs are highly risky leveraged products, as losses can exceed deposits. Please ensure you understand all the risks and take independent advice if necessary. NCM will segregate the clients based on the criteria of the regulator and its bylaws. NCM does not provide any advisory service; the material published does not constitute advice or a recommendation for a transaction in any financial instrument. NCM accepts no responsibility for any use of the content presented and any consequences of that use. Anyone acting on the information provided does so at their own risk.