
- Contact Us:
-

-

-

-


Daily Market Updates
20 Nov 2023
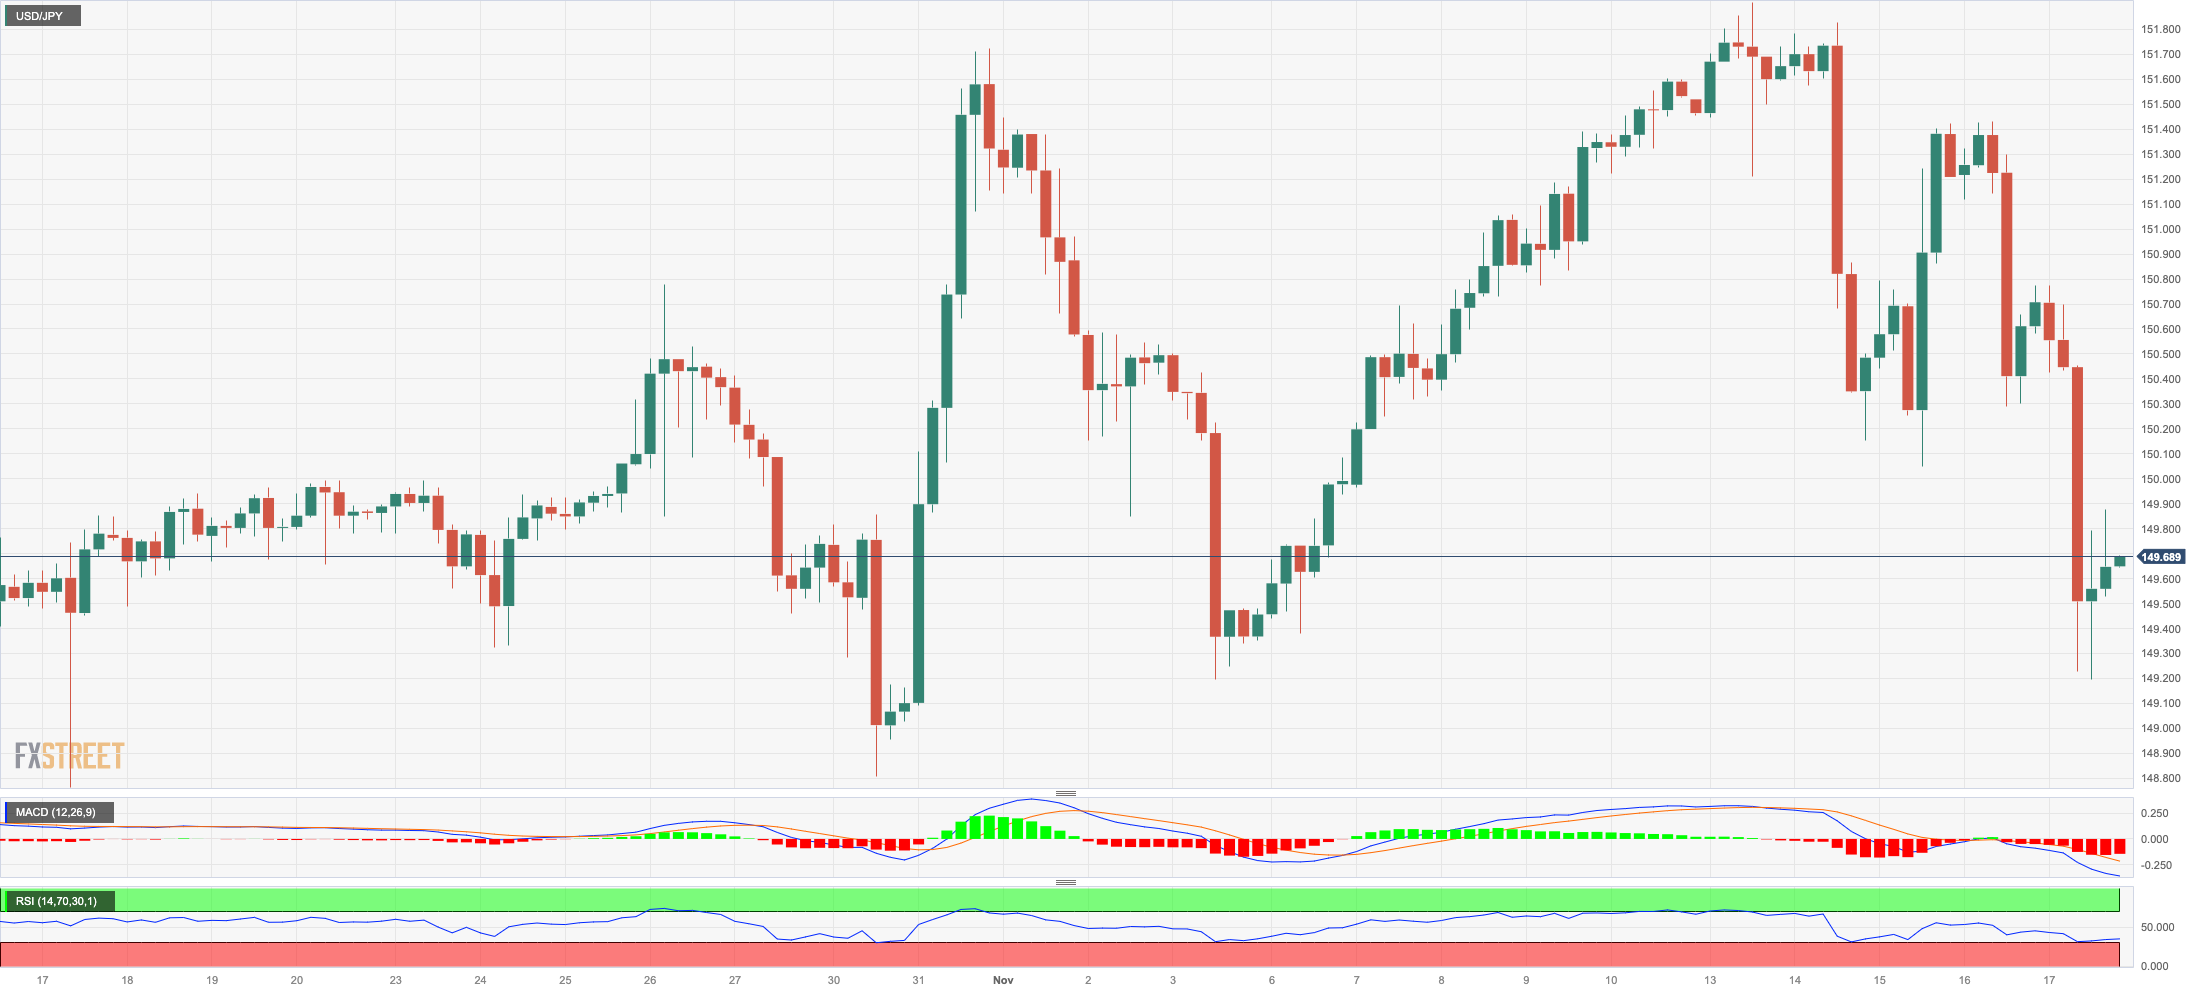
USDJPY
USD/JPY added to Thursday’s pullback and retreated to multi-session lows near 149.20, challenging the provisional 55-day SMA and maintaining the pessimism intact in the latter part of the week.
Extra retracement in the greenback, coupled with mixed US yields and declining JGB 10-year yields, all forced the pair to break below the key 150.00 support on Friday.
In addition, BoJ Governor Ueda commented that the weak yen presents both positive and negative implications for the economy. He highlighted that although a weak yen contributes to increased import prices, it also serves to enhance export competitiveness and bolster multinational corporate profits.
There were no data releases scheduled in “The Land of the Rising Sun” on Friday.
In case USD/JPY accelerate its losses, it could confront the October low of 147.27 (October 3) ahead of the weekly low of 145.89 (September 11) and the September low of 144.43 (September 1). There are no substantial support levels beyond that until the August low of 141.50 (August 7), which comes before the 200-day SMA of 141.36 and the July low of 137.23 (July 14). On the upside, if the pair breaks over the 2023 high of 151.90 (November 13), it may then test the 2022 top of 151.94 (October 21), followed by the round milestone of 152.00. The RSI dropped markedly to the 46 region.
Resistance levels: 151.42 151.90 151.94 (4H chart)
Support levels: 149.19 148.80 148.16 (4H chart)
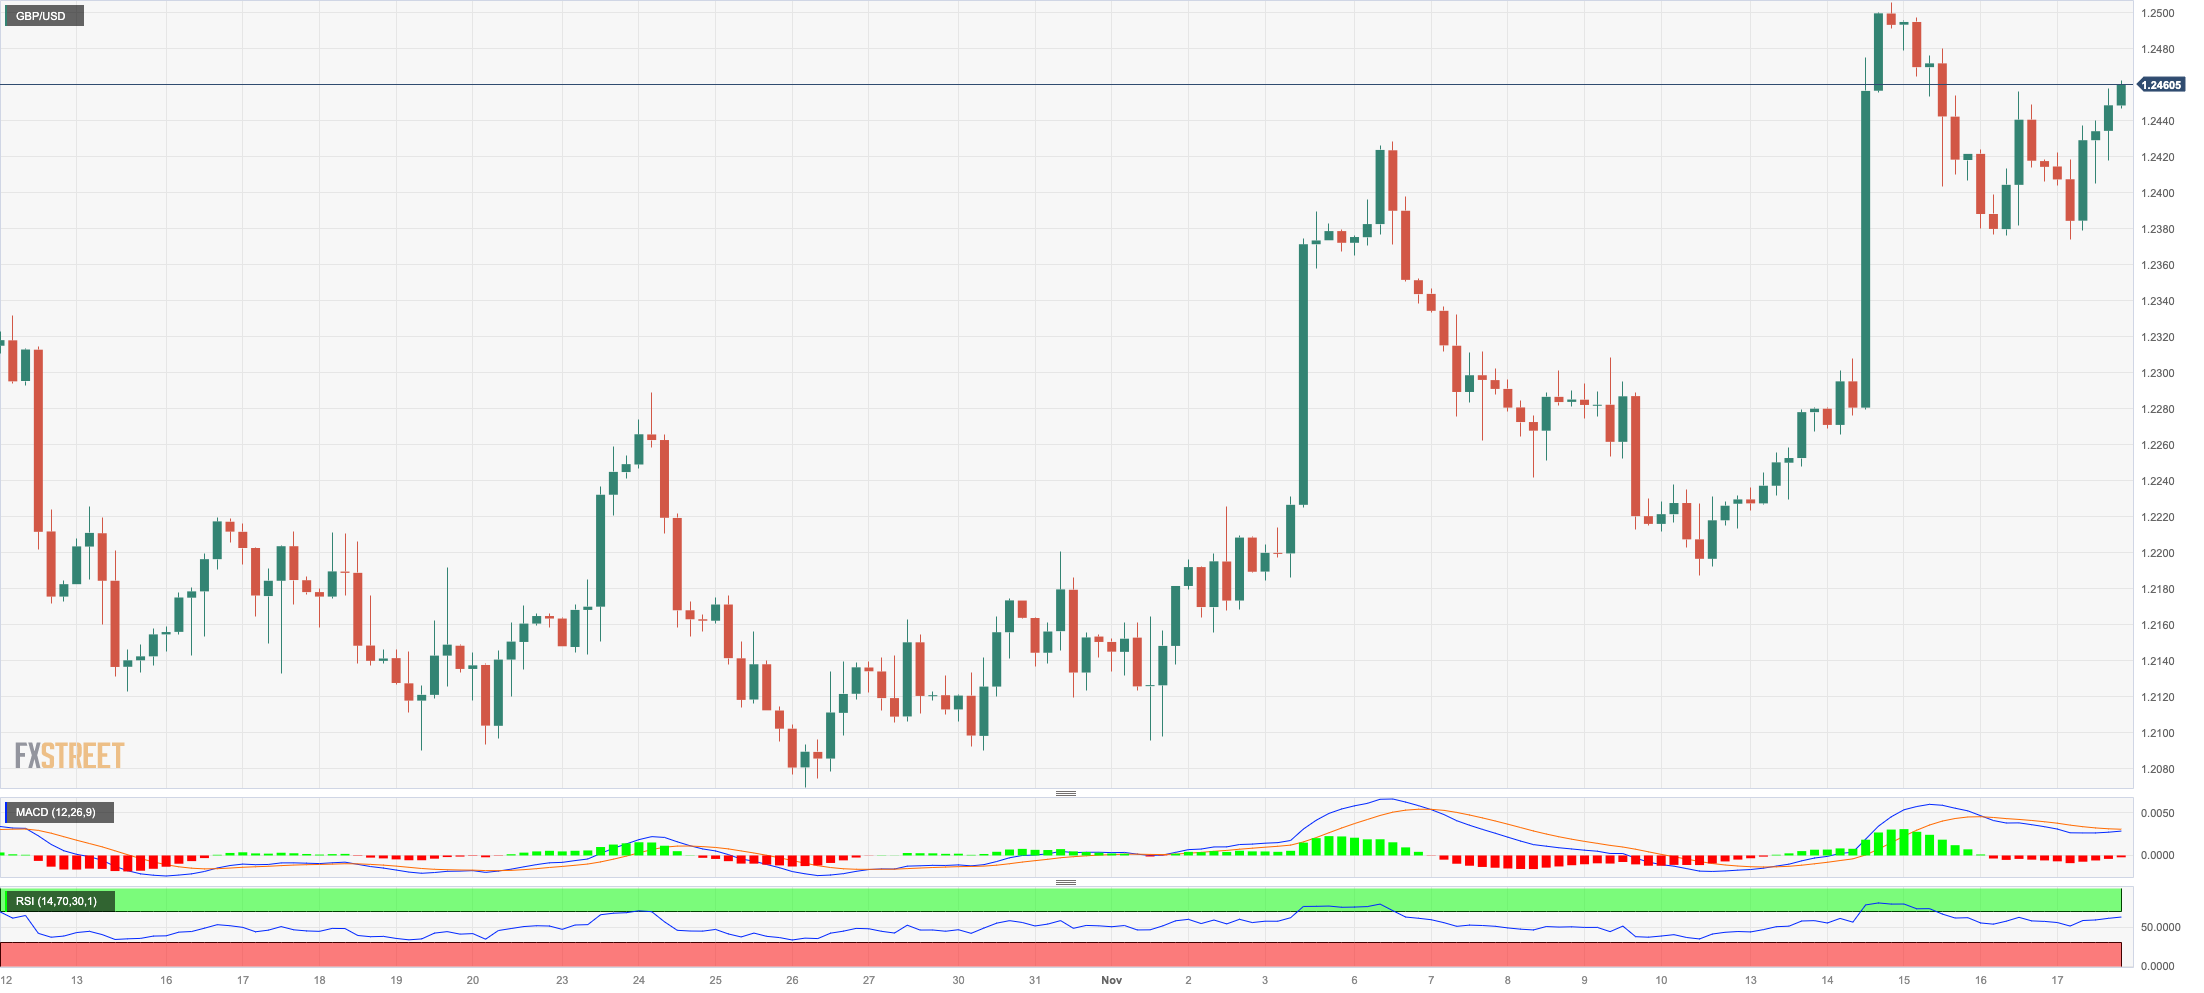
GBPUSD
Further weakness in the greenback encouraged GBP/USD to climb to two-day highs around 1.2460, leaving behind two straight sessions of losses at the end of the week.
In fact, sterling managed to set aside some weakness after investors started to reprice a pause in the BoE’s hiking campaign, particularly following softer-than-expected UK inflation figures.
These rumours favouring interest rate cuts by the central bank appeared reinforced after disappointing results from the UK calendar saw headline Retail Sales contract 2.7% in the year to October and 2.4% YoY excluding Fuel.
From the BoE, MPC member Ramsden mentioned that he wouldn't dismiss the possibility of needing to increase the bank rate in the future in response to evidence of prolonged inflationary pressures. He noted the presence of ongoing potential risks regarding inflation but emphasized that his decisions would remain contingent on his evaluations of economic developments in each meeting.
After clearing the November high of 1.2505 (November 14), GBP/USD may dispute the intermediate 100-day SMA around 1.2507. The weekly top of 1.2548 (September 11) is followed by weekly peaks of 1.2746 (August 30), 1.2818 (August 10), and 1.2995 (July 27), all of which are above the key 1.3000 level. The weekly low of 1.2187 (November 10) emerges as the immediate contender for bears, followed by weekly lows of 1.2069 (October 26) and 1.2037 (October 3). If the latter is breached, the crucial 1.2000 barrier may be challenged before the 2023 low of 1.1802 is reached (March 8). The day-to-day RSI increased past the 61 level.
Resistance levels: 1.2464 1.2505 1.2548 (4H chart)
Support levels: 1.2373 1.2225 1.2187 (4H chart)
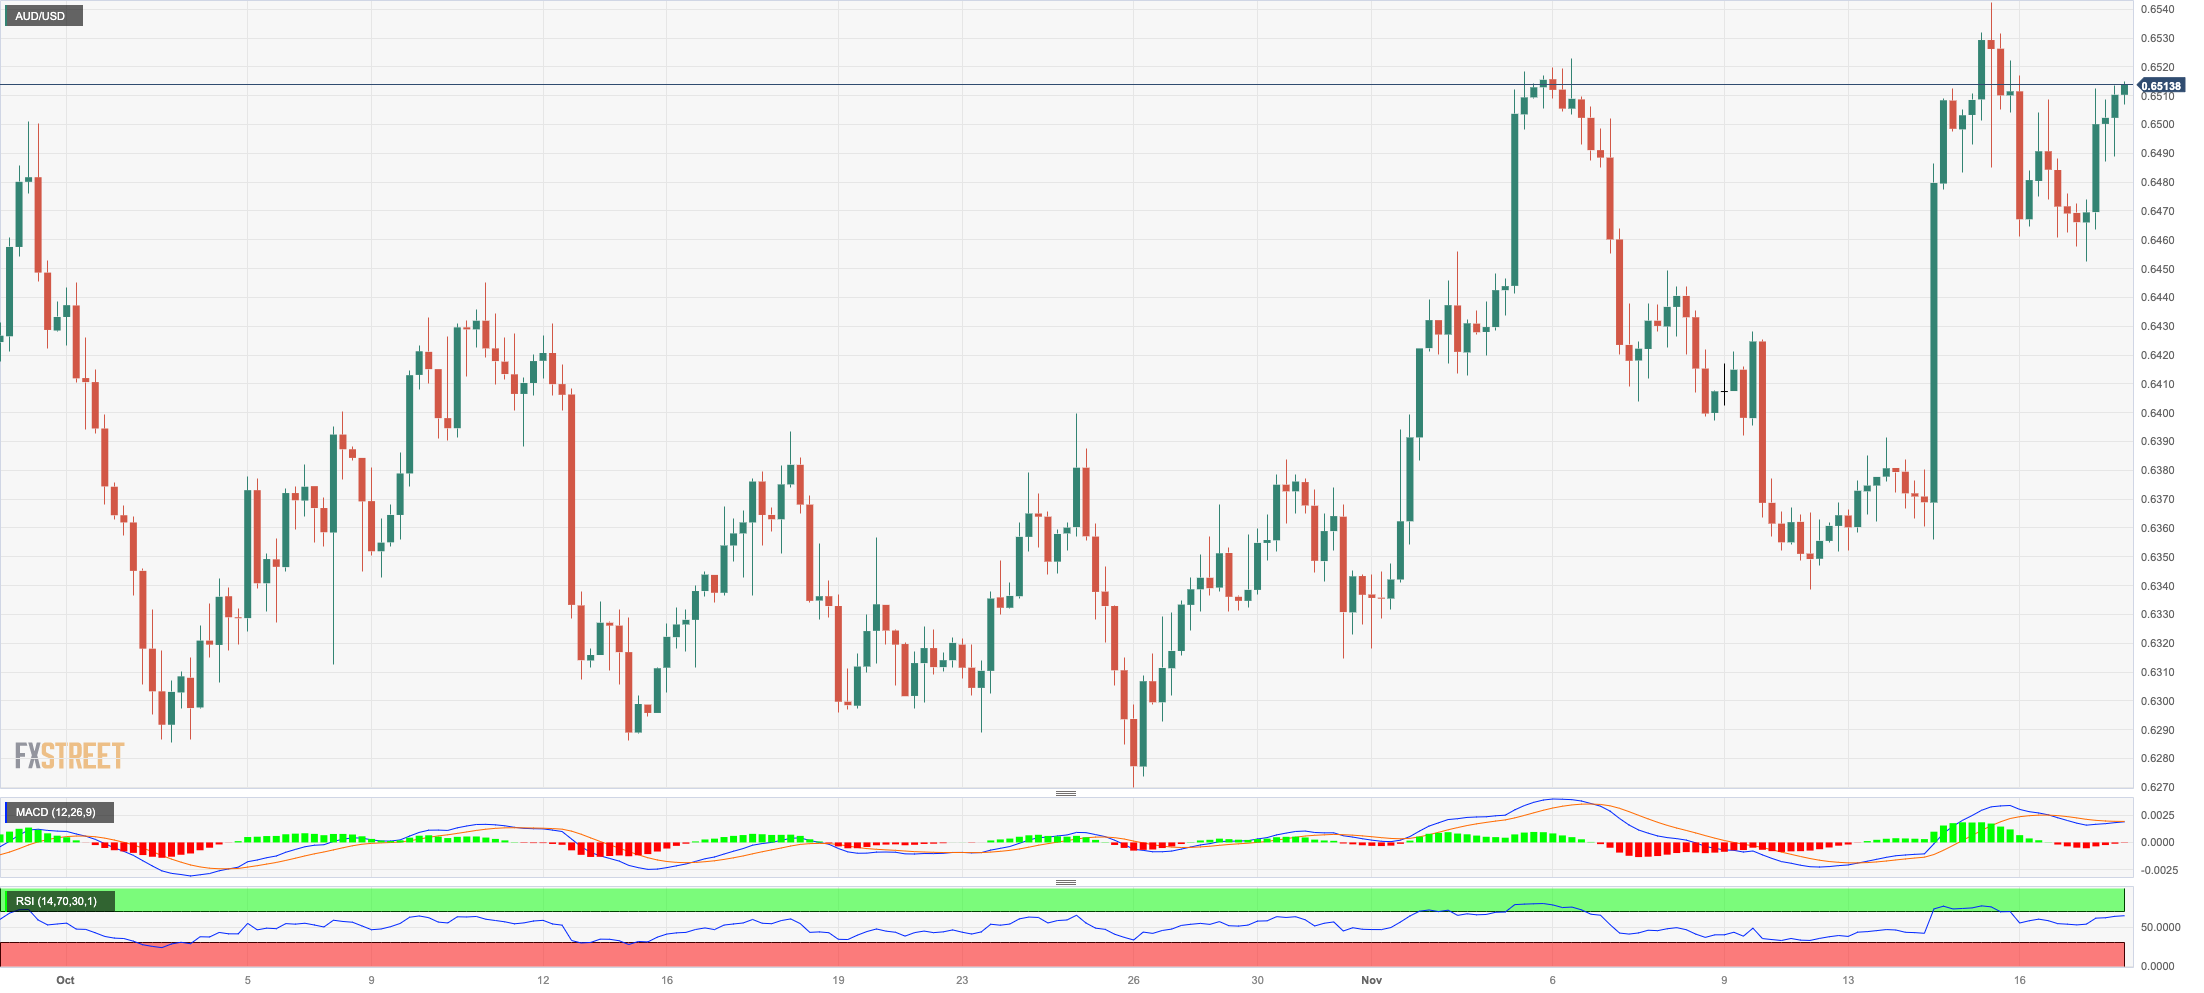
AUDUSD
AUD/USD resumed the uptrend and reclaimed the area beyond 0.6500 the figure at the end of the week, ending the session just pips below the three-month tops recorded on November 15.
The pair’s daily improvement was exclusively accompanied by the bearish performance of the greenback across the board and came amidst the mixed tone in the commodity complex.
The Australian docket was empty on Friday.
If bulls push further, the AUD/USD might break above the November top of 0.6541 (November 15), perhaps facing the crucial 200-day SMA at 0.6595 before reaching the weekly peak of 0.6616 (August 10). North from here, the July high of 0.6894 (July 14) is aligned, seconded by the June top of 0.6899 (June 16), all ahead of the important 0.7000 threshold. In comparison, the 55-day SMA at 0.6395 provides temporary support ahead of the 2023 bottom of 0.6270 (October 26). If this region fails, the pair is likely to dispute the round level of 0.6200, ahead of the 2022 low of 0.6169 (October 13). The daily RSI climbed to the 60 region.
Resistance levels: 0.6541 0.6616 0.6739 (4H chart)
Support levels: 0.6452 0.6382 0.6338 (4H chart)
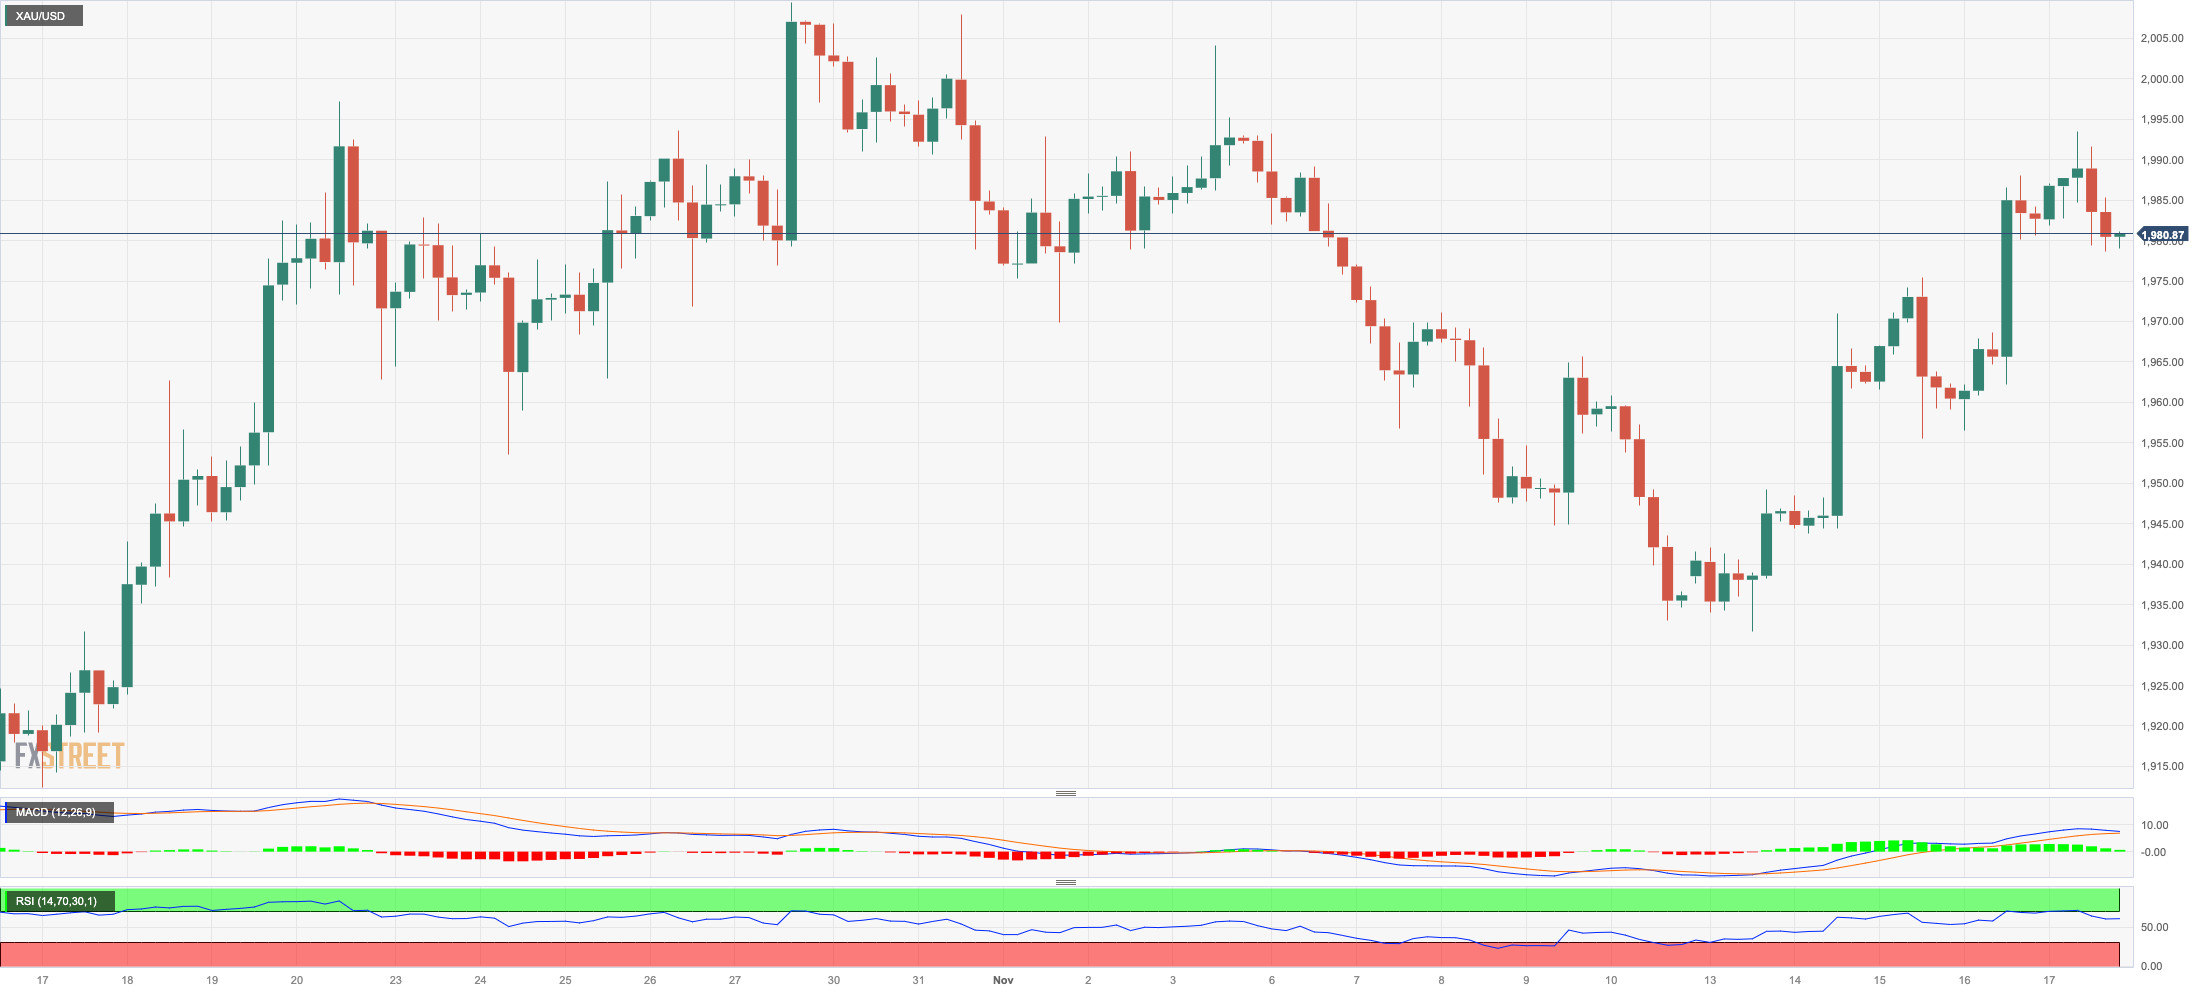
GOLD
Gold prices could not sustain an earlier advance past the $1990 level on Friday, eventually surrendering ground and closing the week around the $1980 mark per troy ounce.
The inconclusive price action in the yellow metal was against the backdrop of a drop to fresh two-month lows in the greenback, while US yields traded in an erratic performance across the curve.
Meanwhile, there's an anticipation that the precious metal will closely track the movements of the Fed, considering the growing discussions in the market about the possibility of the Fed initiating interest rate cuts in the first half of 2024.
The weekly high of $1993 (November 17) for gold is immediately to the upside, ahead of the October top of $2009 (October 27). If the metal breaks above this level, a test of the 2023 peak of $2067 (May 4) might be on the horizon before the 2022 high of $2070 (March 8) and the all-time top of $2075 (August 7, 2020). Instead, if selling pressure develops, gold may test the November low of $1931 (November 13), which comes ahead of the preliminary 55-day SMA of $1927. Down from here, the October low of $1810 (October 6), the 2023 bottom of $1804 (February 28), and the major contention region of $1800 are all aligned.
Resistance levels: $1993 $2009 $2048 (4H chart)
Support levels: $1955 $1938 $1908 (4H chart)
CRUDE WTI
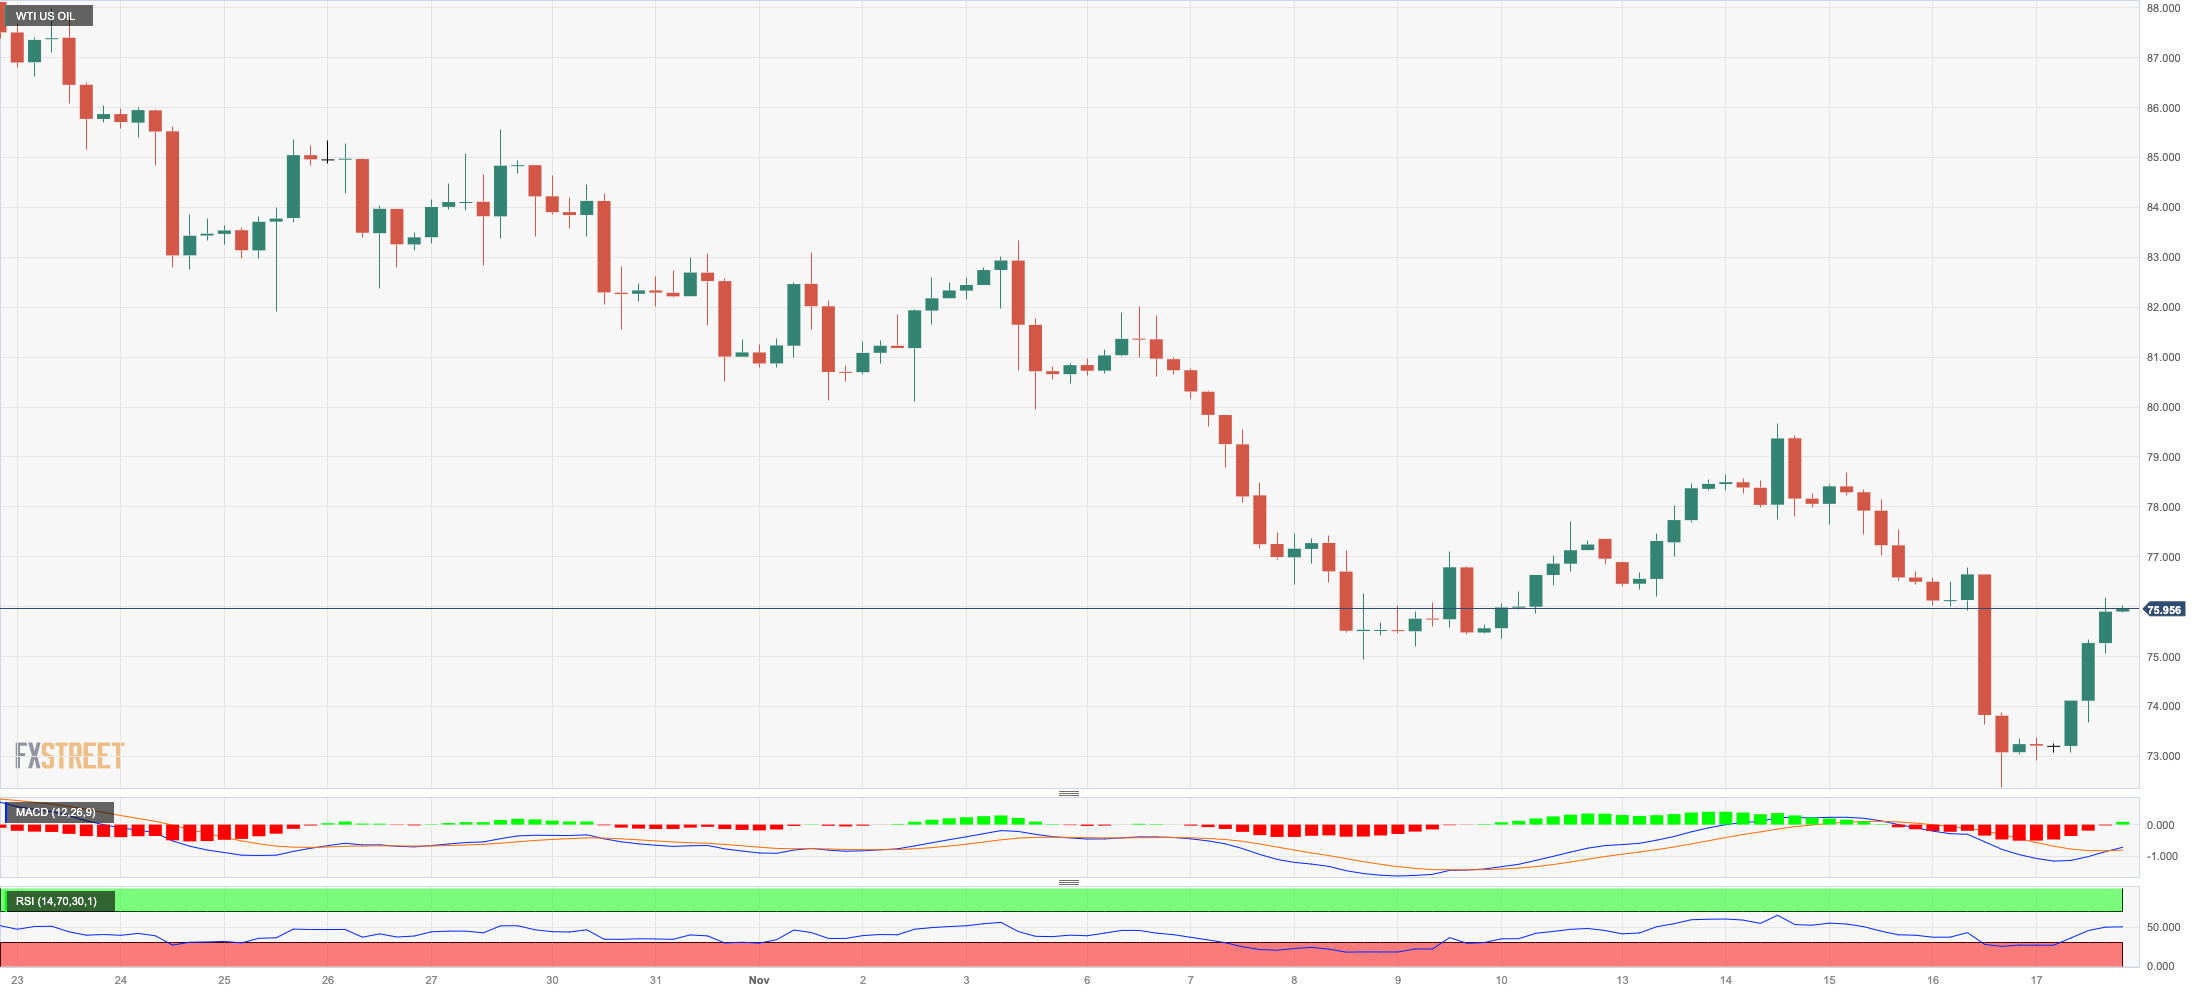
WTI prices closed the fourth consecutive week of losses despite almost fully recouping Thursday’s steep decline on Friday.
In fact, crude oil prices rebounded from the area of four-month lows near the $72.00 mark on the back of renewed speculation that the OPEC could reduce its oil output and Saudi Arabia could extend its voluntary output cuts.
Also adding to the commodity’s daily recovery were US sanctions against Russian companies transporting crude oil above the G7’s price cap, while another negative session in the dollar also underpinned the bounce in WTI.
In the calendar, US total active oil rigs rose to 500 (from 494) in the week to November 17, according to driller Baker Hughes.
Further north, WTI might challenge the key 200-day SMA at $78.13 prior to the November high of $80.15 (November 3) and the provisional 55-day SMA of $85.15. Extra gains may face the weekly top of $89.83 (October 18) before the 2023 peak of $94.99 (September 28) and the weekly high of $97.65 (August 30, 2022), all ahead of the psychological $100.00 mark. If WTI falls below the November low of $72.22 (November 16), it may test the critical $70.00 level per barrel before the 2023 bottom of $63.61 (May 4) and the critical $60.00 yardstick.
Resistance levels: $76.14 $79.72 $83.56 (4H chart)
Support levels: $72.13 $70.18 $67.01 (4H chart)
GER40
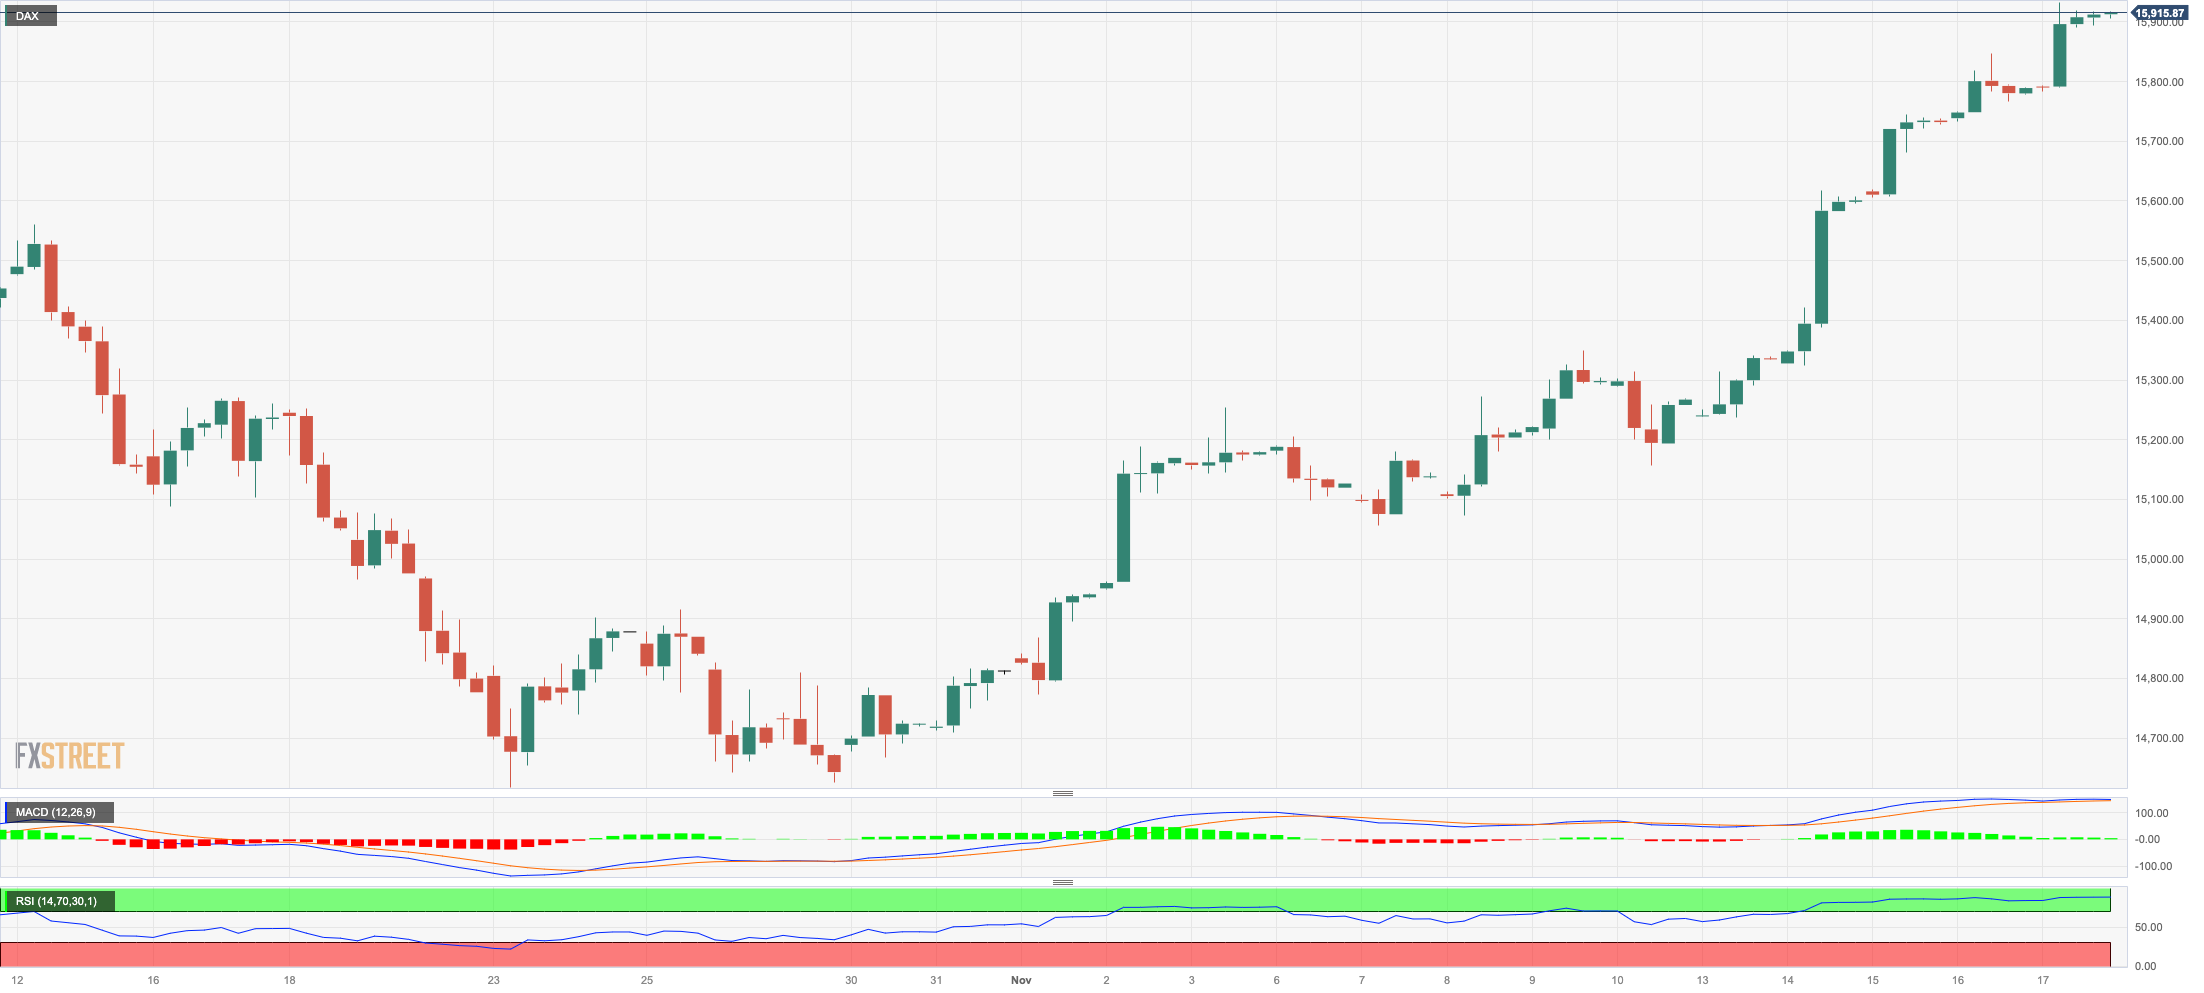
German equities advanced in every session of this week, lifting the benchmark DAX40 to the 15900 region, or two-month highs, on Friday.
The upward shift in the index aligned with substantial increases observed in European counterparts. Investors maintained their evaluation of enduring disinflationary pressures in the US, diminished UK CPI figures, recent promising outcomes from Chinese data, and the rising likelihood of the Fed commencing rate reductions as early as spring 2024.
Bolstering the above, there seems to be a rising conviction that the ECB might start reducing its rates in Q2 2024.
The daily advance in the DAX40 came in line with the small recovery in the 10-year bund yields before hitting fresh multi-week lows.
The DAX40's next objective is the November high of 15952 (November 17), which comes just before the September top of 15989 (September 15). The weekly peaks of 16042 (August 31) and 16060 (August 10) are aligned north of here, ahead of the all-time high of 16528 (July 31). On the contrary, the index might be dragged to the 200-day SMA at 15652 before the intermediate 55-day SMA at 15338. The breakdown of this level may reintroduce a test of the October low of 14630 (October 23) prior to the March low of 14458 (March 20). Following that is the December 2022 low of 13791 (December 20), prior to the September 2022 low of 11862 (September 20). The everyday RSI entered the overbought zone past 72.
Best Performers: Siemens Energy AG, Deutsche Bank AG, Hannover Rueck SE
Worst Performers: Infineon, Covestro, Henkel VZO
Resistance levels: 15952 15989 16042 (4H chart)
Support levels: 15411 15171 15068 (4H chart)
NASDAQ
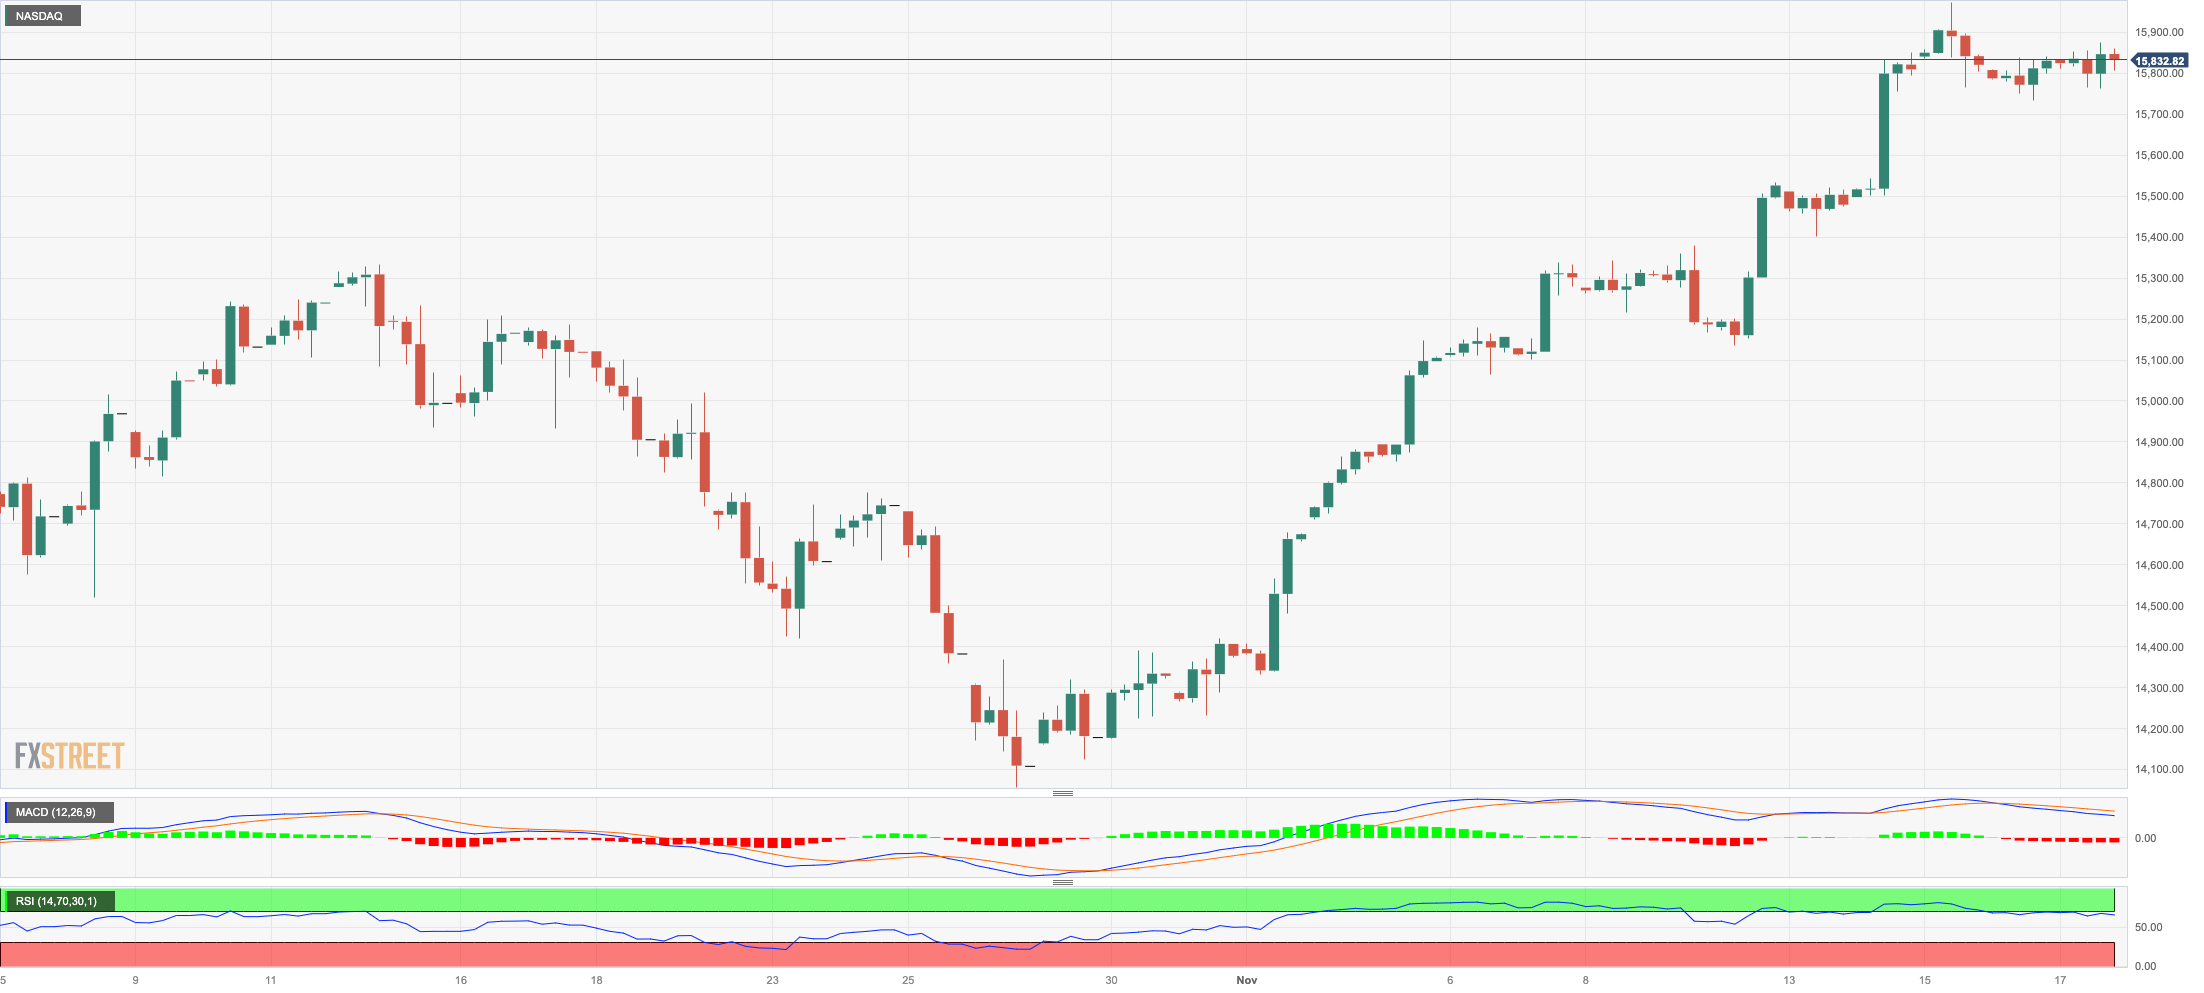
Another positive session of US tech equities saw the reference Nasdaq 100 advance for the fourth consecutive session on Friday.
The marginal improvement in the index came on the back of a deep sell-off in the greenback, mixed US yields, and the increasing perception that the Federal Reserve is done raising rates for the time being.
The latter opened the door to market chatter suggesting interest rate cuts around the spring of next year.
Additional Nasdaq gains might take the index to the November top of 15904 (November 15), which is immediately followed by the round milestone of 16000. However, immediate support looks to be at the preliminary 55-day SMA of 15027, which is located before the critical 200-day SMA of 14181 and the October low of 14058 (October 26). Further losses might test the April bottom of 12724 (April 25) ahead of the March low of 11695 (March 13) and the 2023 low of 10696 (January 3). For the day, the RSI looked steady around 69.
Top Gainers: Ross Stores, Warner Bros Discovery, Enphase
Top Losers: Applied Materials, Microsoft, JD.com Inc Adr
Resistance levels: 15904 15932 16607 (4H chart)
Support levels: 15140 14983 14058 (4H chart)
DOW JONES
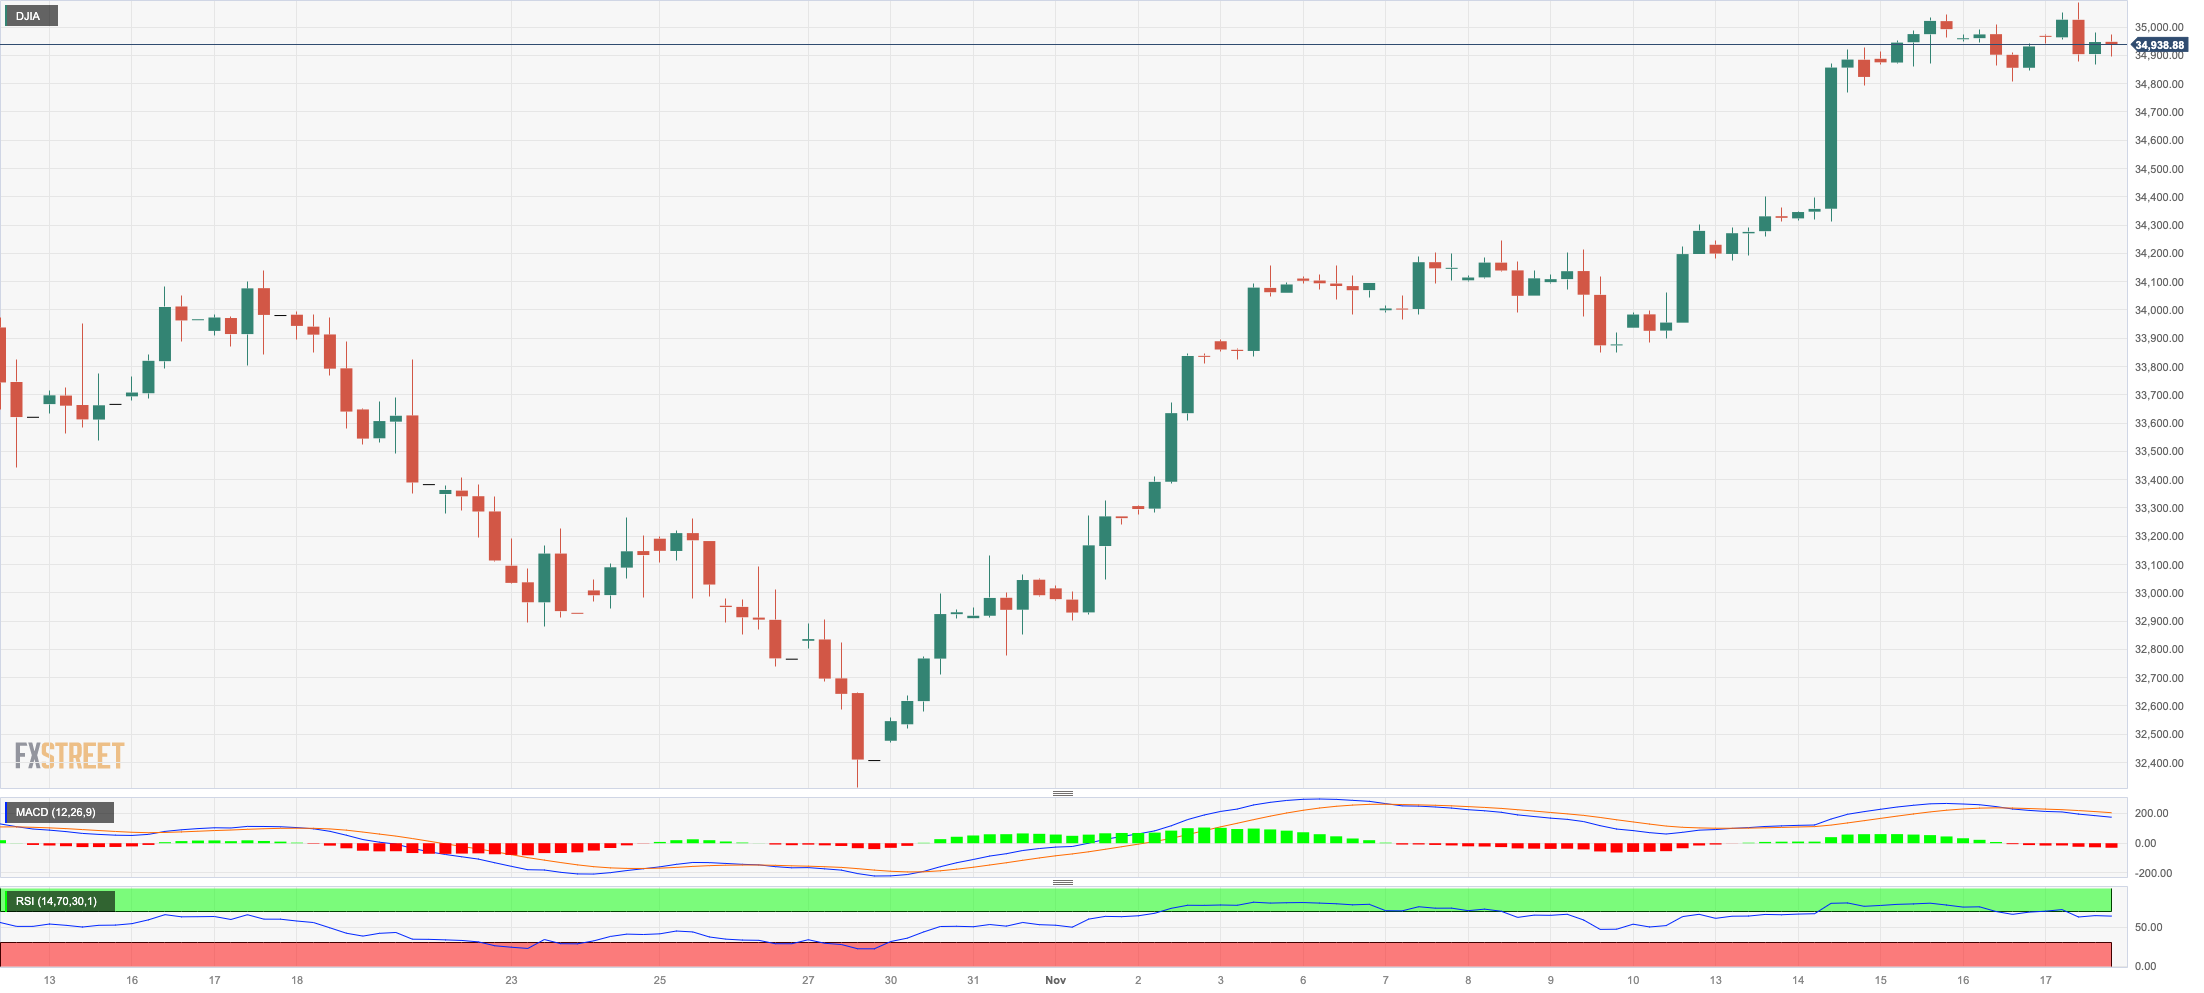
US stocks gauged by the Dow Jones closed Friday’s session with a marginal advance, managing to extend the positive streak for the third week in a row.
In the meantime, investors continued to assess the increasing likelihood that the Federal Reserve could start cutting its interest rates at some point in the spring of 2024, which remained a source of increasing appetite for the risk-associated universe.
All in all, the Dow Jones gained 0.01% to 34947, the S&P500 advanced 0.13% to 4514, and the tech-heavy Nasdaq Composite rose 0.08% to 14125.
Given the recent market trend, the Dow Jones should now aim for the November top of 35051 (November 15), followed by the weekly top of 35070 (August 31). The surpass of this level could prompt the index to confront the 2023 peak of 35679 (August 1) before the all-time high of 36952 (January 5, 2022). Having said that, the important 200-day SMA is expected to give early support at 33835, ahead of the October low of 32327 (October 27). The low for 2023 is 31429 (March 15), and the low for 2022 is 28660 (October 13). The daily RSI looked stable above 68.
Top Performers: Walgreen Boots, American Express, Caterpillar
Worst Performers: Microsoft, Nike, Amgen
Resistance levels: 35051 35070 35578 (4H chart)
Support levels: 34320 33859 33647 (4H chart)
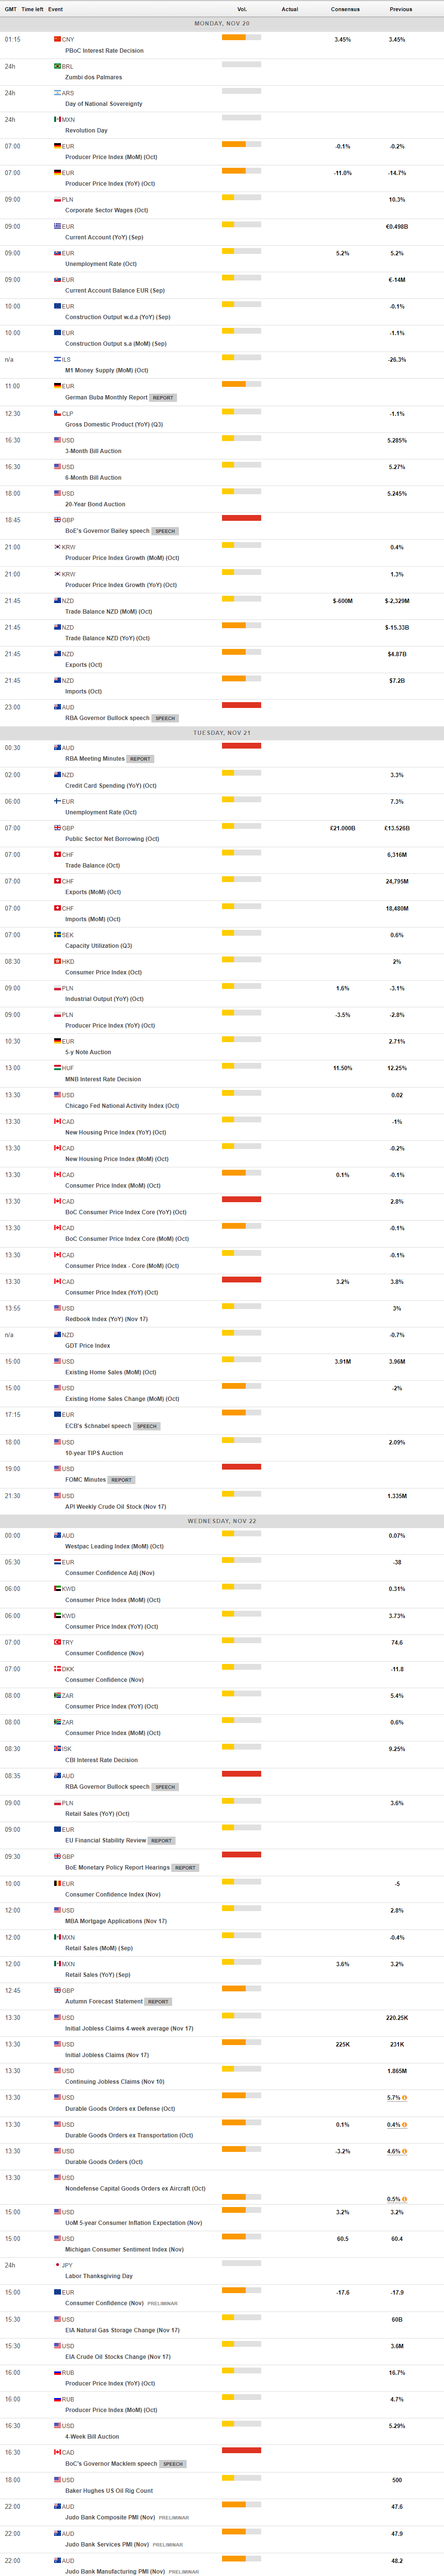
MACROECONOMIC EVENTS
All Information & Updates provided by:

All information relating to the financial markets available on this page has been prepared and issued by FXStreet (Forexstreet SL, Spain, Reg: B62498233) on the basis of publicly available information and all information believed to be reliable and does not conflict with Kuwaiti local laws, and all necessary care has been taken to before the company to ensure that the facts mentioned are correct from the source.
NCM Investment nor any of its directors or employees shall in any way be held responsible for the contents of this news, and the information contained on this page is intended only to provide clients with publicly available information and should not be construed as investment advice, report or analysis and/or constitute an offer or invitation to buy or sell financial instruments of any kind.
RISK WARNING: Forex and CFDs are highly risky leveraged products, as losses can exceed deposits. Please ensure you understand all the risks and take independent advice if necessary. NCM will segregate the clients based on the criteria of the regulator and its bylaws. NCM does not provide any advisory service; the material published does not constitute advice or a recommendation for a transaction in any financial instrument. NCM accepts no responsibility for any use of the content presented and any consequences of that use. Anyone acting on the information provided does so at their own risk.