
- Contact Us:
-

-

-

-


Daily Market Updates
22 Nov 2023
USDJPY
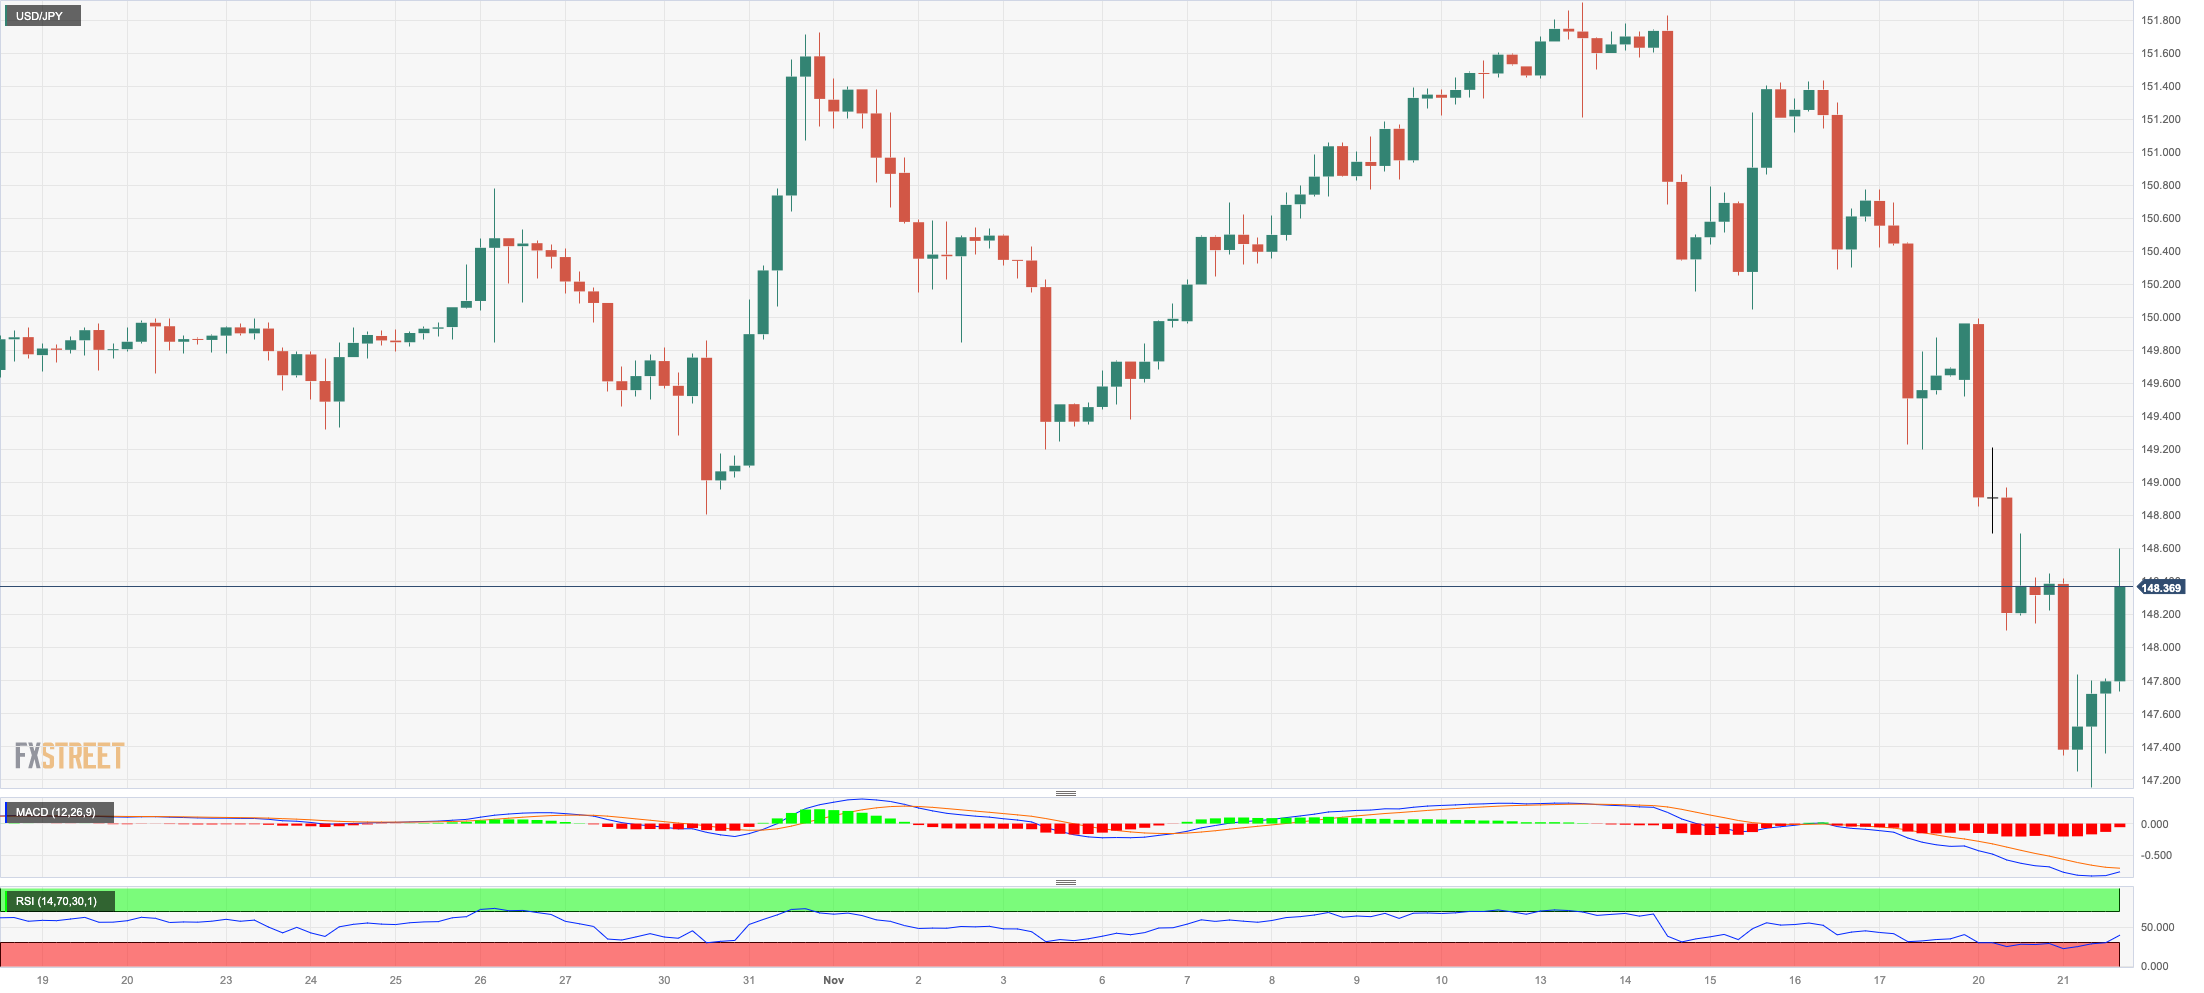
Further strength in the Japanese yen initially dragged USD/JPY to new two-month lows near the 147.00 yardstick before rebounding to the area north of the 148.00 mark late on Tuesday.
Therefore, the pair set aside three consecutive session of losses on the back of the late rebound in the greenback amidst rising US yields in the belly and the long end of the curve.
In Japan, JGB 10-year yields dropped further and revisited the 0.70% region for the first time since mid-September.
The Japanese calendar was empty on Tuesday.
If USD/JPY falls further, it may reach the provisional 100-day SMA at 146.55 before reaching the weekly low of 145.89 (September 11) and the September low of 144.43 (September 1). There are no substantial support levels beyond that until the August low of 141.50 (August 7), which appears underpinned by the key 200-day SMA, and the July low of 137.23 (July 14). If the pair breaks over the 2023 high of 151.90 (November 13), it might test the 2022 top of 151.94 (October 21), followed by the round milestone of 152.00. The RSI dropped substantially to the 41 region.
Resistance levels: 149.96 151.42 151.90 (4H chart)
Support levels: 147.15 145.89 144.43 (4H chart)
GBPUSD
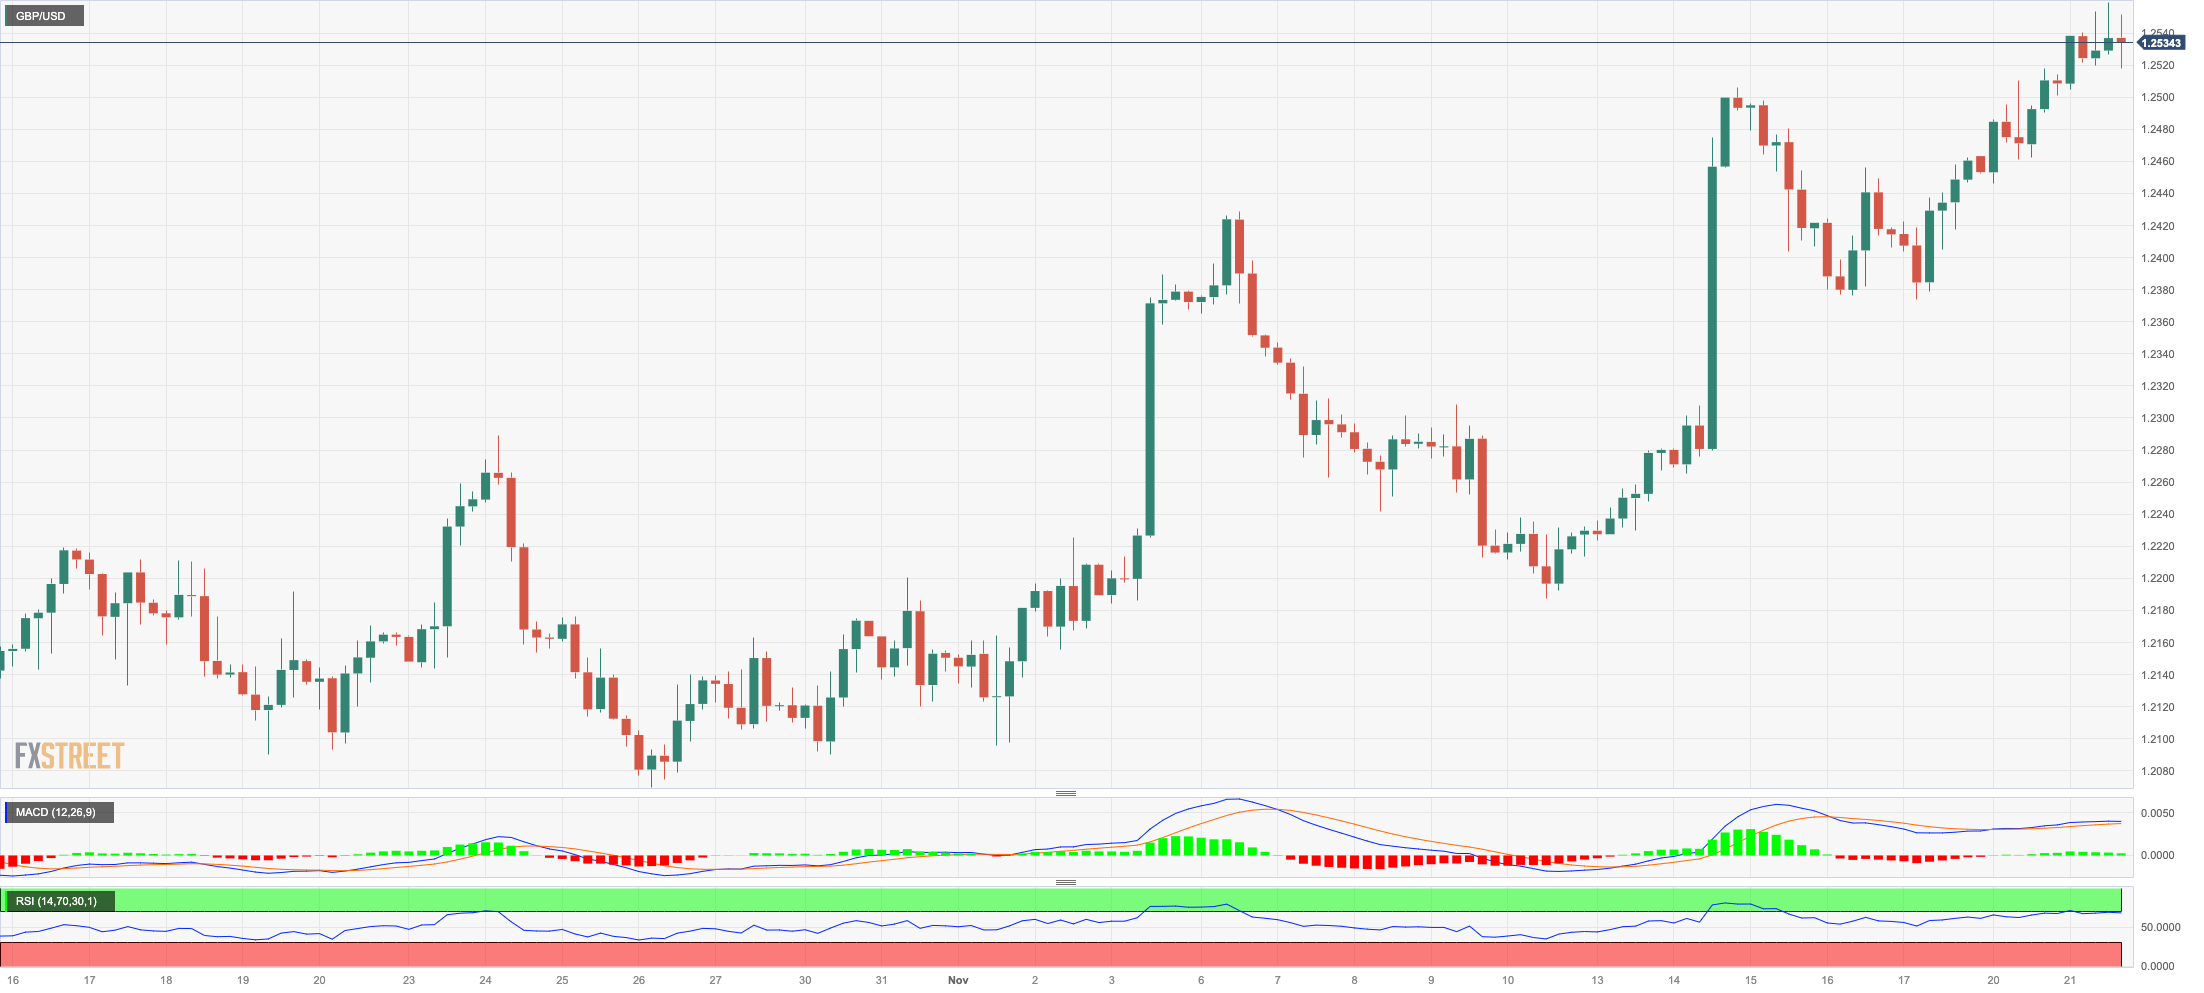
GBP/USD advanced for the third session in a row on Tuesday, managing to reach levels last seen in early September around the 1.2560 zone.
The move higher in Cable came pari passu with a gradual recovery in the greenback after the USD Index (DXY) bottomed out in multi-month lows near the 103.00 region.
Some support for the British pound also came from comments by the BoE’s Governor A. Bailey after he warned of inflation persistence, requiring interest rate rise due to high service inflation, elevated wage growth, and potential second-round effects from higher food and energy prices.
Across the Channel, Public Sector Net Borrowing contracted £13.97B in October, in what was the sole release on Tuesday.
Immediately to the upside for GBP/USD aligns the November high of 1.2559 (November 21), followed by weekly tops of 1.2746 (August 30), 1.2818 (August 10), and 1.2995 (July 27), all of which are ahead of the key 1.3000 threshold. Instead, the intermediate 55-day SMA of 1.2277 is ahead of the weekly low of 1.2187 (November 10). Below are the weekly lows of 1.2069 (October 26) and 1.2037 (October 3). If the latter is breached, the crucial 1.2000 level may be challenged before the 2023 low of 1.1802 (March 8) is reached. The RSI for the day improved to the boundaries of 66.
Resistance levels: 1.2559 1.2642 1.2746 (4H chart)
Support levels: 1.2373 1.2247 1.2187 (4H chart)
AUDUSD
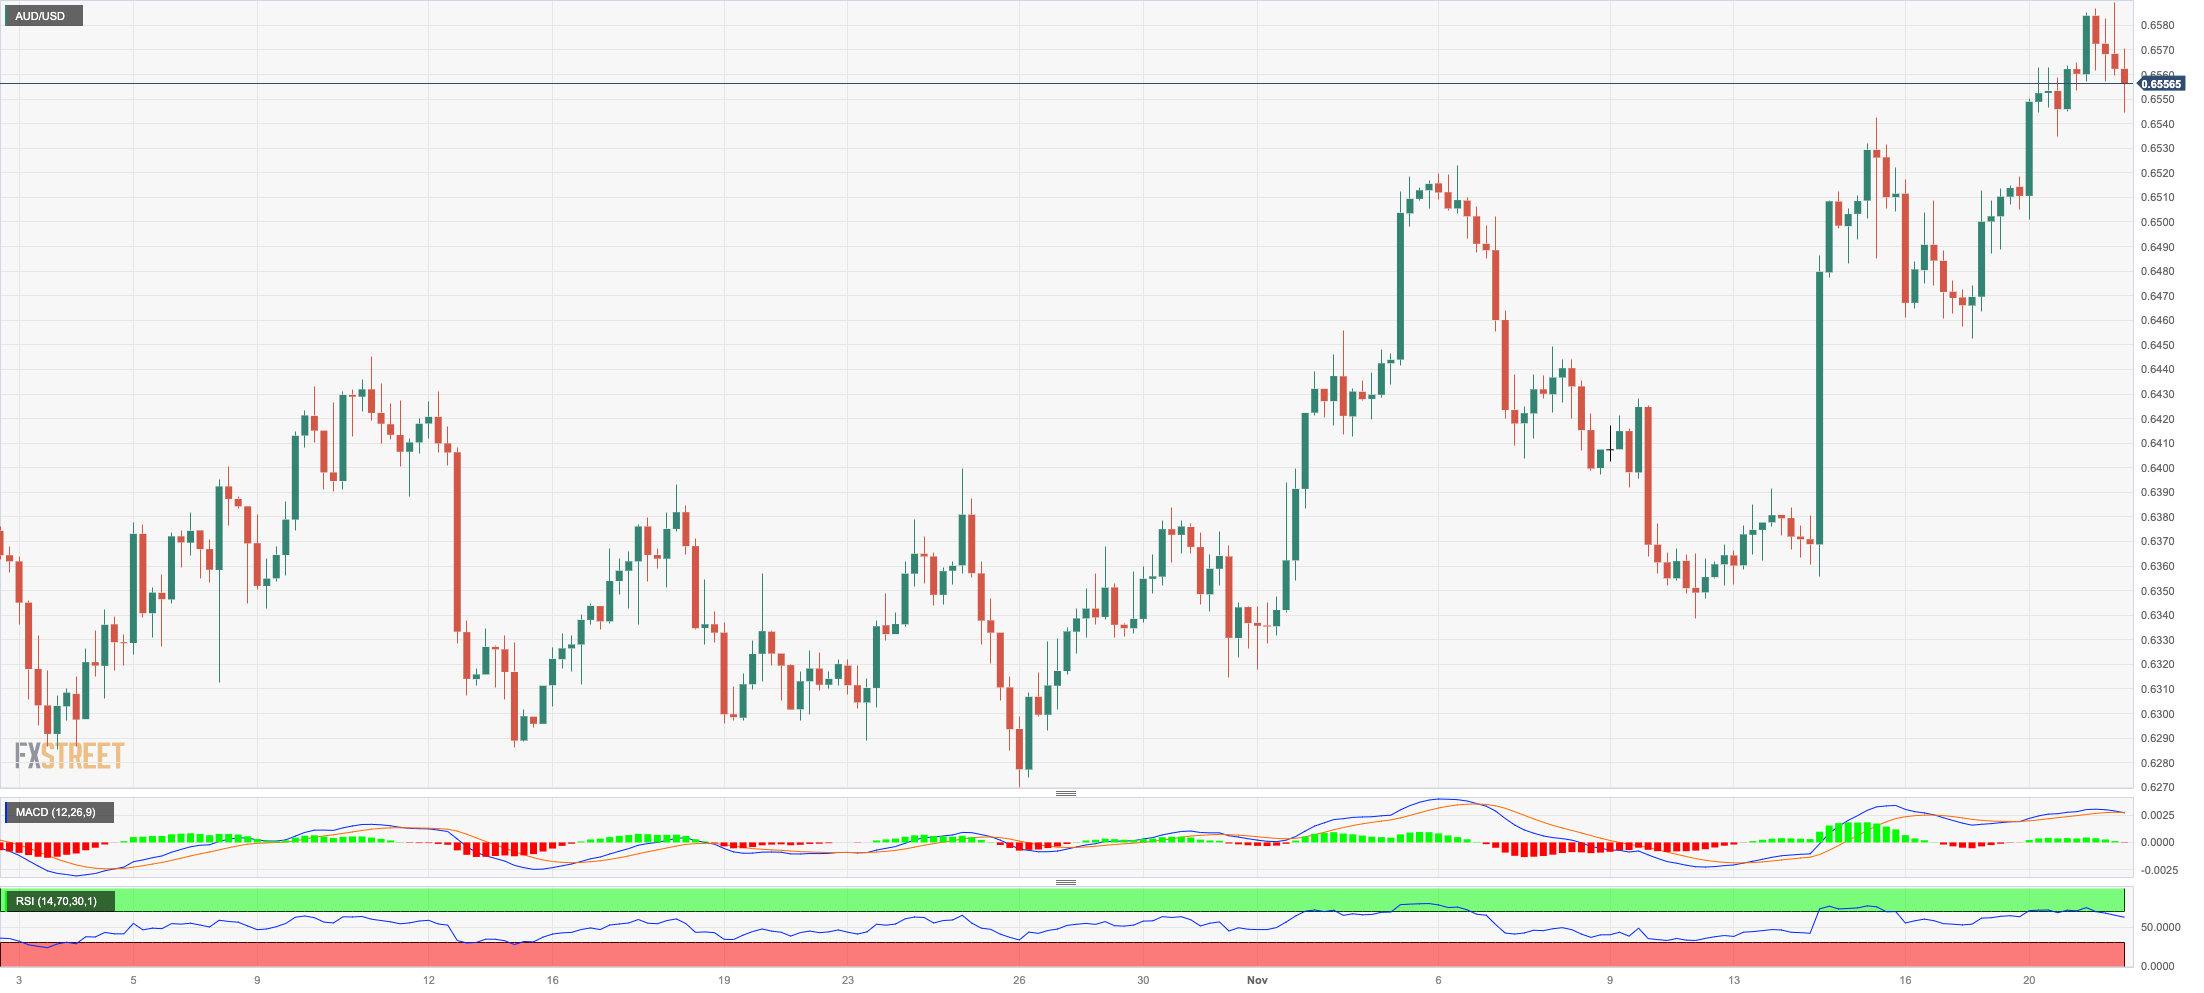
AUD/USD eroded the early bull run to levels just shy of 0.6600 the figure on Tuesday, an area coincident with the critical 200-day SMA.
The bullish move, however, fizzled out towards the end of the NA session, leaving spot with marginal losses around 0.6550 amidst the late recovery in the dollar and the mixed performance of the commodity complex.
In the RBA Minutes, the central bank warned that a modest increase in inflation expectations could make it more challenging and costly to return inflation to target within a reasonable timeframe and that it is expected to take longer.
In addition, Governor Bullock emphasized that inflation will be a significant challenge in the next one to two years, driven by supply-driven factors like petrol prices and rents. The central bank is working to manage this demand component. However, if inflation expectations continue to rise, it could lead to a problem if inflation expectations adjust.
If AUD/USD breaks above the 200-day SMA at 0.6589, it could then challenge the weekly high of 0.6616 (August 10) prior to the July high of 0.6894 (July 14). Further up comes the June top of 0.6899 (June 16), both of which are over the crucial 0.7000 threshold. In contrast, the 55-day SMA at 0.6400 provides temporary support ahead of the 2023 bottom of 0.6270 (October 26). If this region fails, the pair is expected to hit 0.6200, which is near to the 2022 low of 0.6169 (October 13). The daily RSI settled around the 63 zone.
Resistance levels: 0.6589 0.6616 0.6739 (4H chart)
Support levels: 0.6452 0.6395 0.6338 (4H chart)
GOLD
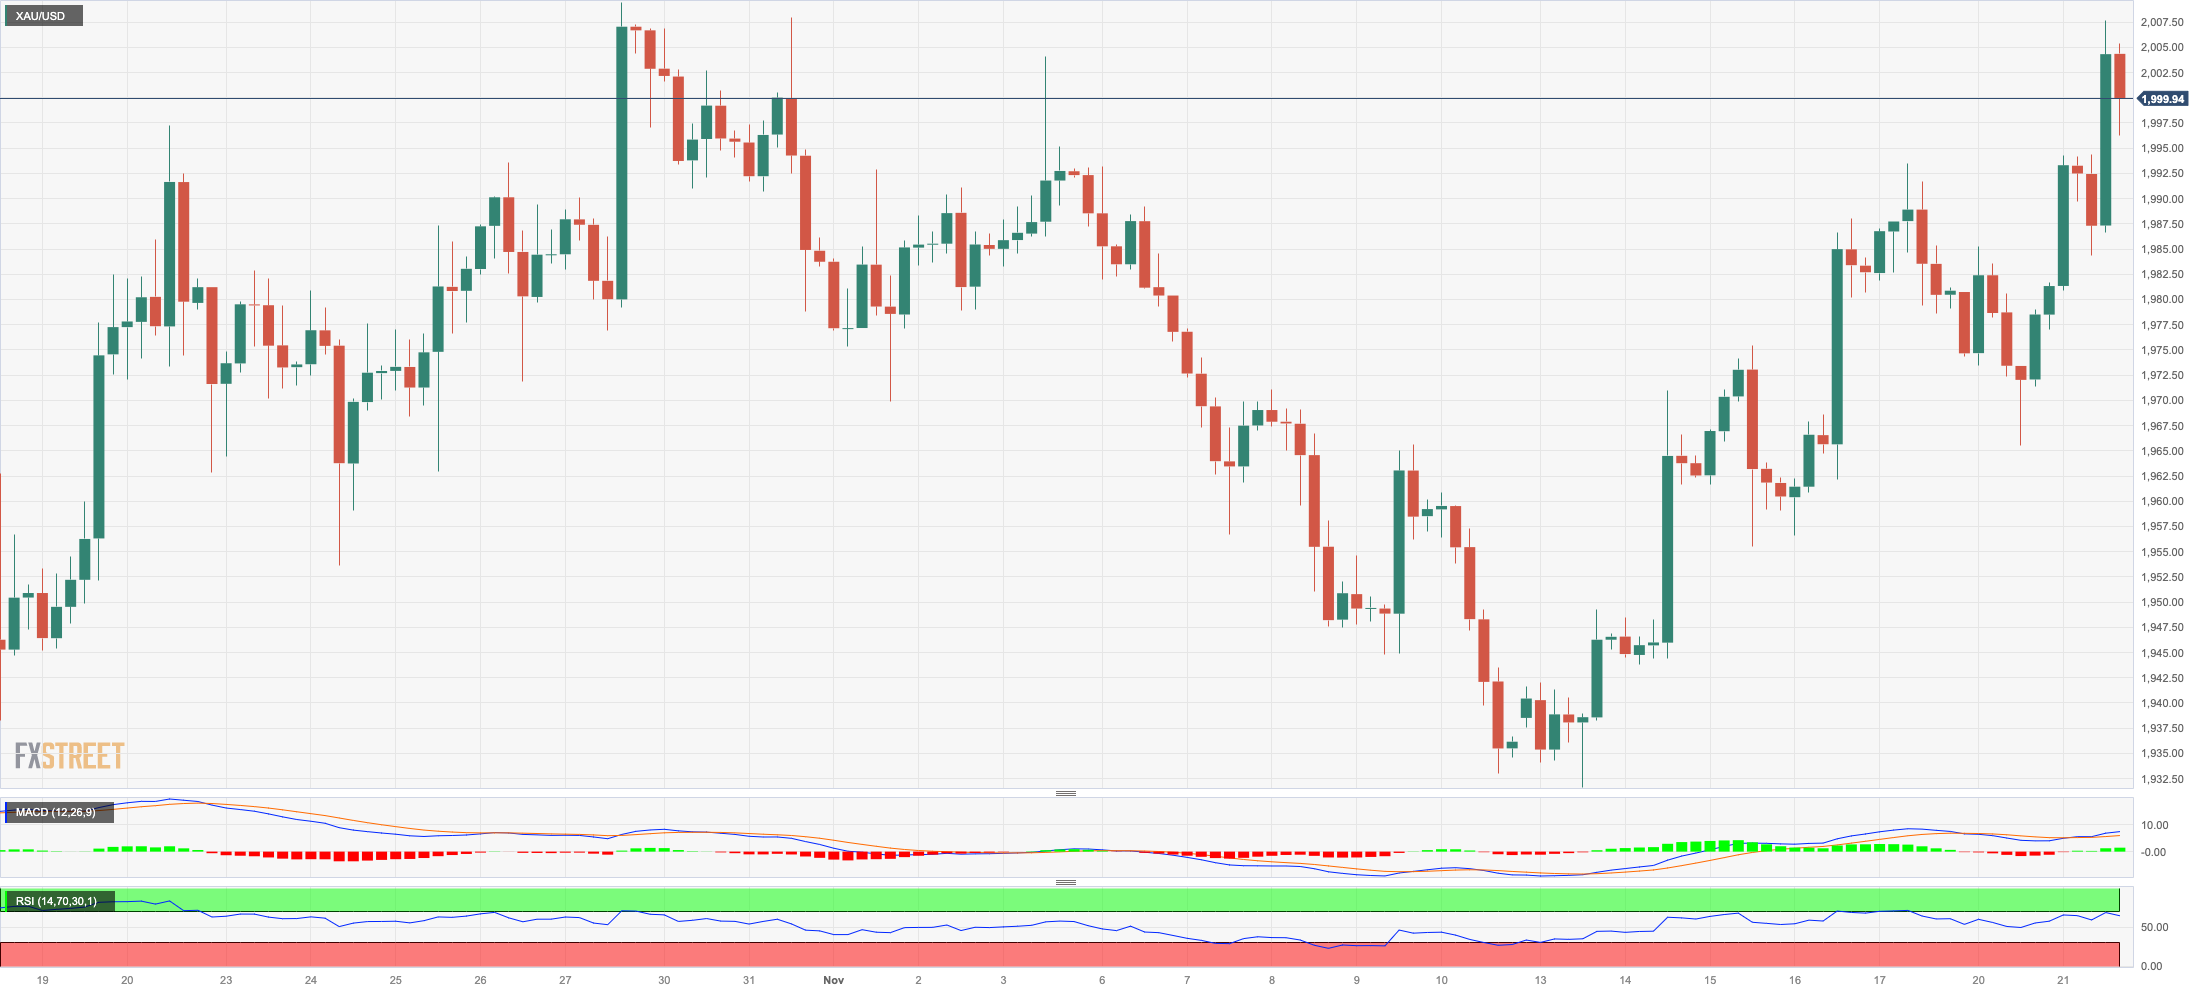
Gold prices reversed two consecutive daily pullbacks and advanced markedly past the key $2000 mark on Tuesday.
In the meantime, the yellow metal ignored the bounce in the greenback seen in the latter part of the NA session coupled with mixed US yields, all amidst persistent market chatter regarding potential easing by the Federal Reserve as soon as March 2024.
Gold traded at shouting distance from the October peak of $2009 (October 27). The surpass of this level might lead to a test of the 2023 high of $2067 (May 4) before the 2022 top of $2070 (March 8) and the all-time peak of $2075 (August 7, 2020). Just the opposite, if sellers regain the initiative, the yellow metal may aim for the November low of $1931 (November 13), which appears reinforced by the preliminary 55-day SMA ($1929). The October low of $1810 (October 6), the 2023 bottom of $1804 (February 28), and the main conflict region of $1800 are all aligned down from here.
Resistance levels: $2009 $2022 $2048 (4H chart)
Support levels: $1965 $1947 $1931 (4H chart)
CRUDE WTI
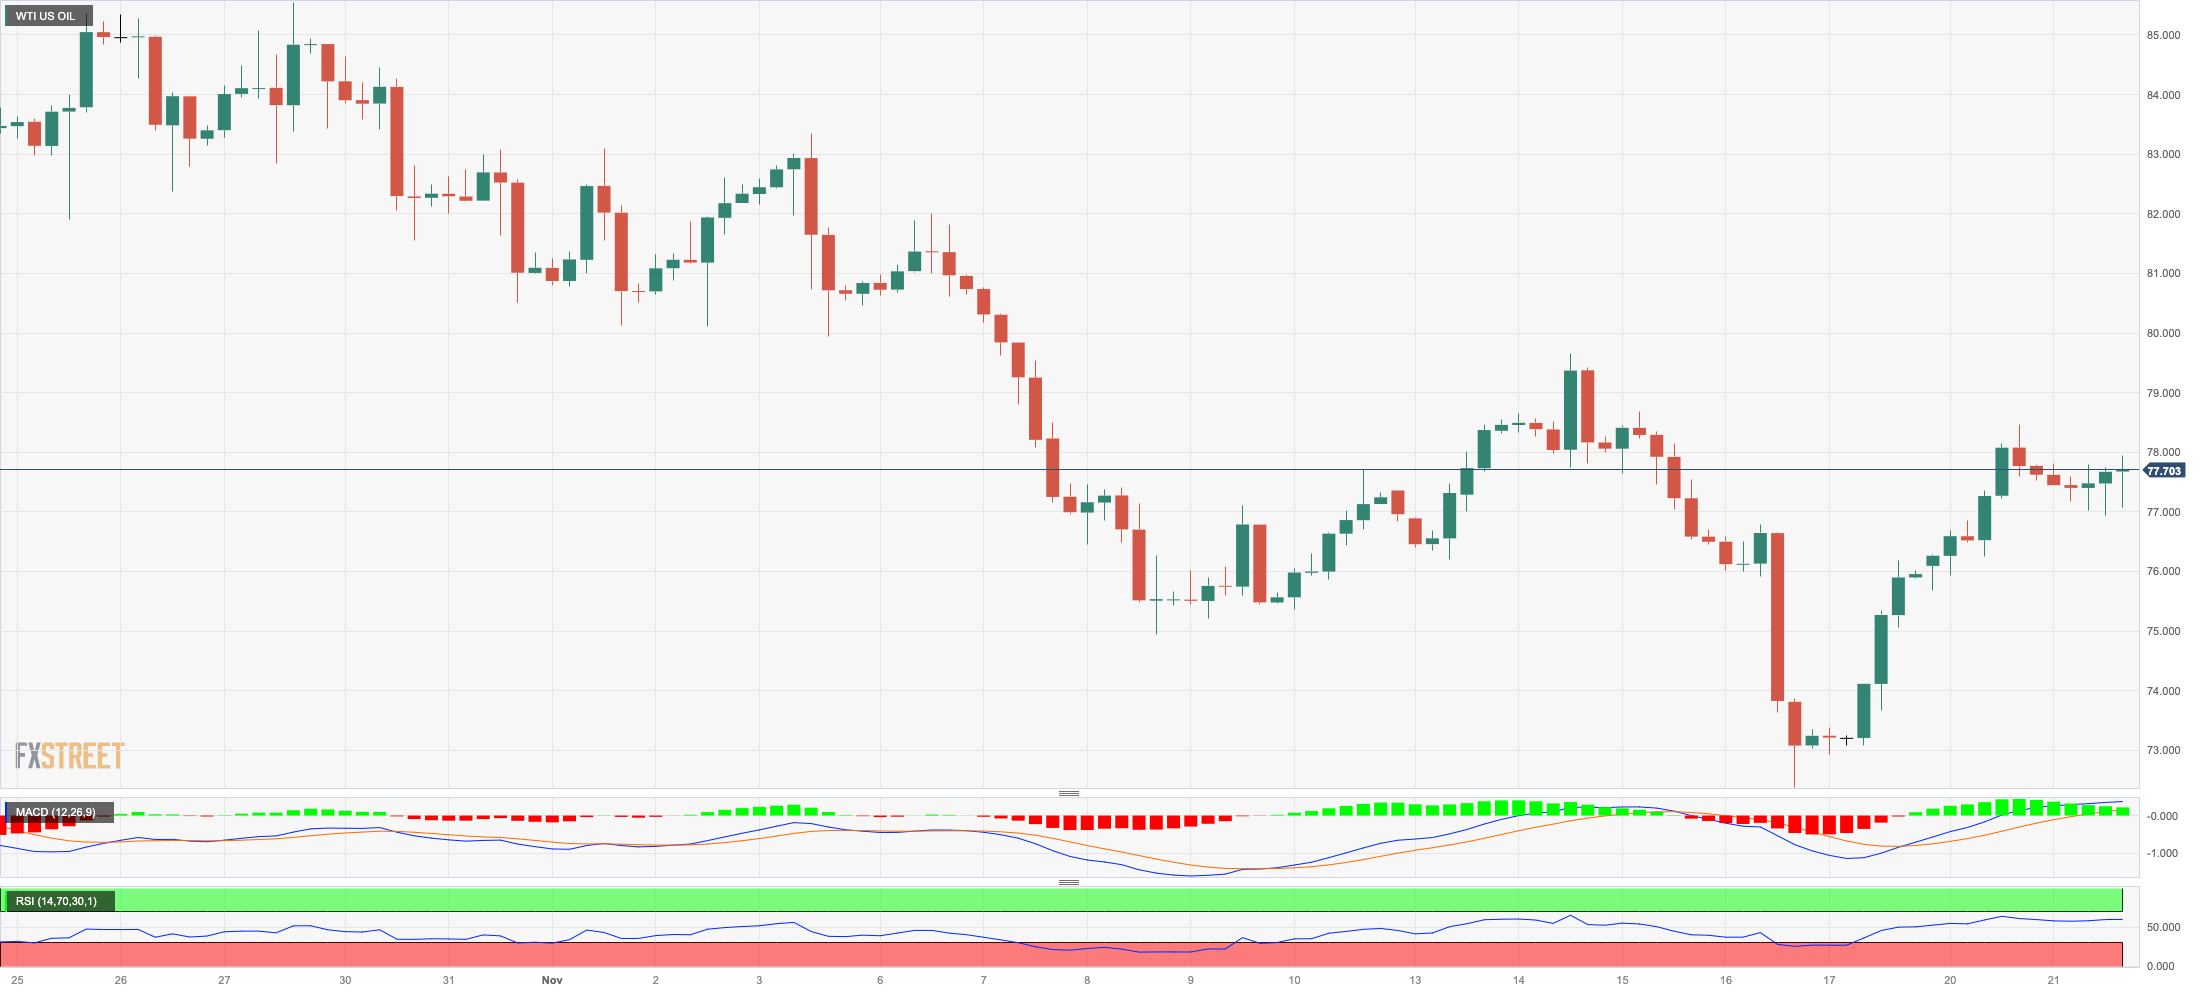
WTI prices traded within a very tight range against the backdrop of rising prudence among traders ahead of the key OPEC+ meeting on November 26.
On this occasion, the commodity has been gaining traction as a result of expected oil output cuts by the cartel before the end of the year.
Also adding to the inconclusive price action emerged the late bounce in the greenback as well as shrinking volatility ahead of the Thanksgiving Day holiday on Thursday and usual reduced trading conditions on Friday.
If the rebound gains momentum, WTI may hit the November high of $80.15 (November 3). The provisional 55-day SMA of $84.83 is followed by the weekly top of $89.83 (October 18), the 2023 peak of $94.99 (September 28), and a weekly high of $97.65 (August 30, 2022), all before the psychological $100.00 mark. On the contrary, if WTI falls below the November low of $72.22 (November 16), it may test the critical $70.00 per barrel level before the 2023 low of $63.61 (May 4) and the $60.00 threshold.
Resistance levels: $78.42 $79.72 $82.35 (4H chart)
Support levels: $72.13 $70.18 $67.01 (4H chart)
GER40
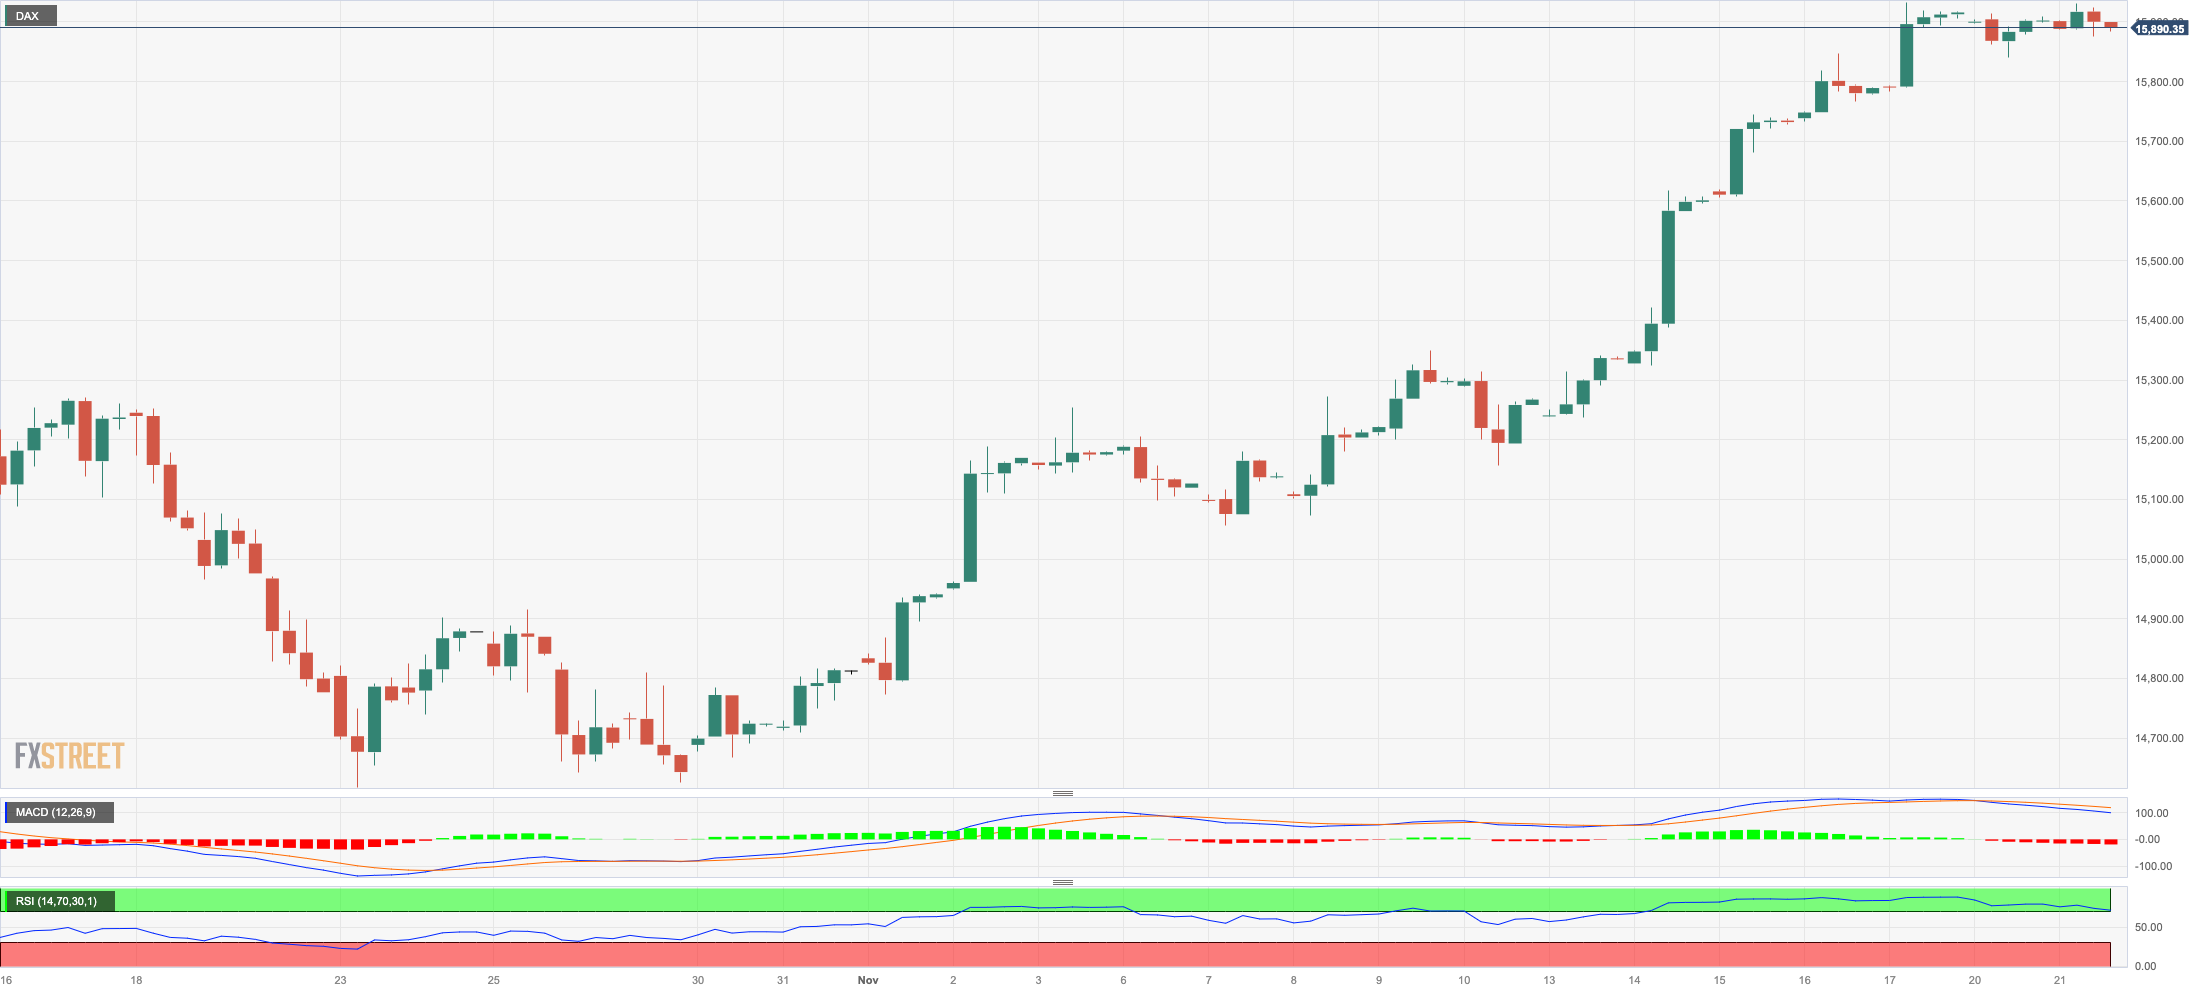
German equities tracked by the DAX40 closed around Monday’s levels near the 15900 region on Tuesday.
The irresolute session in the index came on the back of rising cautiousness among market participants ahead of the release of the FOMC Minutes, while speculation that the ECB might start reducing its interest rates in the first half of 2024 remained well in place.
In the German money market, the 10-year bund yields resumed the decline and broke below the 2.60% level.
The next objective for the DAX40 is the November high of 15952 (November 17), which is slightly ahead of the September top of 15989 (September 15). The weekly peaks of 16042 (August 31) and 16060 (August 10) are aligned north of here, ahead of the all-time high of 16528 (July 31). On the other hand, the index may be dragged to the 200-day SMA at 15656 before the intermediate 55-day SMA at 15342. If this level is broken, we might witness a retest of the October low of 14630 (October 23) before the March low of 14458 (March 20). The day-to-day RSI remained in the overbought zone above 71.
Best Performers: Rheinmetall AG, Symrise AG, Hannover Rueck SE
Worst Performers: Siemens Energy AG, Vonovia, BMS ST
Resistance levels: 15952 15989 16042 (4H chart)
Support levels: 15419 15171 15068 (4H chart)
NASDAQ
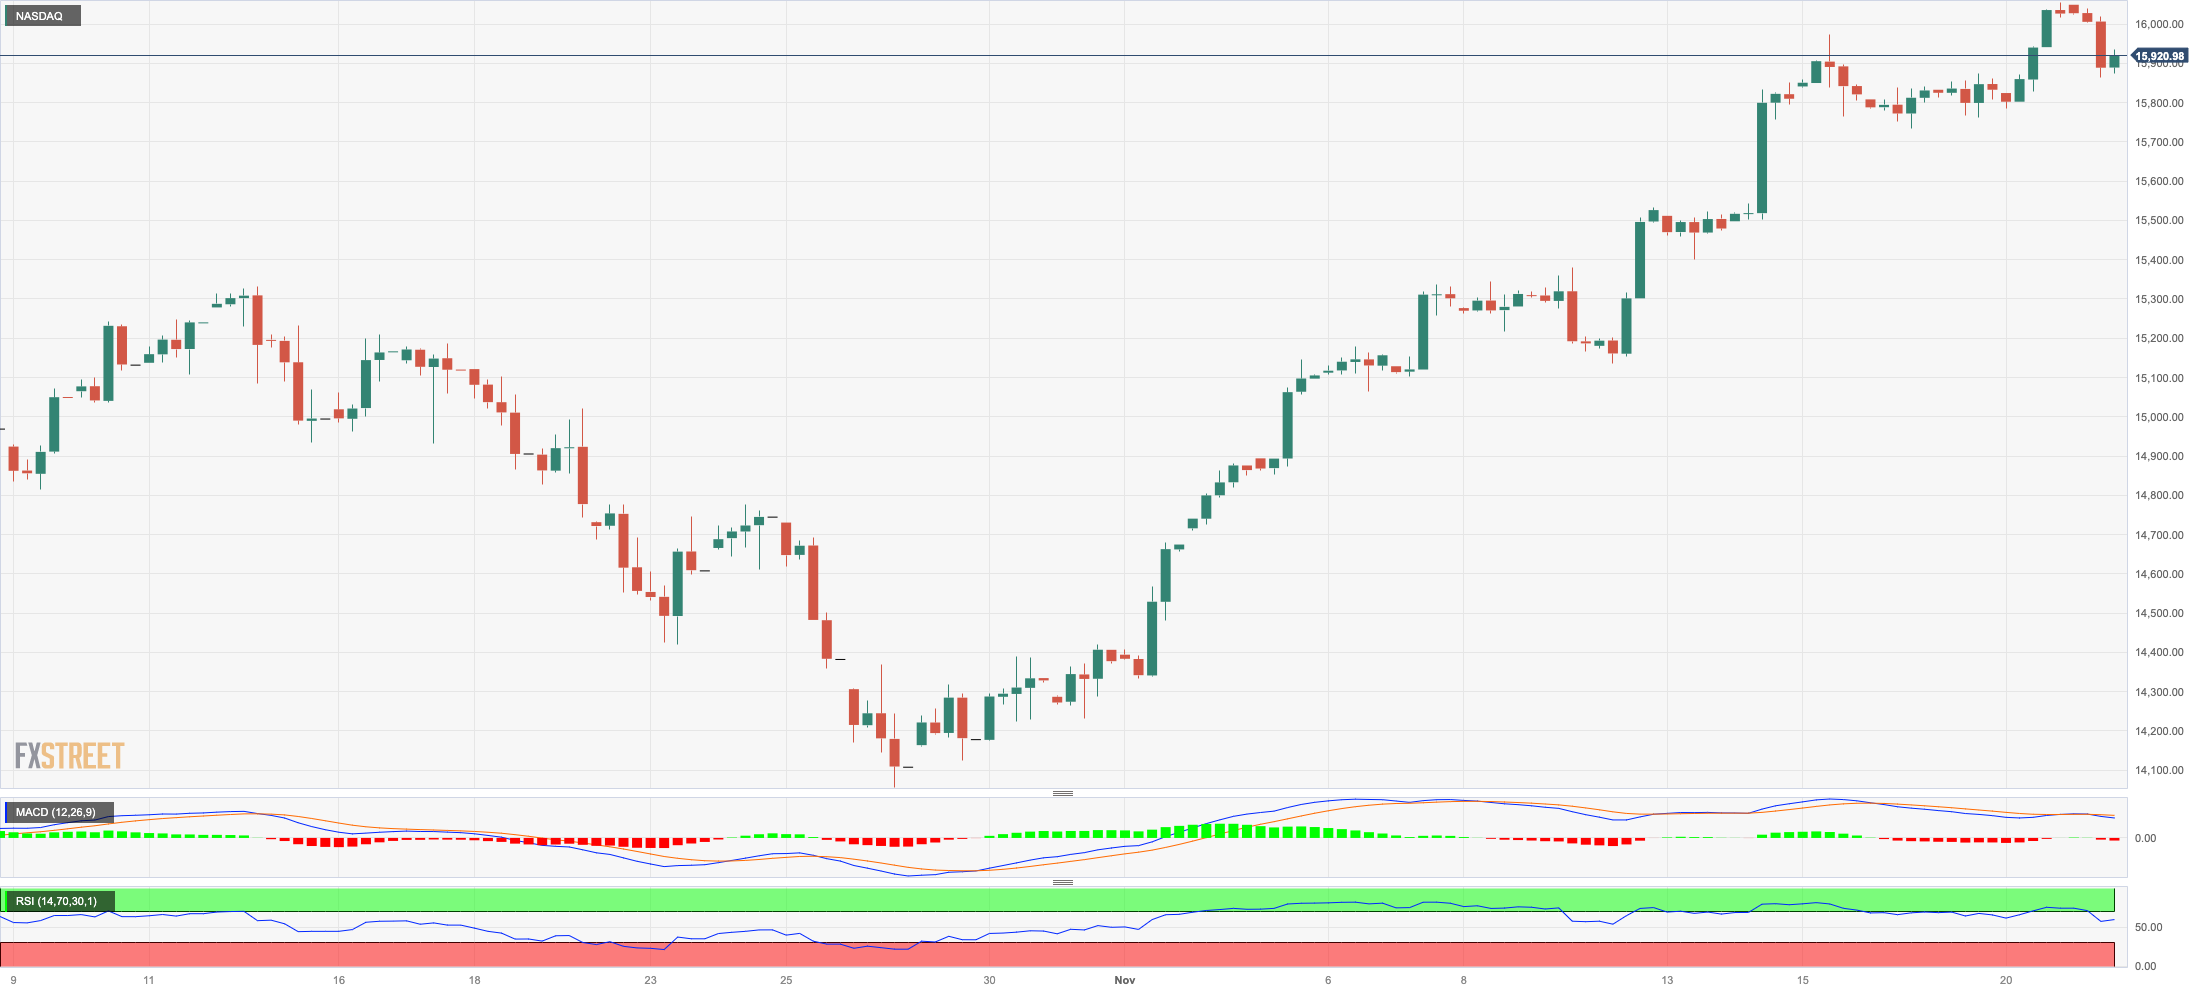
Tuesday’s knee-jerk saw the five-session positive streak in the tech reference Nasdaq 100 come to an end.
The late rebound in the greenback prompted a corrective move in the tech sector along with the small improvement in US yields on the short end and the belly of the curve.
Furthermore, prudence prevailed among traders prior to the publication of the earnings report from giant chipmaker NVIDIA following the closing bell on Wall Street.
Additional Nasdaq gains might take the index to the 2023 peak of 16056 (November 20) before the December 2021 high of 16607 (December 28) and the all-time top of 16764 (November 22 2021). Immediate support looks to be around the preliminary 55-day SMA of 15044, which is put ahead of the critical 200-day SMA of 14215 and the October low of 14058 (October 26). Further losses might put the April bottom of 12724 (April 25) in jeopardy, putting it ahead of the March low of 11695 (March 13) and the 2023 low of 10696 (January 3). The RSI retreated to the 67 zone.
Top Gainers: Tesla, Palo Alto Networks, eBay
Top Losers: Sirius XM, Lucid Group, Globalfoundries
Resistance levels: 16056 16607 16764 (4H chart)
Support levels: 15156 14983 14058 (4H chart)
DOW JONES
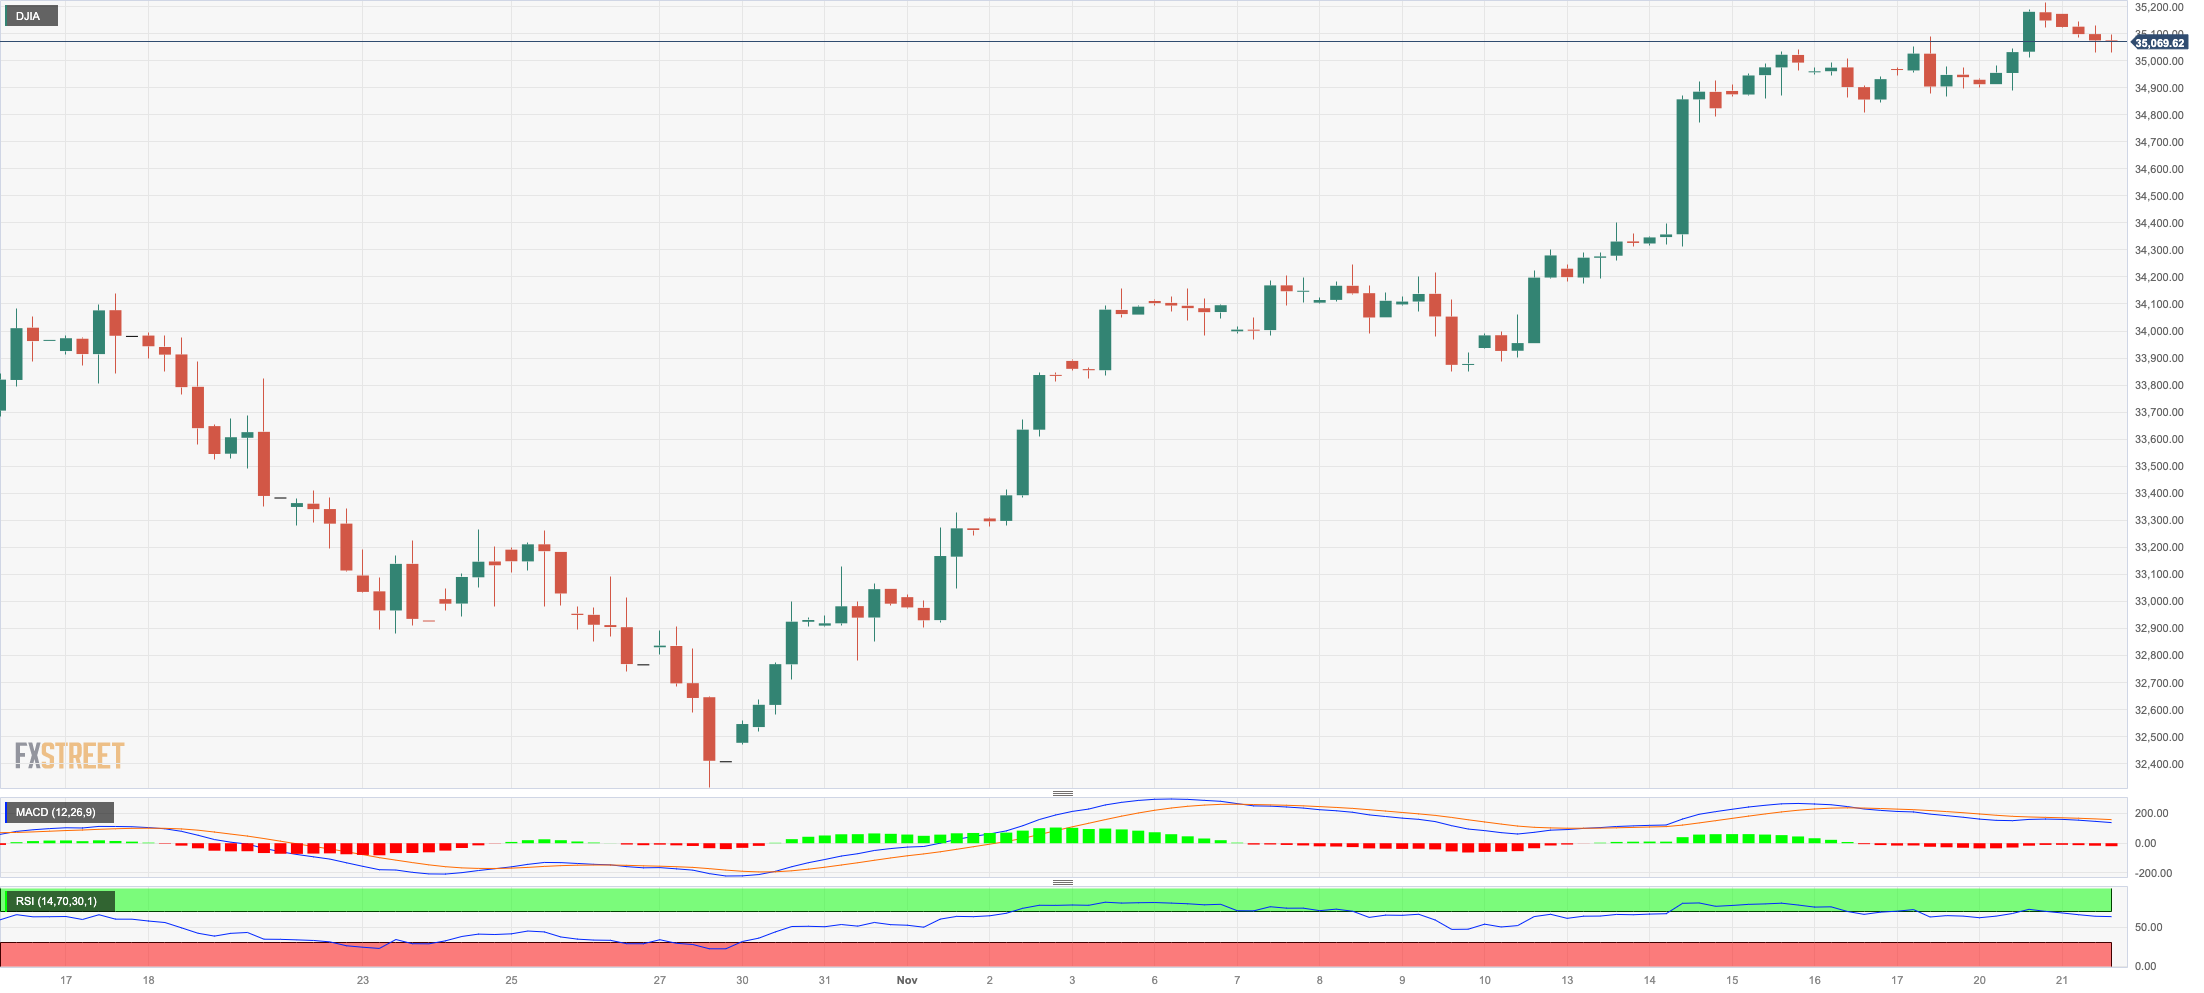
Stocks gauged by the Dow Jones came under some mild downside pressure on Tuesday, reversing two daily gains in a row, including Monday’s three-month tops past 35200.
The index gave away part of the recent advance amidst increasing cautiousness among traders as well as some profit-taking sentiment ahead of the Thanksgiving Day holiday on Thursday.
Meanwhile, investors’ perception of the growing probability of the Fed initiating interest rate cuts in the spring of 2024 remained in place and is expected to keep supporting the current upside bias in the index.
All in all, the Dow Jones dropped 0.19% to 35085, the S&P500 retreated 0.20% to 4538, and the tech-heavy Nasdaq Composite deflated 0.84% to 14165.
Given the present market trend, the Dow Jones should now aim for the 2023 high of 35679 (August 1) before hitting the all-time top of 36952 (January 5, 2022). The 200-day SMA, on the downside, is expected to give early support around 33847, ahead of the October low of 32327 (October 27). The loss of the latter may pave the way for a trip to the 2023 bottom of 31429 (March 15), followed by the 2022 low of 28660 (October 13). The daily RSI grinded a tad lower to the sub-69 area.
Top Performers: Travelers, Verizon, UnitedHealth
Worst Performers: Intel, Microsoft, Goldman Sachs
Resistance levels: 35227 35578 35679 (4H chart)
Support levels: 34336 33859 33647 (4H chart)
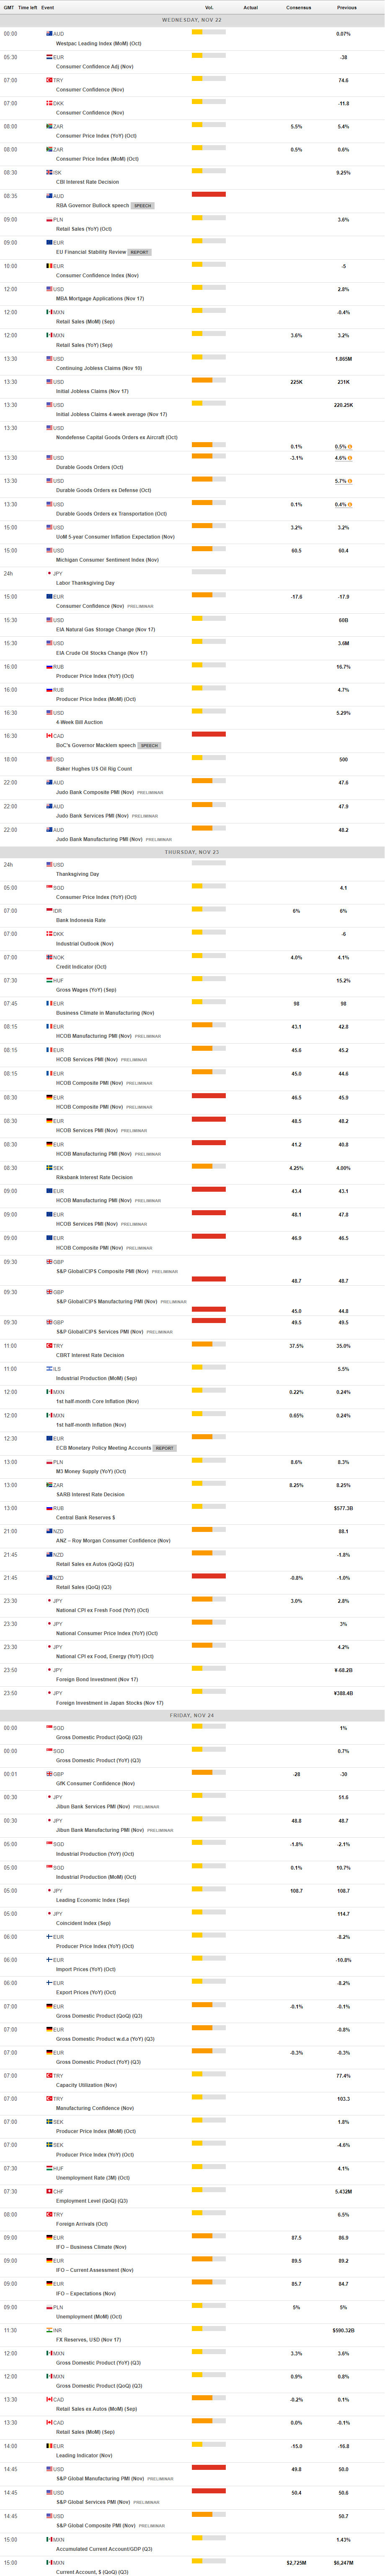
MACROECONOMIC EVENTS
All Information & Updates provided by:

All information relating to the financial markets available on this page has been prepared and issued by FXStreet (Forexstreet SL, Spain, Reg: B62498233) on the basis of publicly available information and all information believed to be reliable and does not conflict with Kuwaiti local laws, and all necessary care has been taken to before the company to ensure that the facts mentioned are correct from the source.
NCM Investment nor any of its directors or employees shall in any way be held responsible for the contents of this news, and the information contained on this page is intended only to provide clients with publicly available information and should not be construed as investment advice, report or analysis and/or constitute an offer or invitation to buy or sell financial instruments of any kind.
RISK WARNING: Forex and CFDs are highly risky leveraged products, as losses can exceed deposits. Please ensure you understand all the risks and take independent advice if necessary. NCM will segregate the clients based on the criteria of the regulator and its bylaws. NCM does not provide any advisory service; the material published does not constitute advice or a recommendation for a transaction in any financial instrument. NCM accepts no responsibility for any use of the content presented and any consequences of that use. Anyone acting on the information provided does so at their own risk.