
- Contact Us:
-

-

-

-


Daily Market Updates
23 Nov 2023
USDJPY
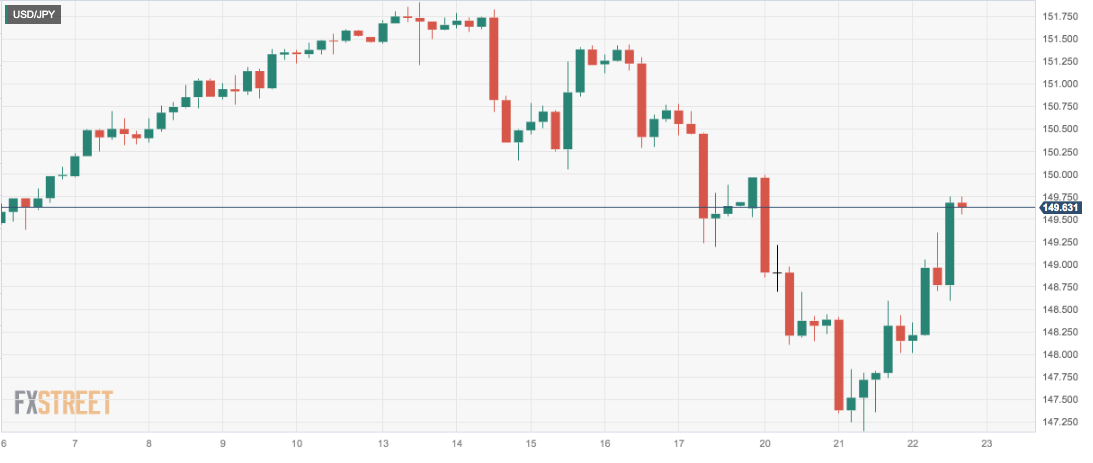
Following Tuesday’s drop to the vicinity of the 147.00 zone, USD/JPY managed to regain the smile and charted a decent comeback midweek.
Indeed, the marked bounce in the pair was accompanied by the equally robust move higher in the greenback along with the firm performance of US yields across different timeframes.
In Japan, the JGB 10-year yields also left behind part of the recent weakness and approached the 0.75% zone once again.
The Japanese docket was empty on Wednesday.
If USD/JPY breaches the November low of 147.15 (November 21), it could extend the decline to further the interim 100-day SMA at 146.60 ahead of the weekly low of 145.89 (September 11) and the September low of 144.43 (September 1). Below the latter, the next support of note comes at the August low of 141.50 (August 7), which remains propped up by the key 200-day SMA, ahead of the July low of 137.23 (July 14). On the upside, initial resistance emerges at the 2023 top of 151.90 (November 13), followed by the 2022 peak of 151.94 (October 21) and the round level of 152.00. The everyday RSI bounced past 48.
Resistance levels: 149.74 151.42 151.90 (4H chart)
Support levels: 147.15 145.89 144.43 (4H chart)
GBPUSD
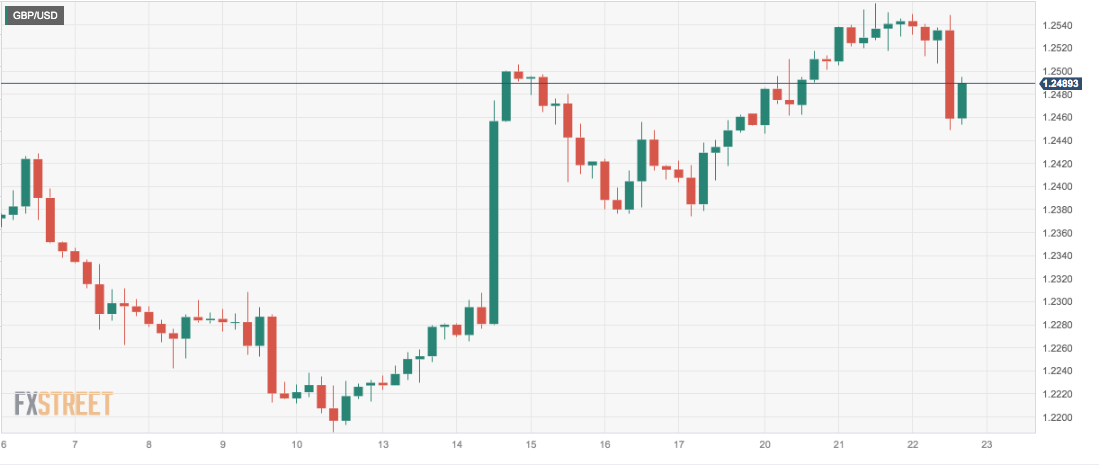
The continuation of the march north in the greenback put the British pound and the rest of its risk-associated peers under pressure and dragged GBP/USD to two-day lows in the mid-1.2400s on Wednesday.
The move, however, appears to have met initial contention around 1.2450, where the key 200-day SMA also sits.
In what was the only scheduled release in the UK, the Treasury published its Autumn Statement, where it is projected that the GDP will expand by 0.7% in 2024 and 0.6% in 2023. Then, as inflation declines and the impact of previous interest rate hikes lessens, growth is predicted to accelerate to 1.4% in 2025 and an average of 1.9% between 2026 and 2028.
Next on the upside for GBP/USD emerges the November top of 1.2559 (November 21), prior to weekly peaks of 1.2746 (August 30), 1.2818 (August 10), and 1.2995 (July 27), all preceding the psychological 1.3000 yardstick. On the other hand, the interim 55-day SMA of 1.2277 should provide initial support before the weekly low of 1.2187 (November 10). Down from here emerges the weekly lows of 1.2069 (October 26) and 1.2037 (October 3), which is closely followed by the crucial 1.2000 level and the 2023 low of 1.1802 (March 8). The daily deflated below 63.
Resistance levels: 1.2559 1.2642 1.2746 (4H chart)
Support levels: 1.2448 1.2373 1.2259 (4H chart)
AUDUSD
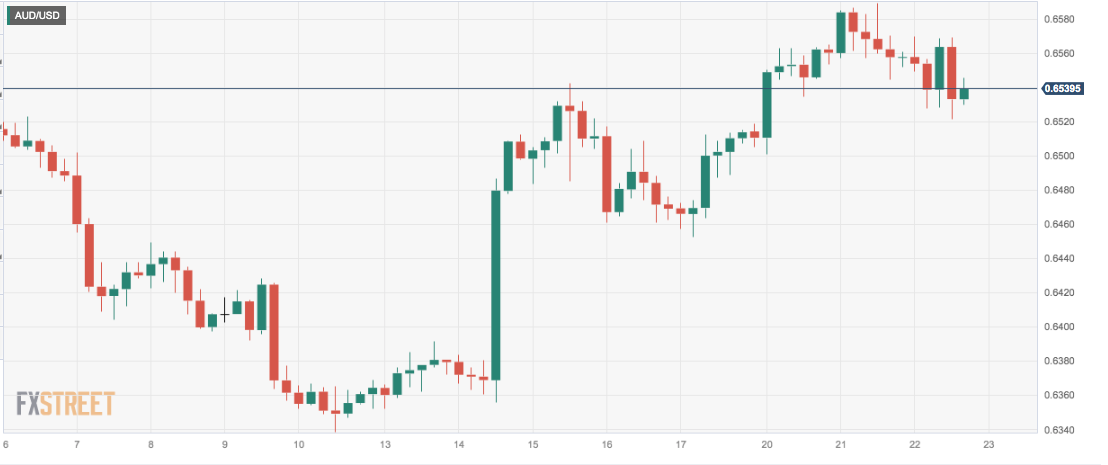
The selling bias continued to put the Aussie dollar under extra pressure on Wednesday, sending AUD/USD to fresh two-day lows in the 0.6520 region.
In fact, further recovery in the greenback weighed on the recent optimistic performance of the pair, while the broad-based bearish session of the commodity complex also added to AUD’s retracement.
In Oz, the Westpac Leading Index eased by -0.03% MoM for the month of October.
If bulls regain the upper hand, AUD/USD should face the next up-barrier at the November top of 0.6589 (November 2), an area bolstered by the 200-day SMA. Up from here aligns the weekly top of 0.6616 (August 10) ahead of the July peak of 0.6894 (July 14) and the June top of 0.6899 (June 16), all followed by the key 0.7000 yardstick. On the opposite direction, the 55-day SMA at 0.6403 should offer transitory contention prior to the 2023 low of 0.6270 (October 26). The breakdown of the latter exposes the round level of 0.6200, before the 2022 low of 0.6169 (October 13). The daily RSI grinded lower to the 61 region.
Resistance levels: 0.6589 0.6616 0.6739 (4H chart)
Support levels: 0.6521 0.6452 0.6401 (4H chart)
GOLD
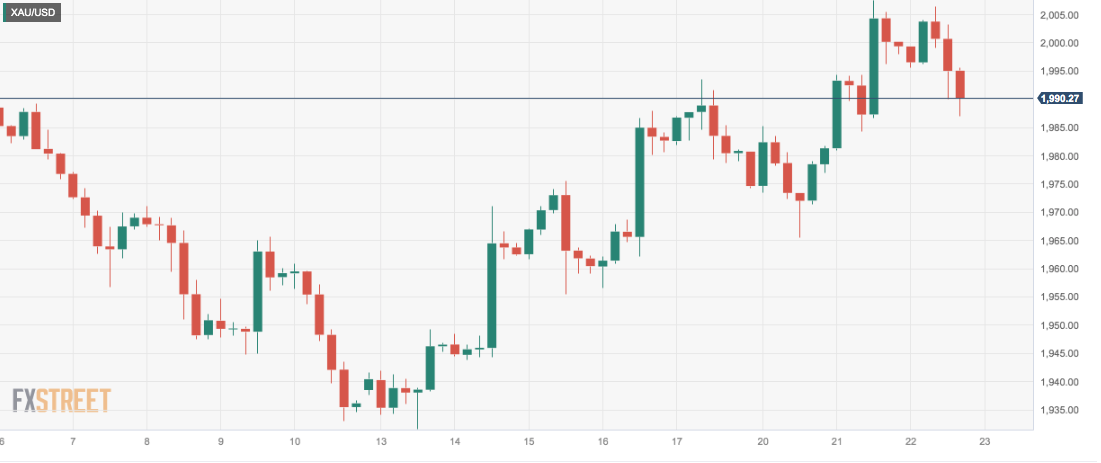
The precious metal could not sustain another bull run to the area beyond the critical $2000 mark per troy ounce and ended Wednesday session with modest losses around $1990.
The renewed weakness in the yellow metal came in response to the persistent rebound in the greenback, which pushed the USD Index (DXY) back to the 104.00 zone, while the move higher in US yields also contributed to the daily decline.
Gold continues to face immediate resistance at the October high of $2009 (October 27). The trespass of this region could pave the way for a move to the 2023 top of $2067 (May 4) ahead of the 2022 peak of $2070 (March 8) and the all-time high of $2075 (August 7, 2020). Having said that, bears could push gold to the November low of $1931 (November 13), which remains underpinned by the interim 55-day SMA. Extra losses could meet the October low of $1810 (October 6), seconded by the 2023 bottom of $1804 (February 28), and the key contention zone of $1800.
Resistance levels: $2009 $2022 $2048 (4H chart)
Support levels: $1965 $1953 $1931 (4H chart)
CRUDE WTI
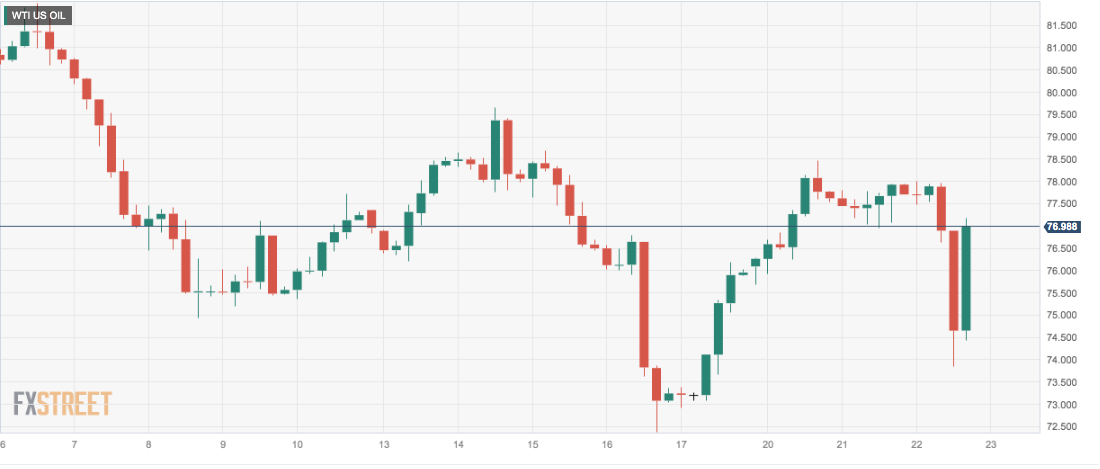
Prices of the barrel of WTI reversed three consecutive daily builds and briefly retreated to the sub-$74.00 region on Wednesday.
In fact, the combination of a larger-than-expected weekly build in US crude oil stockpiles, the renewed march north in the greenback and the ceasefire in the Israel-Hamas conflict all put the recent recovery in crude oil to the test.
Further downside pressure also kicked in after the OPEC+ decided to postpone its meeting originally due on November 26.
Back to the EIA, the agency reported that crude oil inventories rose by 8.701M barrels in the week to November 17, while supplies at Cushing went up by 0.858M barrels, Weekly Distillate Stocks shrank by 1.018M barrels and Gasoline stockpiles increased by 0.749M barrels.
Further rebound in WTI should clear the key 200-day SMA T $78.11 to allow for a potential move to the November top of $80.15 (November 3). The interim 55-day SMA of $84.64 comes next prior to the weekly peak of $89.83 (October 18), the 2023 high of $94.99 (September 28), and the weekly top of $97.65 (August 30, 2022), all ahead of the psychological $100.00 yardstick. On the contrary, a drop below the November low of $72.22 (November 16) could expose the key $70.00 seconded by the 2023 low of $63.61 (May 4) and the $60.00 level.
Resistance levels: $78.42 $79.72 $82.35 (4H chart)
Support levels: $73.77 $72.13 $70.18 (4H chart)
GER40
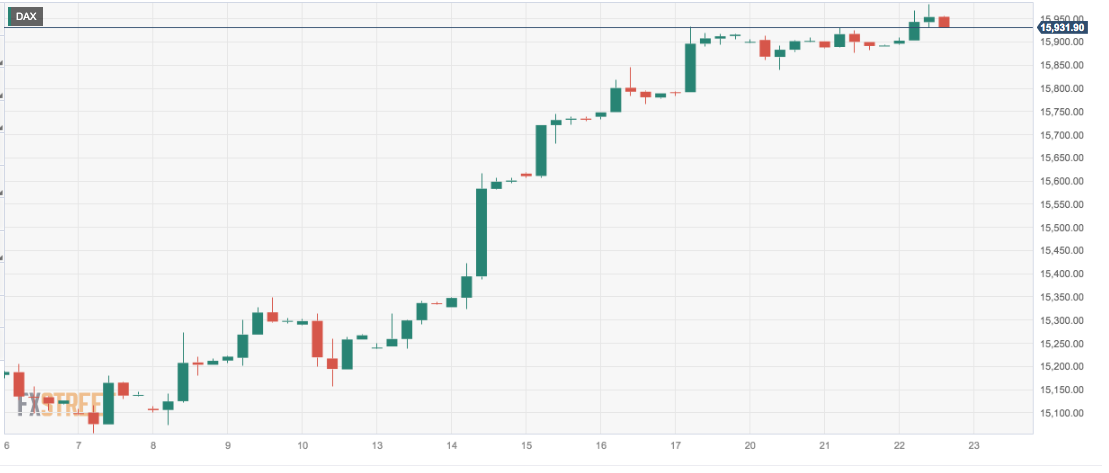
The monthly rally in the German DAX40 remained unabated on Wednesday, pushing the benchmark index to the boundaries of the key 16000 threshold.
The continuation of the march north in the DAX40 reached levels last traded in late August near 16000 against the backdrop of a generalized optimism following diminishing geopolitical concerns, while investors continued to digest the FOMC Minutes (released late on Wednesday) as well as results from megacap NVIDIA,
Looking at the bonds market, the 10-year bund yields remained under pressure in the sub-2.60% zone.
The next objective for the DAX40 is the November high of 15998 (November 22), which is closely followed by the round level of 16000 and weekly peaks of 16042 (August 31) and 16060 (August 10). Further up aligns the all-time top of 16528 (July 31). On the contrary, there is immediate contention at the 200-day SMA at 15659 ahead of the provisional 55-day SMA at 15346. If this area is cleared, the index could revisit the October low of 14630 (October 23) ahead of the March low of 14458 (March 20). The daily RSI kept the overbought ground past 72.
Best Performers: Symrise AG, Siemens Healthineers, Beiersdorf AG
Worst Performers: Bayer, Merk, Dr Ing hc F Porsche Prf
Resistance levels: 15998 16042 16060 (4H chart)
Support levels: 15424 15171 15068 (4H chart)
NASDAQ
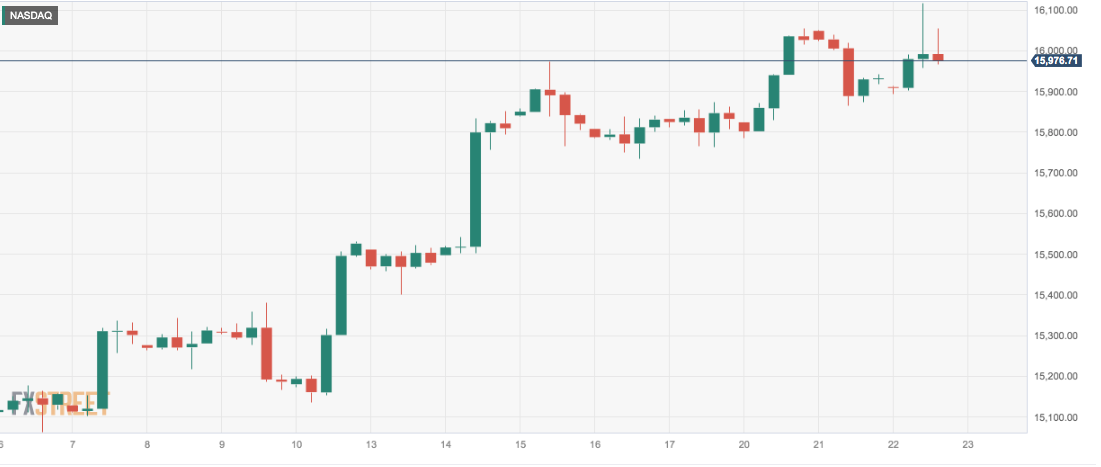
Further gains in the US tech sector catapulted the benchmark Nasdaq 100 to fresh yearly tops past the 16100 level on Wednesday.
The continuation of the bullish trend in the benchmark index came after investors set aside NVIDIA’s cautious message following Wall Street’s close on Tuesday and followed the broad-based optimism among traders ahead of the Thanksgiving Day holiday on Thursday.
Further up for the Nasdaq now comes the December 2021 high of 16607 (December 28) ahead of the all-time peak of 16764 (November 22 2021). Next on the downside emerges the temporary 55-day SMA of 15057, prior to the key 200-day SMA of 14232 and the October low of 14058 (October 26). Further south comes the April low of 12724 (April 25) before the March low of 11695 (March 13) and the 2023 low of 10696 (January 3). The daily RSI rose past the 70 threshold.
Top Gainers: AMD, eBay, Enphase
Top Losers: Autodesk, Tesla, Zoom Video
Resistance levels: 16119 16607 16764 (4H chart)
Support levels: 15171 15029 14058 (4H chart)
DOW JONES
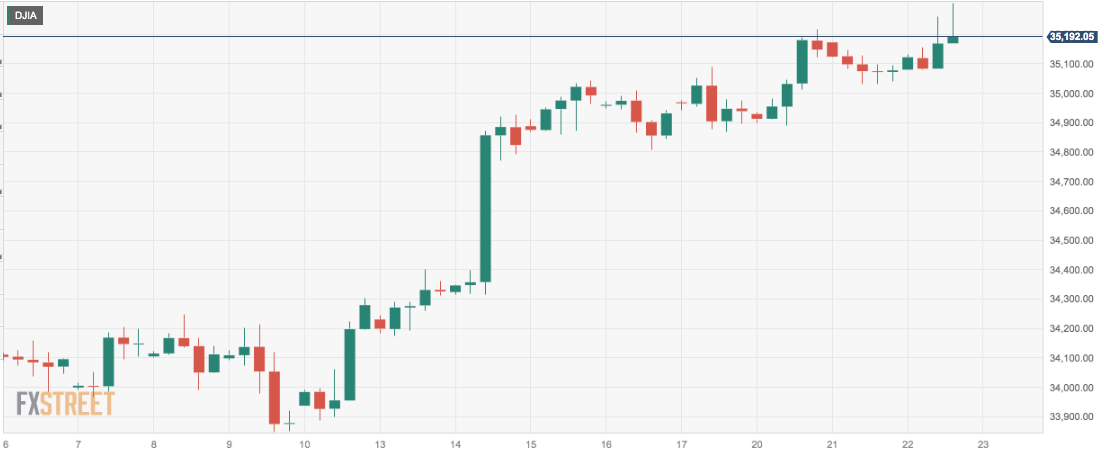
US equities tracked by the Dow Jones extended the move higher to new peaks beyond the 35300 level, an area last seen in mid August.
Investors maintained their optimism well in place and quickly shrugged off Tuesday’s small retracement. Furthermore, traders refocused on the upside and left behind the cautious tone from NVIDIA ahead of the Thanksgiving Day holiday on Thursday.
Additionally, firm speculation of potential interest rate cuts by the Fed in Q1-Q2 2024 also collaborated with the upbeat sentiment among market participants.
On the whole, the Dow Jones gained 0.51% to 35266, the S&P500 advanced 0.50% to 4561, and the tech-focused Nasdaq Composite rose 0.68% to 14296.
Further upside in the Dow Jones could see the 2023 top of 35679 (August 1) revisited ahead of the all-time peak of 36952 (January 5, 2022). Occasional bearish moves should target the 200-day SMA at 33853 prior to the October low of 32327 (October 27) and the 2023 bottom of 31429 (March 15). The breach of the latter could allow for a drop to the 2022 low of 28660 (October 13). The everyday RSI entered the overbought area past 71.
Top Performers: Microsoft, 3M, Home Depot
Worst Performers: Walgreen Boots, Caterpillar, Merck&Co
Resistance levels: 35315 35578 35679 (4H chart)
Support levels: 34336 33859 33647 (4H chart)
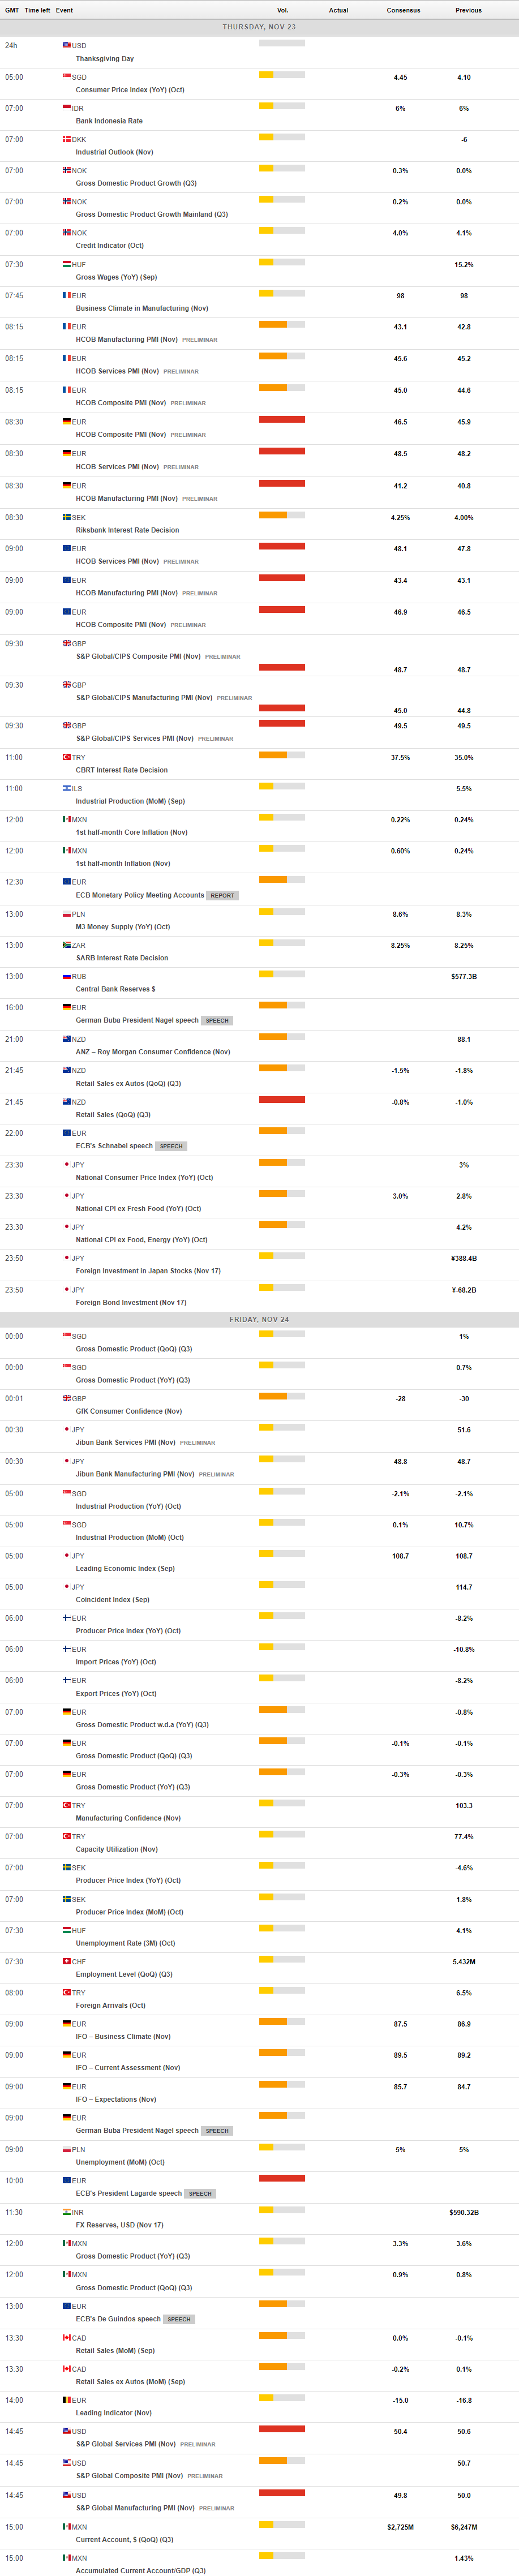
MACROECONOMIC EVENTS
All Information & Updates provided by:

All information relating to the financial markets available on this page has been prepared and issued by FXStreet (Forexstreet SL, Spain, Reg: B62498233) on the basis of publicly available information and all information believed to be reliable and does not conflict with Kuwaiti local laws, and all necessary care has been taken to before the company to ensure that the facts mentioned are correct from the source.
NCM Investment nor any of its directors or employees shall in any way be held responsible for the contents of this news, and the information contained on this page is intended only to provide clients with publicly available information and should not be construed as investment advice, report or analysis and/or constitute an offer or invitation to buy or sell financial instruments of any kind.
RISK WARNING: Forex and CFDs are highly risky leveraged products, as losses can exceed deposits. Please ensure you understand all the risks and take independent advice if necessary. NCM will segregate the clients based on the criteria of the regulator and its bylaws. NCM does not provide any advisory service; the material published does not constitute advice or a recommendation for a transaction in any financial instrument. NCM accepts no responsibility for any use of the content presented and any consequences of that use. Anyone acting on the information provided does so at their own risk.