
- Contact Us:
-

-

-

-


Daily Market Updates
24 Nov 2023
USDJPY
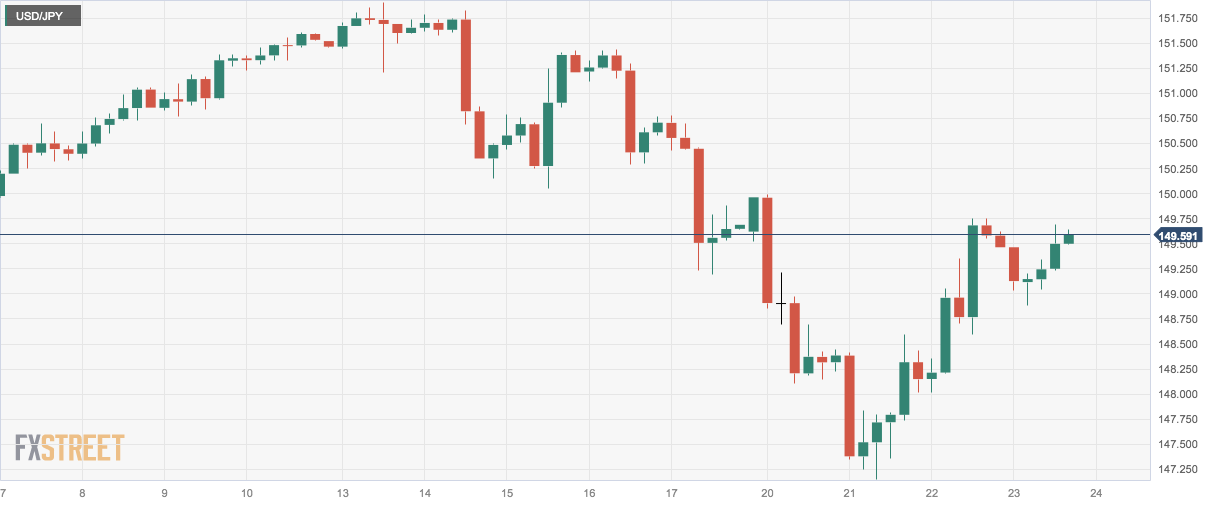
USD/JPY saw its recent upside bias somewhat curtailed on Thursday amidst the inactivity in the US and Japanese markets due to the Thanksgiving Day holiday and the Workers Day holiday, respectively.
Indeed, spot trimmed part of the recent two-day recovery and resumed the decline, flirting at the same time with the provisional 55-day SMA around 149.30/40 band.
If USD/JPY accelerates its losses, it may revisit the November low of 147.15 (November 21) prior to the provisional 100-day SMA at 146.65, the weekly low of 145.89 (September 11) and the September low of 144.43 (September 1). Beyond that, there are no important support levels until the August low of 141.50 (August 7), which appears propped up by the crucial 200-day SMA, and the July low of 137.23 (July 14). On the opposite side, if the pair breaks above the 2023 high of 151.90 (November 13), it may challenge the 2022 top of 151.94 (October 21), followed by the 152.00 round milestone. The RSI deflated to the 46 region.
Resistance levels: 149.74 149.98 151.42 (4H chart)
Support levels: 147.15 145.89 144.43 (4H chart)
GBPUSD
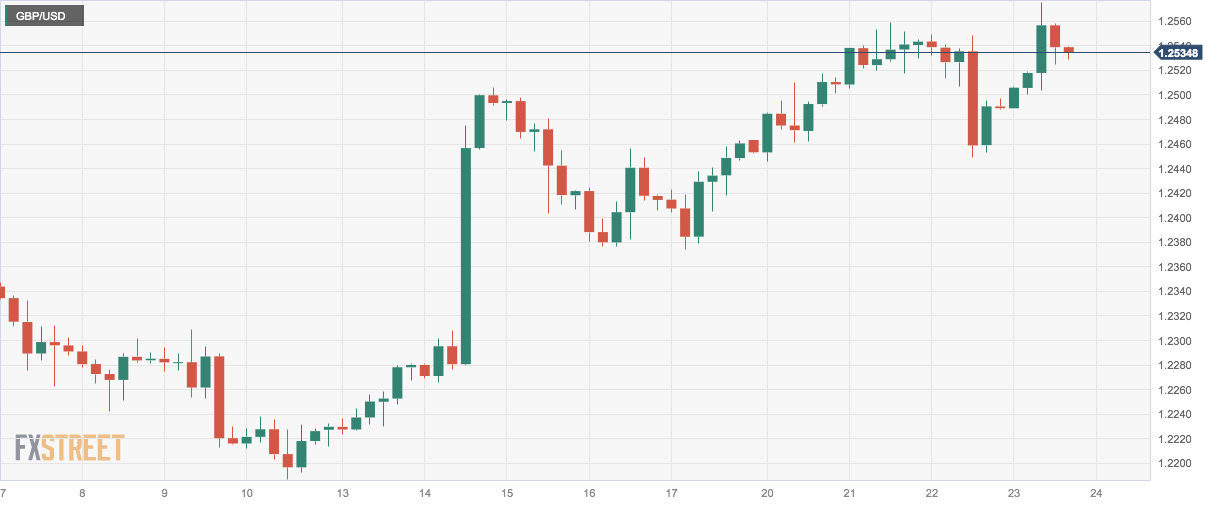
The marked decline in the US dollar in combination with the improved sentiment in the risk-linked galaxy underpinned the daily upside GBP/USD to levels last seen in early September around 1.2570 on Thursday.
In addition, the British pound saw its momentum reinvigorated after the preliminary Services PMI returned to the area above the 50 threshold (50.5), indicative of expansion, for the current month. The Manufacturing gauge also improved, this time to 46.7.
The November high of 1.2569 (November 23) for GBP/USD is immediately to the upside, followed by weekly tops of 1.2746 (August 30), 1.2818 (August 10), and 1.2995 (July 27), all of which are above of the important 1.3000 mark. The intermediate 55-day SMA of 1.2278, on the other hand, comes ahead of the weekly low of 1.2187(November 10). The loss of the latter could open the door to weekly lows of 1.2069 (October 26) and 1.2037 (October 3), prior to the important 1.2000 level and the 2023 low of 1.1802 (March 8). The RSI for the day climbed to the vicinity of 65.
Resistance levels: 1.2569 1.2642 1.2746 (4H chart)
Support levels: 1.2448 1.2373 1.2265 (4H chart)
AUDUSD
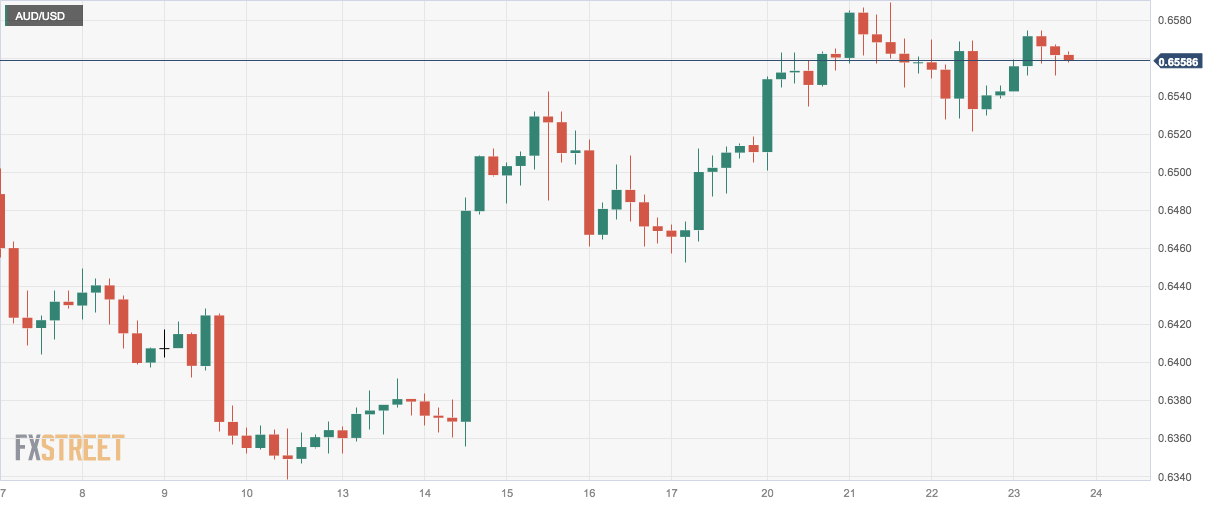
The resumption of the selling pressure in the greenback prompted AUD/USD to regain fresh buying interest and revisit the 0.6570/75 band on Thursday, leaving behind at the same time Wednesday’s modest pullback.
In addition, the Aussie dollar managed to gather some support from the extra improvement in copper prices and another uptick in prices of the tonne of iron ore.
Against this backdrop, the pair managed to resume the strong recovery in place since mid-November and flirt once again with multi-week highs well north of the 0.6500 barrier.
In the Australian docket, the advanced Judo Bank Manufacturing PMI eased to 47.7 in November and 46.3 when it came to the Services PMI.
If the AUD/USD crosses over the November high of 0.6589 (November 21), it might test the weekly top of 0.6616 (August 10) before the July peak of 0.6894 (July 14). Further up is the June high of 0.6899 (June 16), prior to the critical 0.7000 level. The 55-day SMA at 0.6406, on the flip side, provides temporary support ahead of the 2023 bottom of 0.6270 (October 26). If this area fails, the pair is projected to fall to the round level of 0.6200, which is close to the 2022 bottom of 0.6169 (October 13). The daily RSI advanced to the 63 zone.
Resistance levels: 0.6589 0.6616 0.6739 (4H chart)
Support levels: 0.6521 0.6452 0.6401 (4H chart)
GOLD
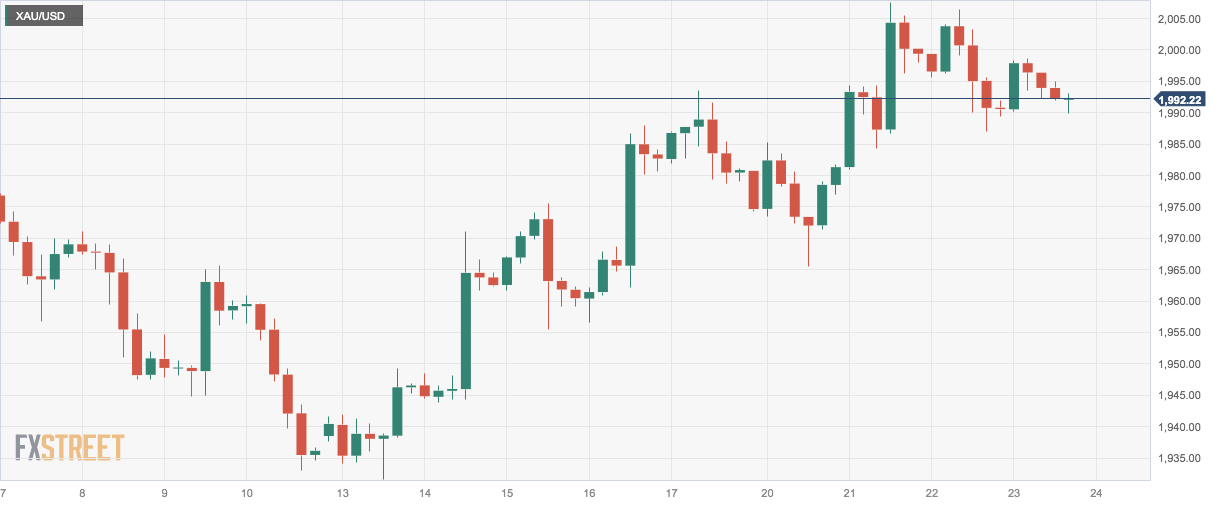
The yellow metal faltered once again near the critical $2000 mark per troy ounce on Thursday, although it managed well to maintain the humble gains for the day around the $1990 area.
The bullish attempt in bullion was accompanied by the renewed weakness in the greenback and the lack of activity in US yields due to the Thanksgiving Day holiday, while the positive outlook also remains bolstered by prospects of interest rate cuts by the Fed early in 2024.
Gold continues to target the October top of $2009 (October 27). If this level is surpassed, the 2023 peak of $2067 (May 4) may be tested before the 2022 high of $2070 (March 8) and the all-time top of $2075 (August 7, 2020). If sellers take control, the yellow metal may aim for the November low of $1931 (November 13), which coincides with the preliminary 55-day SMA. From here, the October low of $1810 (October 6), the 2023 low of $1804 (February 28), and the primary conflict region of $1800 are all oriented down.
Resistance levels: $2009 $2022 $2048 (4H chart)
Support levels: $1989 $1965 $1953 (4H chart)
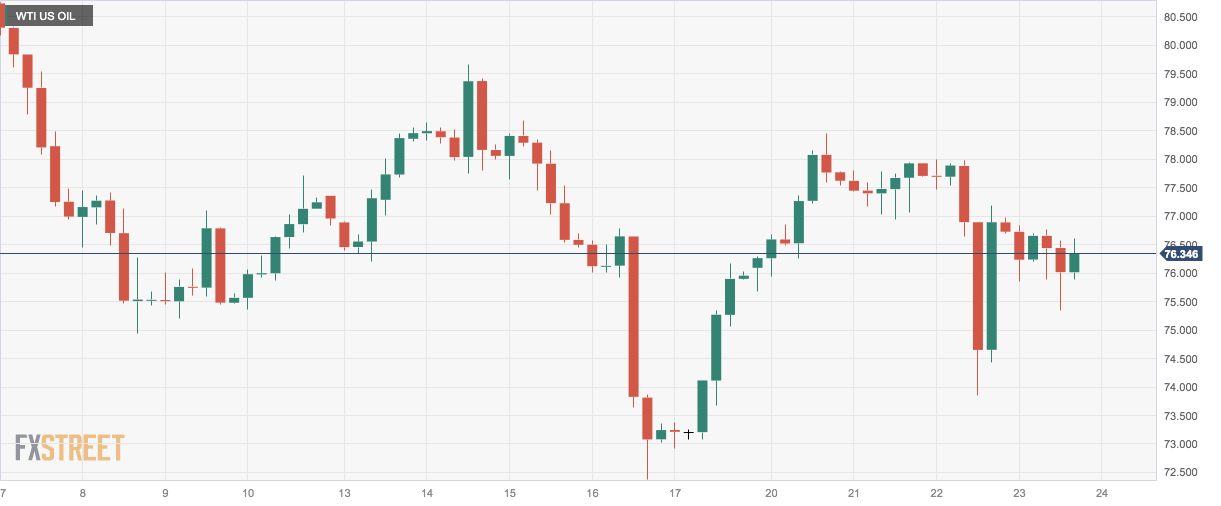
CRUDE WTI
WTI prices briefly dipped to the $75.30 region before attempting a comeback to the area beyond the $76.00 mark per barrel on Thursday.
Indeed, crude oil prices retreated modestly as investors continued to assess the larger-than-expected weekly build in US crude oil stockpiles (+8.701M barrels), as reported by the EIA on Wednesday.
In addition prudence among traders seems to have also resurfaced ahead of the postponed OPEC+ meeting, which has been rescheduled for November 30, while concerns over the health of the European economy picked up in the wake of still gloomy advanced gauges from the manufacturing and services sectors.
WTI is expected to meet the immediate up-barrier at the November high of $80.15 (November 3). North from here, the provisional 55-day SMA of $84.45 is followed by the weekly tops of $89.83 (October 18), $94.99 (September 28), and $97.65 (August 30, 2022), all before the psychological $100.00 mark. Having said that, the loss of the November low of $72.22 (November 16) could prompt a potential tes of the important $70.00 per barrel to emerge on the horizon before the 2023 low of $63.61 (May 4) and the $60.00 level.
Resistance levels: $78.42 $81.68 $82.35 (4H chart)
Support levels: $73.77 $72.13 $70.18 (4H chart)
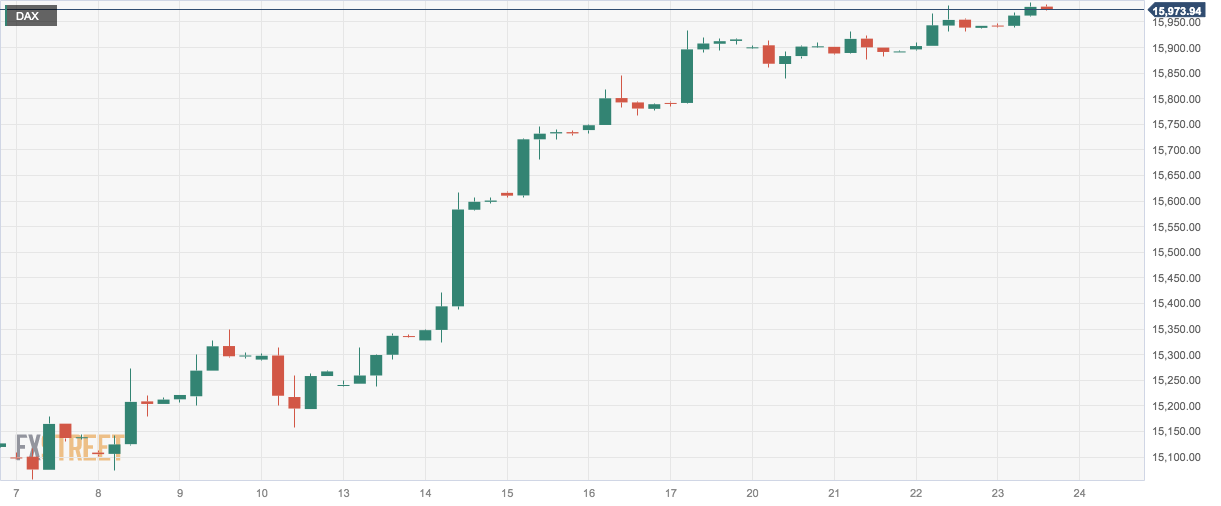
GER40
The monthly rally in the German DAX40 remained unabated on Thursday, pushing the benchmark index briefly above the key 16000 threshold, just to end the session slightly below it.
The continuation of the march north in the DAX40 came amidst the move higher in its European peers across the board in response to diminishing geopolitical concerns and further signs that the ECB might embark on a protracted pause to at least H1 2024, as per latest comments from policy makers.
Looking at the bonds market, the 10-year bund yields rebounded to three-day highs past the 2.62% level.
The next target for the DAX40 is the November high of 16005 (November 23) ahead of the weekly tops of 16042 (August 31) and 16060 (August 10). The breakout of the latter should unveil a probable visit to the all-time peak of 16528 (July 31). The index, on the other side, might be dragged to the 200-day SMA at 15662 before reaching the transitory 55-day SMA at 15351. If this level is breached, the October bottom of 14630 (October 23) may be retested before the March low of 14458 (March 20). The day-to-day RSI climbed further into the overbought zone past 73.
Best Performers: Deutsche Boerse, SAP, Commerzbank
Worst Performers: Dr Ing hc F Porsche Prf, Rheinmetall AG, Zalando SE
Resistance levels: 16005 16042 16060 (4H chart)
Support levels: 15428 15171 15068 (4H chart)
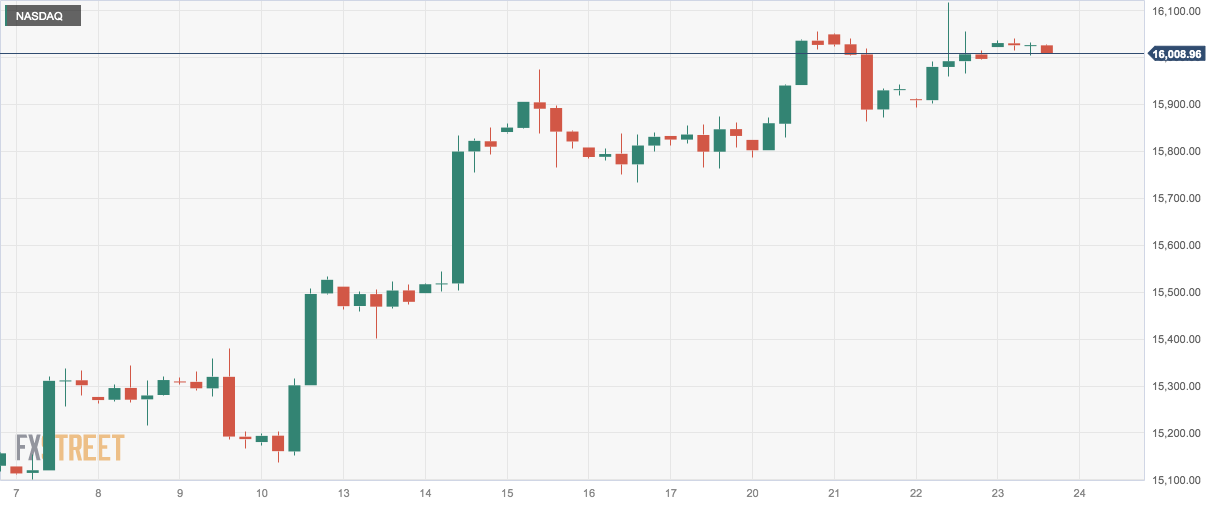
NASDAQ
Additional advancements in the US technology industry propelled the Nasdaq 100 benchmark to reach new highs for the year, surpassing the 16100 mark on Wednesday.
The sustained upward movement in the benchmark index occurred despite investors disregarding NVIDIA's conservative outlook after the close of Wall Street in the previous session. Instead, they embraced the widespread positivity among traders in anticipation of the Thanksgiving Day holiday on Thursday.
Additional Nasdaq gains might propel the index to the 2023 peak of 16119 (November 22) before the December 2021 high of 16607 (December 28) and the all-time top of 16764 (November 22 2021). On the other hand, immediate support appears to be in the vicinity of the preliminary 55-day SMA of 15056, which is placed ahead of the key 200-day SMA of 14232 and the October low of 14058 (October 26). Further losses might jeopardize the April low of 12724 (April 25), placing it ahead of the March low of 11695 (March 13) and the 2023 low of 10696 (January 3). The RSI advanced a tad past the 69 level.
Top Gainers: eBay, AMD, MercadoLibre
Top Losers: Autodesk, Zoom Video, Tesla
Resistance levels: 16119 16607 16764 (4H chart)
Support levels: 15168 14983 14058 (4H chart)
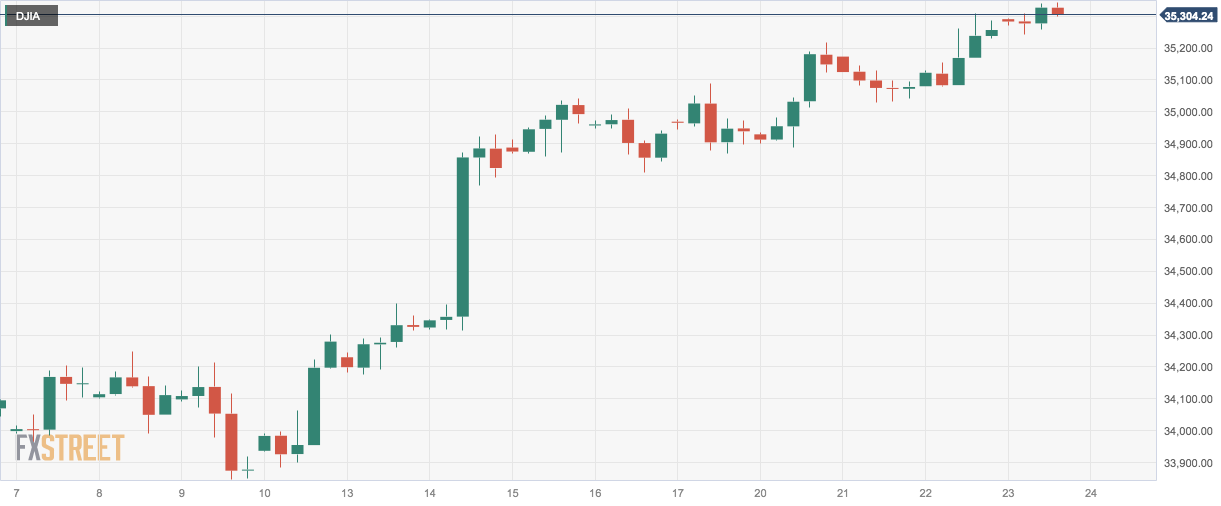
DOW JONES
US stocks, as monitored by the Dow Jones, continued their upward momentum, reaching fresh highs above the 35300 mark, a level not witnessed since mid-August.
Investors remained steadfast in their optimism, swiftly brushing off Tuesday's minor pullback. Moreover, traders redirected their attention to the positive side, leaving behind NVIDIA's cautious stance in anticipation of the Thanksgiving Day holiday on Thursday.
Furthermore, strong speculation about possible interest rate reductions by the Fed in the first and second quarters of 2024 added to the positive sentiment among market participants.
On the whole, the Dow Jones gained 0.53% to 35273, the S&P500 advanced 0.41% to 4556, and the tech-oriented Nasdaq Composite rose 0.46% to 14265.
Given the current market trend, the Dow Jones should now aim for the 2023 top of 35679 (August 1) before the all-time peak of 36952 (January 5, 2022). On the downside, the 200-day SMA is projected to provide early contention at 33853, ahead of the October low of 32327 (October 27). The loss of the latter might pave the way for a drop to the 2023 low of 31429 (March 15), seconded by the 2022 bottom of 28660 (October 13). The daily RSI entered the overbought zone past the 71 yardstick.
Top Performers: 3M, Microsoft, Home Depot
Worst Performers: Walgreen Boots, Caterpillar, Walmart
Resistance levels: 35315 35578 35679 (4H chart)
Support levels: 34348 33859 33647 (4H chart)
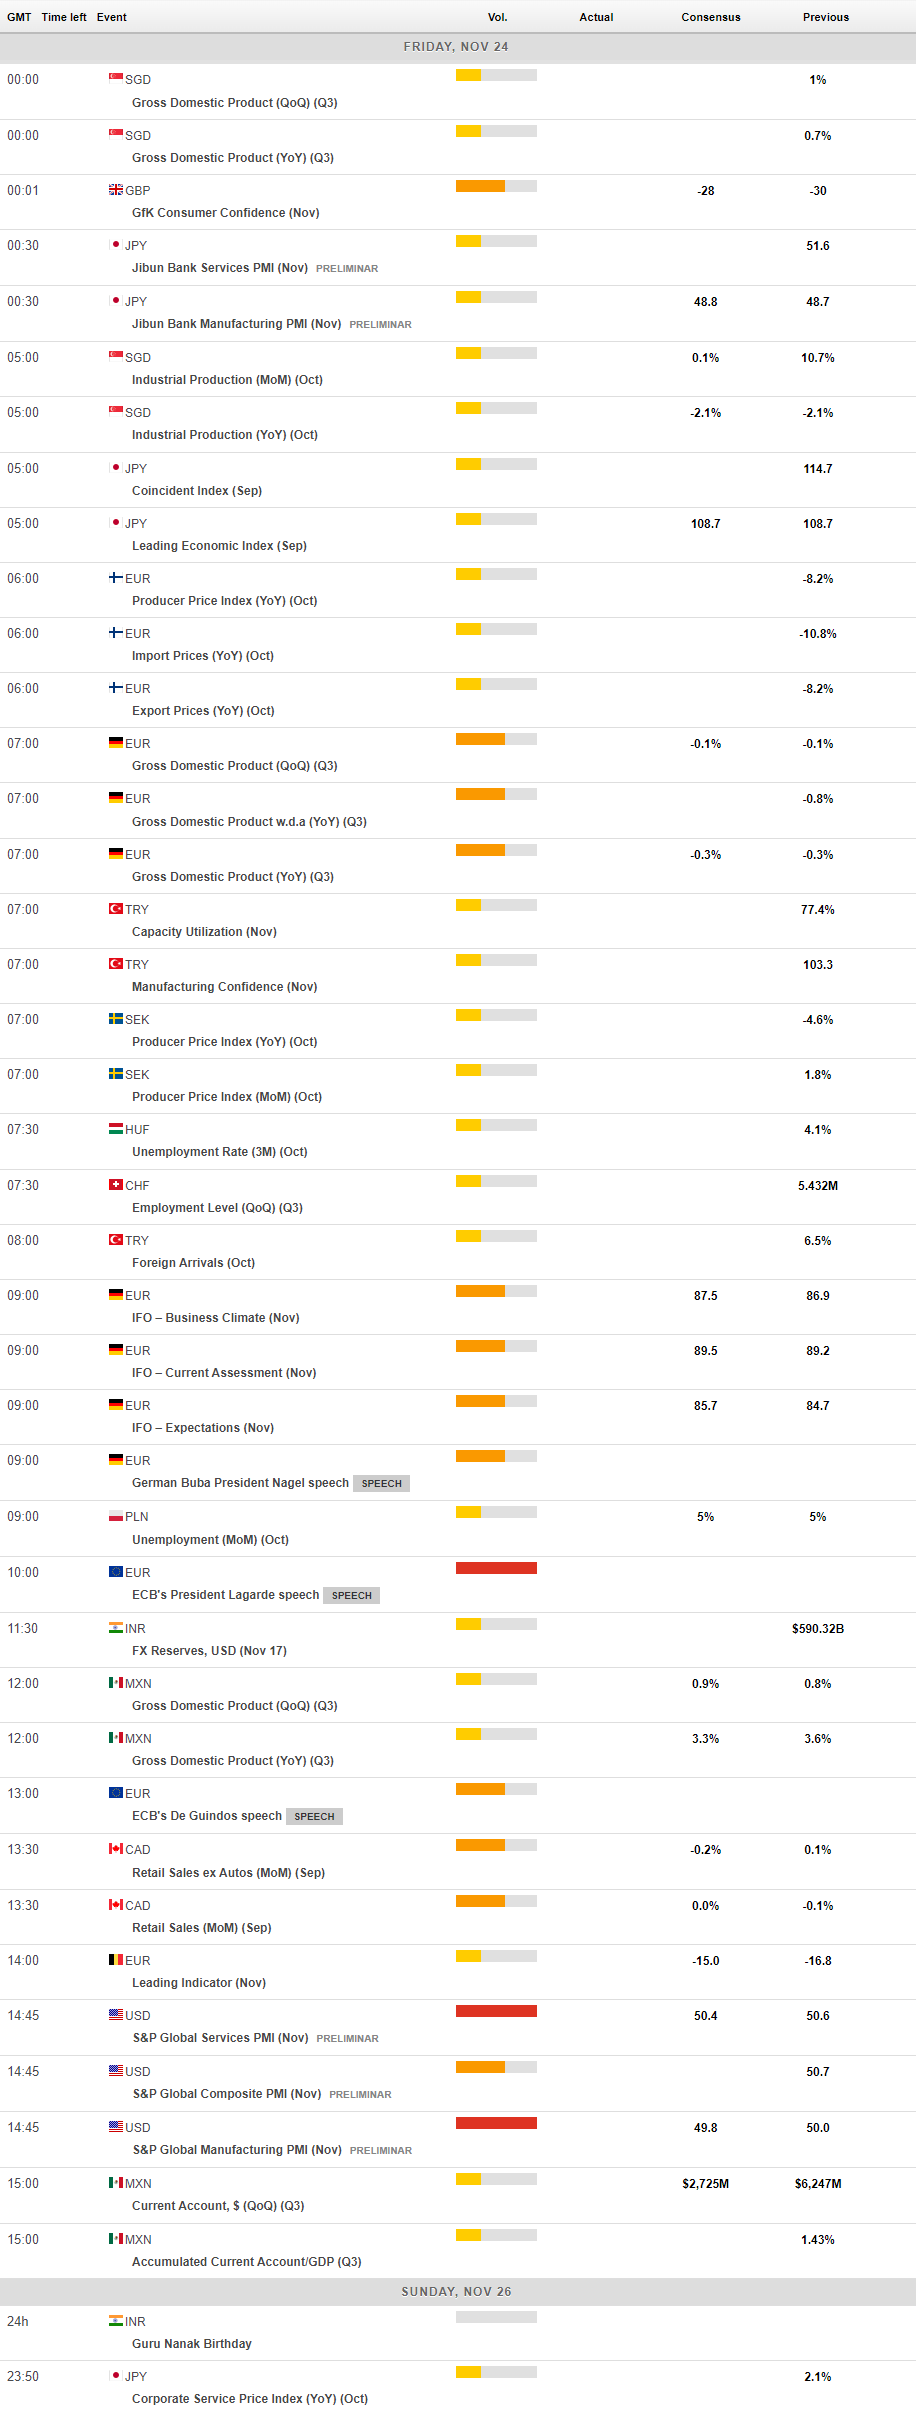
MACROECONOMIC EVENTS
All Information & Updates provided by:

All information relating to the financial markets available on this page has been prepared and issued by FXStreet (Forexstreet SL, Spain, Reg: B62498233) on the basis of publicly available information and all information believed to be reliable and does not conflict with Kuwaiti local laws, and all necessary care has been taken to before the company to ensure that the facts mentioned are correct from the source.
NCM Investment nor any of its directors or employees shall in any way be held responsible for the contents of this news, and the information contained on this page is intended only to provide clients with publicly available information and should not be construed as investment advice, report or analysis and/or constitute an offer or invitation to buy or sell financial instruments of any kind.
RISK WARNING: Forex and CFDs are highly risky leveraged products, as losses can exceed deposits. Please ensure you understand all the risks and take independent advice if necessary. NCM will segregate the clients based on the criteria of the regulator and its bylaws. NCM does not provide any advisory service; the material published does not constitute advice or a recommendation for a transaction in any financial instrument. NCM accepts no responsibility for any use of the content presented and any consequences of that use. Anyone acting on the information provided does so at their own risk.