
- Contact Us:
-

-

-

-


Daily Market Updates
27 Nov 2023
USDJPY
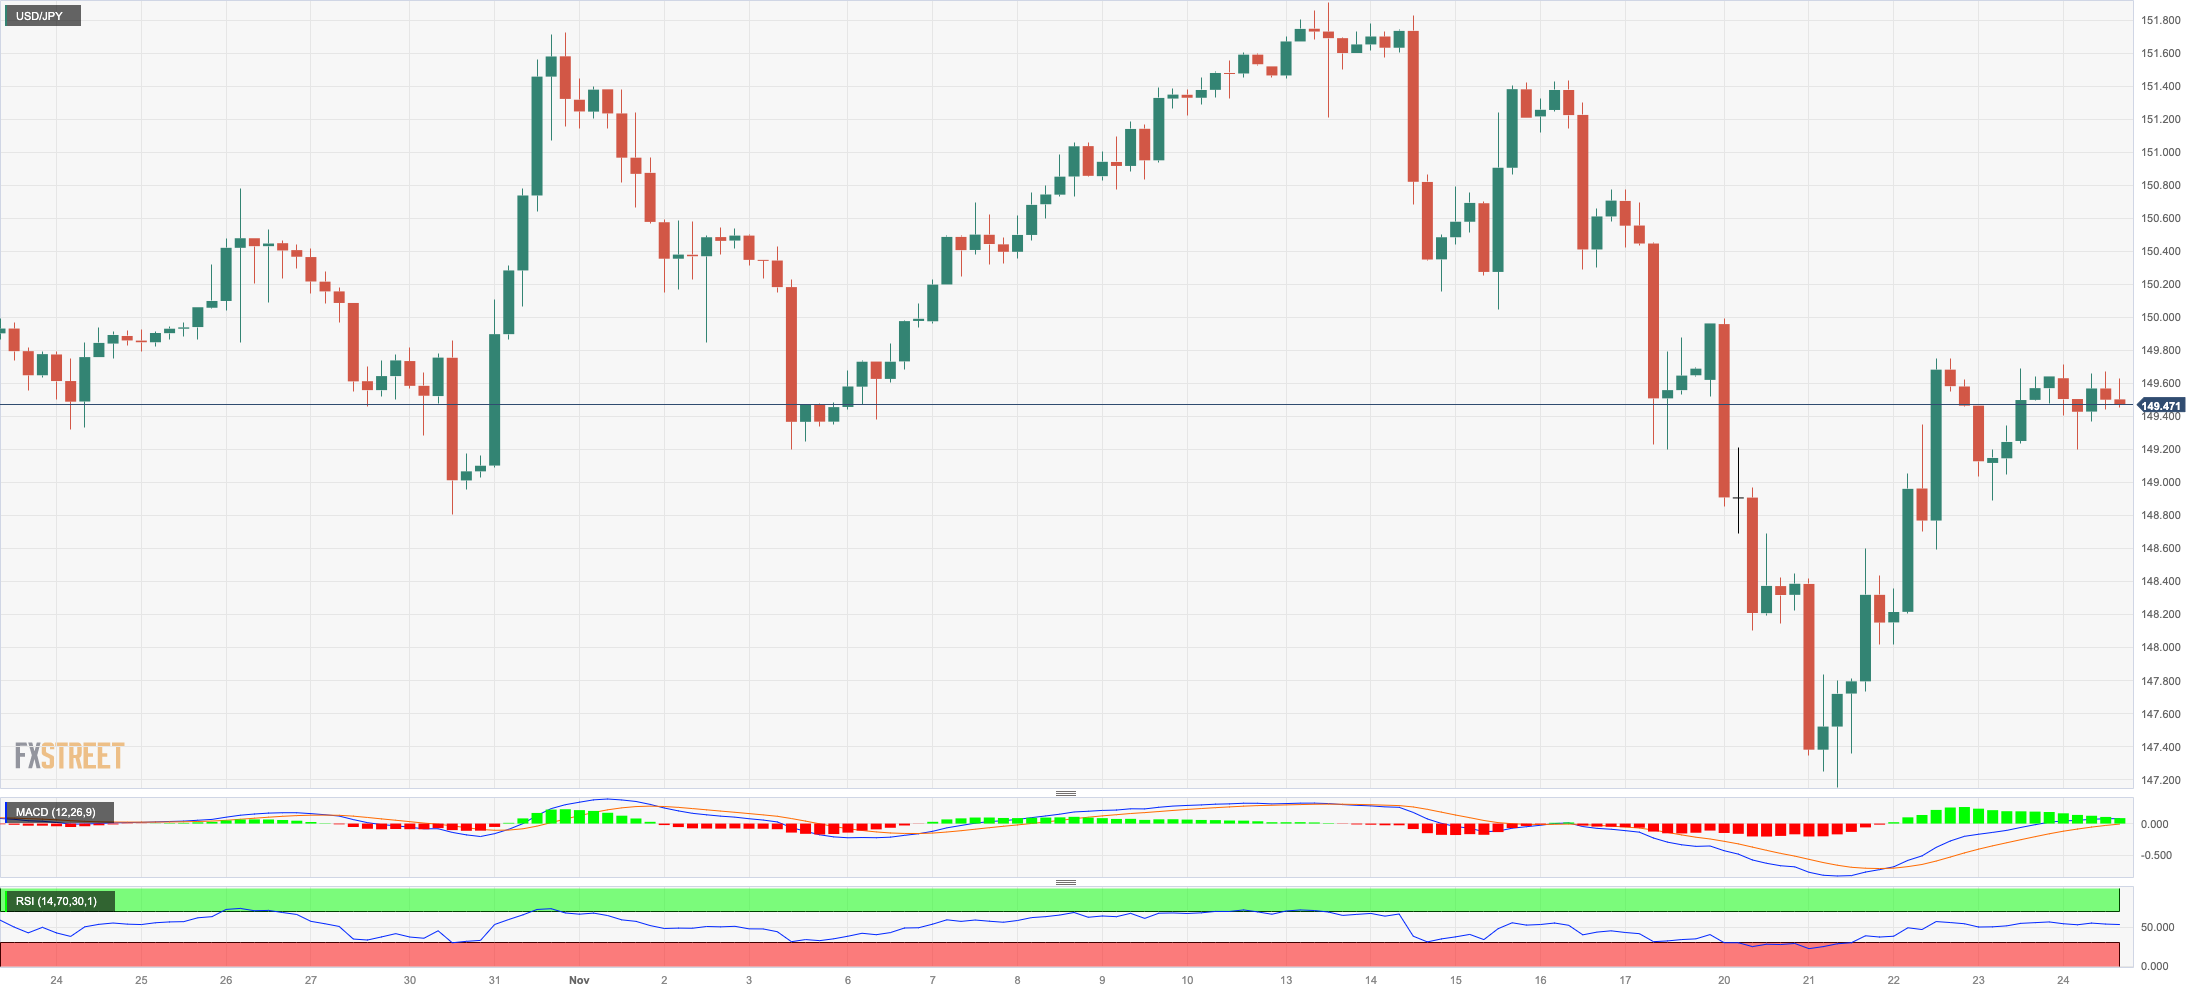
USD/JPY mirrored Thursday’s session and navigated within a narrow range in the mid-149.00s at the end of the week.
The pair’s irresolute price action came on the back of the marked decline in the greenback and the strong bounce in US and Japanese yields, particularly in the belly of the curve.
In the Japanese calendar, the Inflation Rate came in at 3.3% in the year to October, while the Core Inflation Rate rose 2.9% YoY and the Inflation Rate Ex-Food and Energy gained 4.0% YoY. Additional data saw Foreign Bond Investment rise by ¥2.5B in the week to November 18, while the final Coincident Index and Leading Economic Index turned up at 114.7 and 108.9, respectively, in September.
If USD/JPY continues to fall, it may revisit the November low of 147.15 (November 21), which is just ahead of the provisional 100-day SMA at 146.73, as well as the weekly low of 145.89 (September 11) and the September bottom of 144.43 (September 1). There are no significant support levels beyond the latter until the August low of 141.50 (August 7), which seems to be supported by the proximity of the critical 200-day SMA and comes ahead of the July low of 137.23 (July 14). Just the opposite, bulls should look to retest the 2023 high of 151.90 (November 13), prior to the 2022 top of 151.94 (October 21) and the 152.00 round figure. The RSI settled just below 48.
Resistance levels: 149.74 149.99 151.42 (4H chart)
Support levels: 147.15 145.89 144.43 (4H chart)
GBPUSD
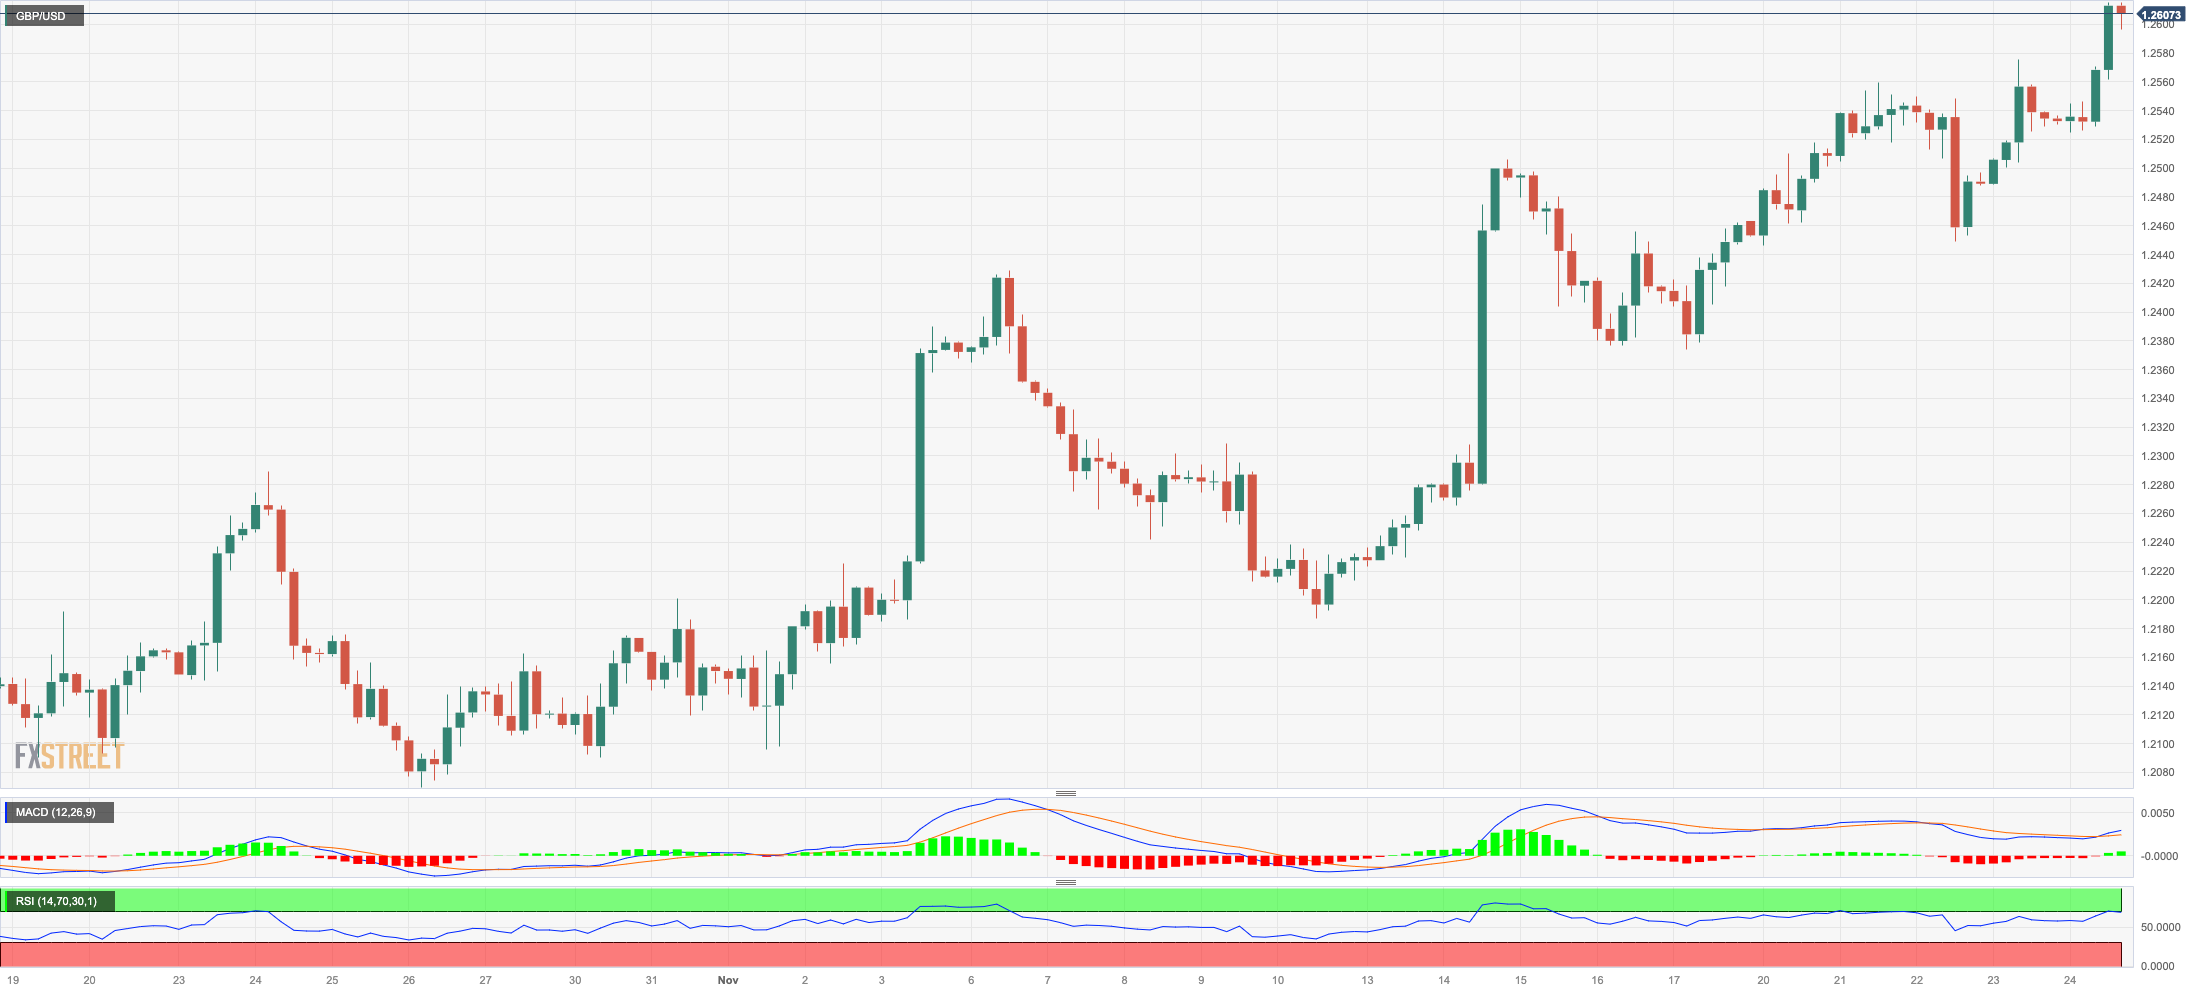
The firm selling pressure around the dollar catapulted GBP/USD to levels last seen in early September beyond 1.2600 the figure on Friday.
The second consecutive daily advance in Cable was also underpinned by the broad-based optimism in the risk-linked galaxy, equally reinforced by investors’ perception that major central banks could have entered an impasse in their tightening campaigns.
Extra strength for the quid came after comments from BoE’s Chief Economist H. Pill pushed back speculation of potential rate cuts by the bank in the summer. Indeed, he argued that the challenge for the bank, and other central banks too, is that headline inflation is coming down while economic activity and employment growth are weakening. However, he said that the central bank cannot afford to ease off tight monetary policy.
Data-wise across the Channel, Consumer Confidence in the UK tracked by Gfk improved to -24 for the month of November.
The November high for GBP/USD is 1.2615 (November 24), followed by weekly tops of 1.2746 (August 30), 1.2818 (August 10), and 1.2995 (July 27), all of which are above the critical 1.3000 level. In contrast, the key 200-day SMA at 1.2453 is expected to offer initial contention prior to the intermediate 55-day SMA of 1.2280. South from here aligns the weekly low of 1.2187 (November 10) seconded by weekly lows at 1.2069 (October 26) and 1.2037 (October 3), all before the crucial 1.2000 level and the 2023 low of 1.1802 (March 8). The RSI for the day increased to nearly 68.
Resistance levels: 1.2615 1.2642 1.2746 (4H chart)
Support levels: 1.2448 1.2373 1.2275 (4H chart)
AUDUSD
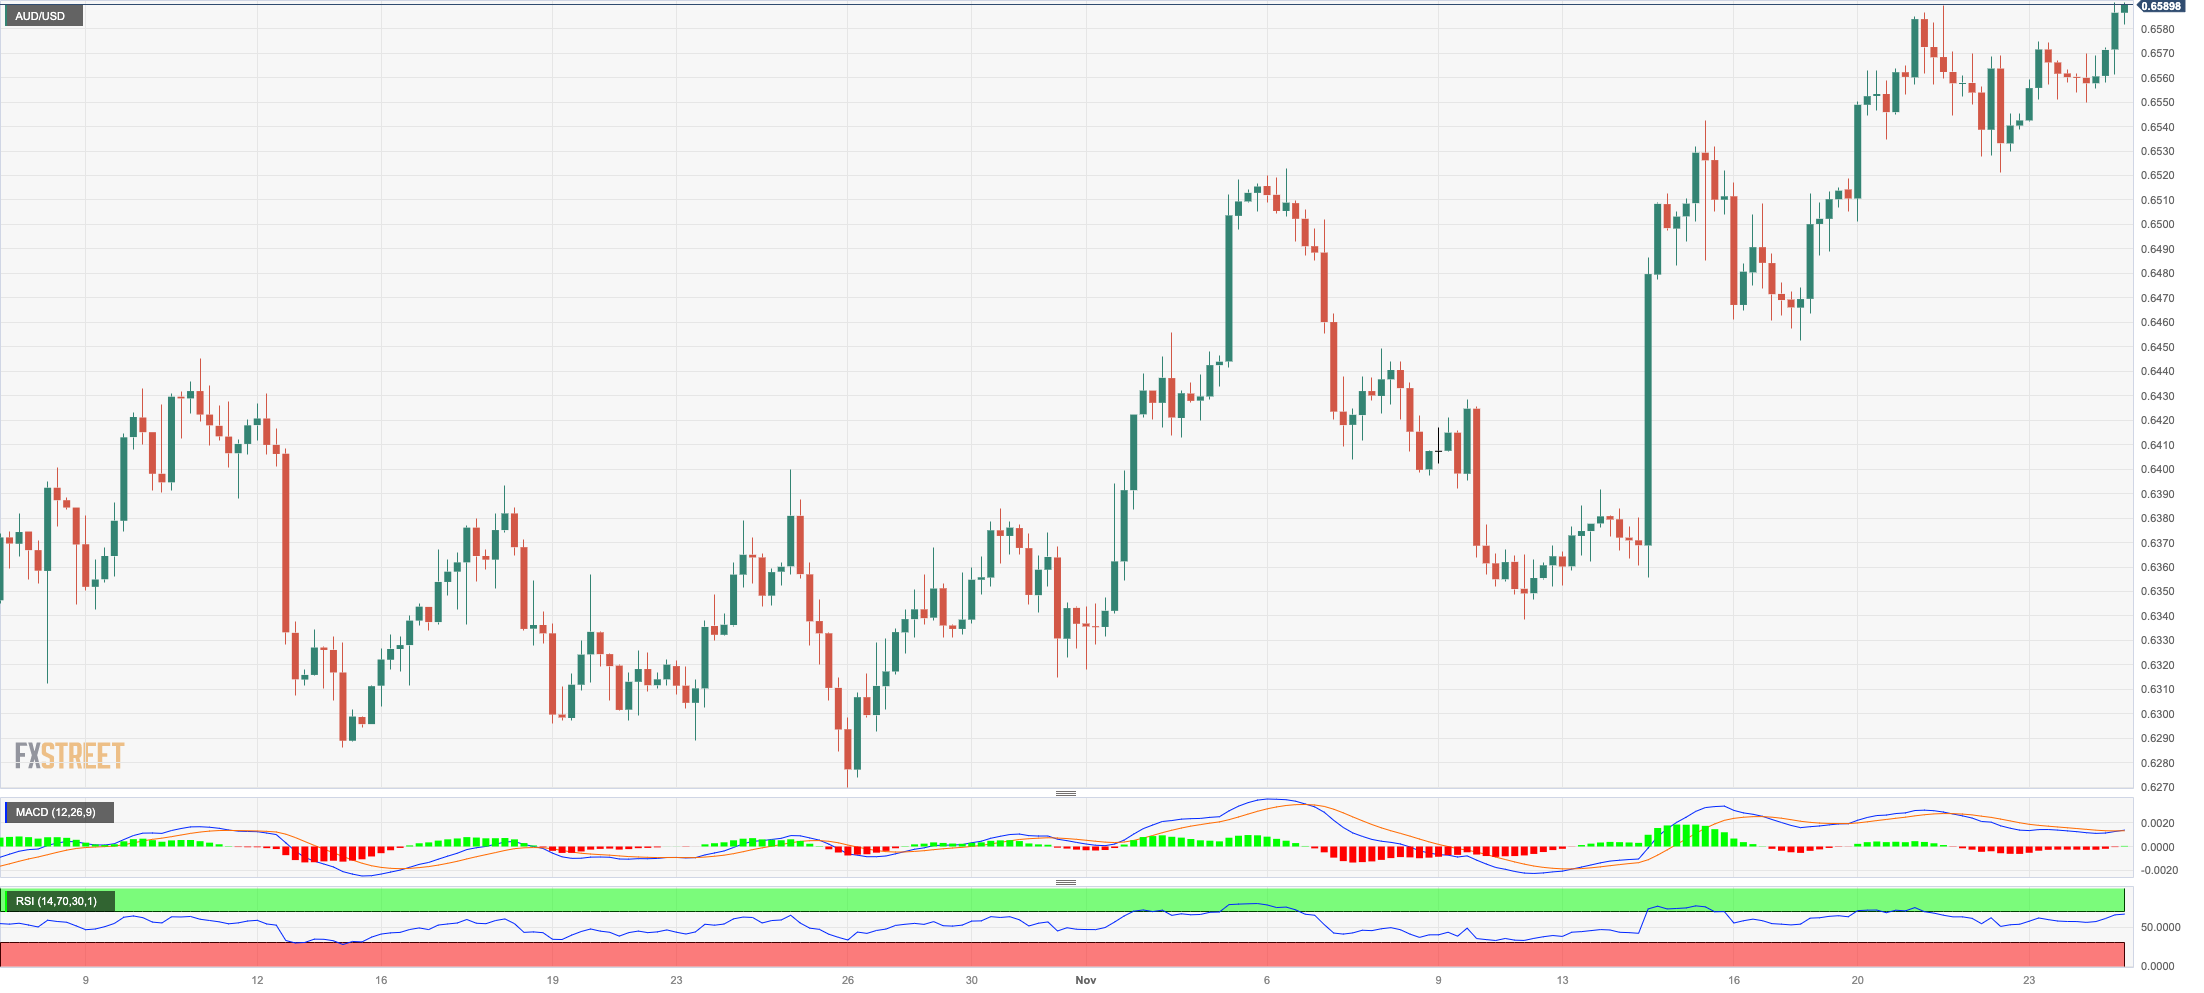
AUD/USD added to Thursday’s advance and returned to the upper end of the monthly range just below 0.6600 the figure at the end of the week, an area where the key 200-day SMA also sits.
The negative price action in the greenback helped the Aussie dollar extend its upside momentum, while extra improvement in both copper prices and iron ore also contributed to the continuation of the two-week recovery so far.
There were no data releases scheduled for Down Under on Friday.
Immediately to the upside for AUD/USD emerges the November high of 0.6591 (November 24). The surpass of this level could put a test of the weekly top of 0.6616 (August 10) back on the radar before the July peak of 0.6894 (July 14). The June high of 0.6899 (June 16) aligns north from here, just prior to the key 0.7000 threshold. In contrast, the 55-day SMA at 0.6410 provides temporary support ahead of the 2023 bottom of 0.6270 (October 26). If this region fails, the pair is expected to drop to the round level of 0.6200, ahead of the 2022 low of 0.6169 (October 13). The daily RSI improved north of the 65 yardstick.
Resistance levels: 0.6591 0.6616 0.6739 (4H chart)
Support levels: 0.6521 0.6452 0.6338 (4H chart)
GOLD
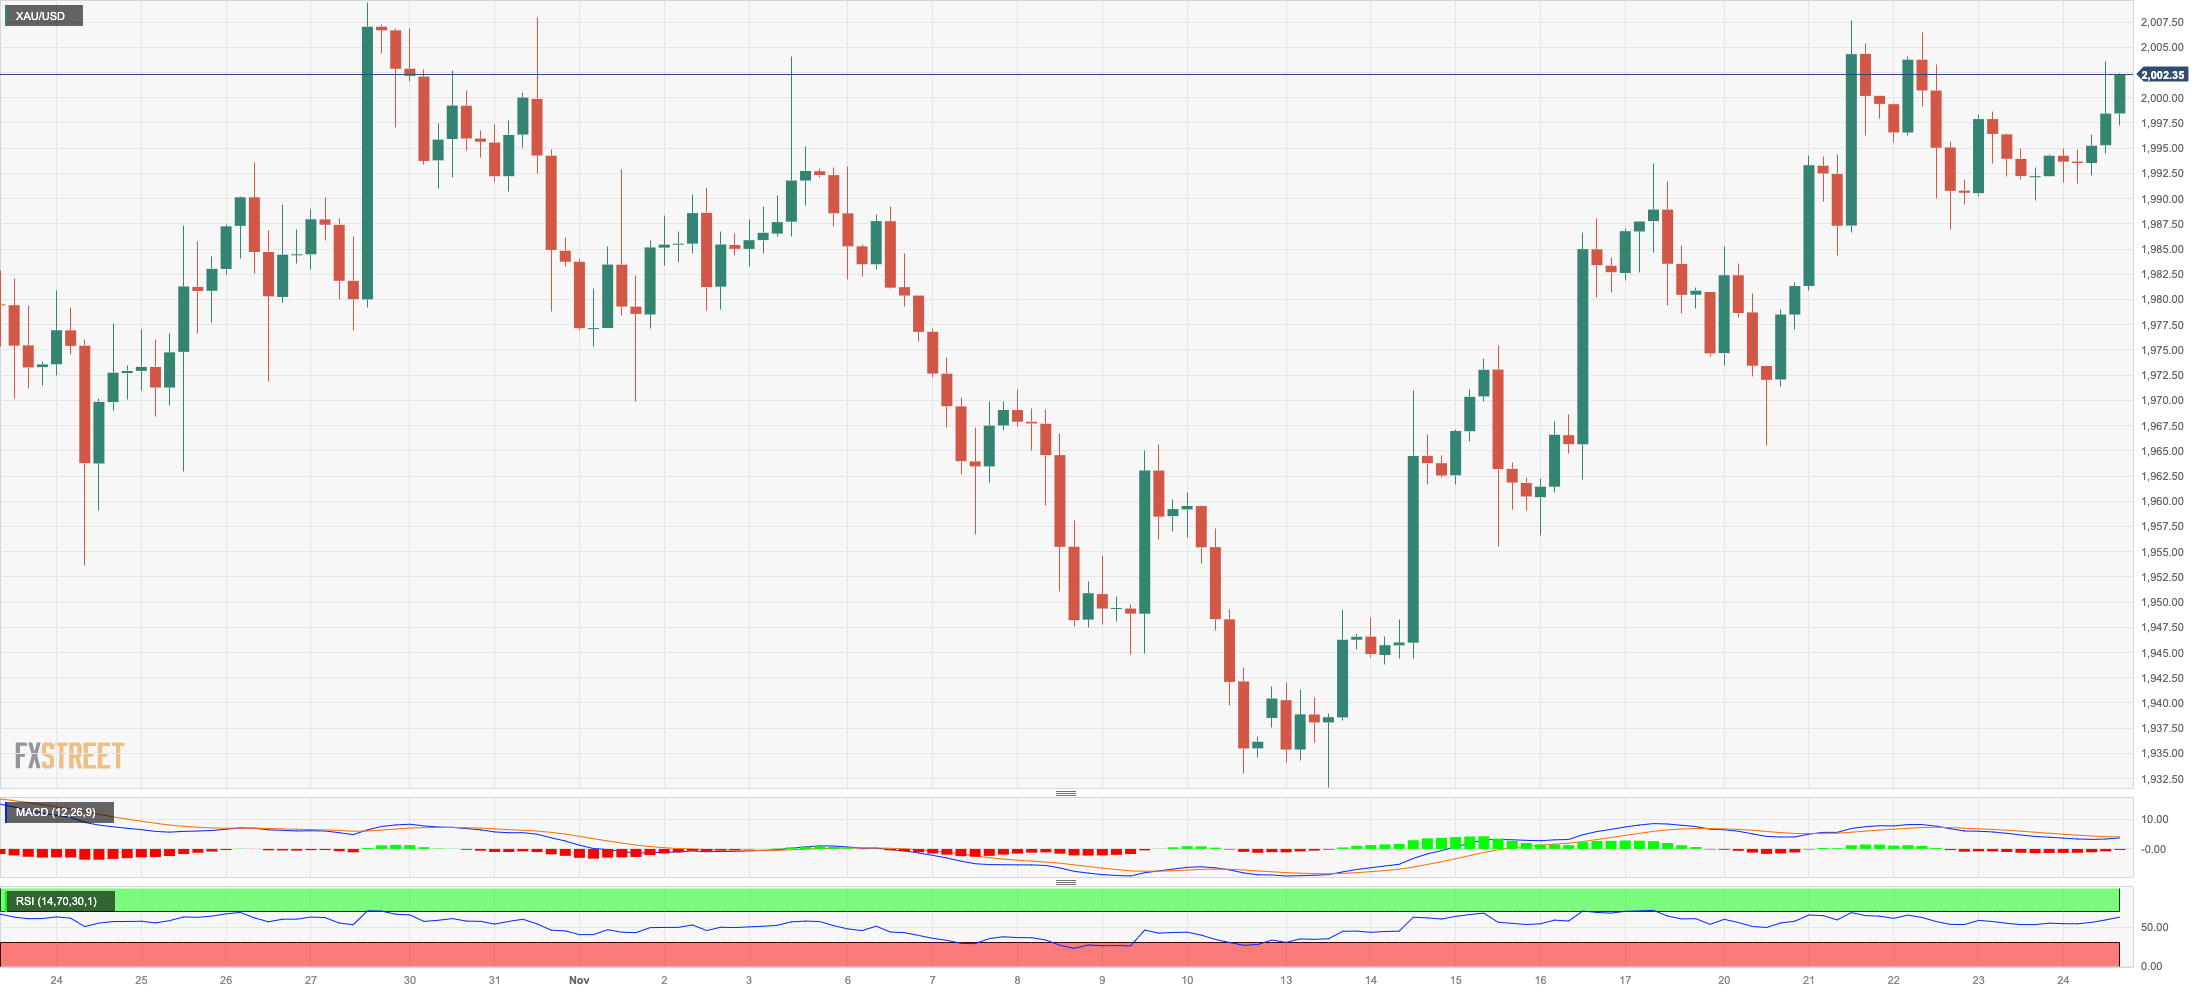
Prices of the yellow metal advanced for the second session in a row and surpassed once again the critical resistance level of $2000 on Friday.
The persistent weakness in the greenback bolstered the decent gains in bullion, although the strong rebound in US yields across the curve appears to have limited the upside potential somehow.
So far, markets’ expectations of the start of interest rate reductions by the Fed in early 2024 should be supportive of the continuation of the uptrend in the precious metal.
Gold still faces the next up-barrier at the October high of $2009 (October 27). If this level is trespassed, the 2023 top of $2067 (May 4) may be tried before the 2022 peak of $2070 (March 8) and the all-time high of $2075 (August 7, 2020). If sellers regain control, the yellow metal may attempt to reach the November low of $1931 (November 13), which appears reinforced by the preliminary 55-day SMA ($1933). Once this area is cleared, the metal could challenge the October low of $1810 (October 6), followed by the 2023 bottom of $1804 (February 28) and the major conflict region of $1800.
Resistance levels: $2009 $2022 $2048 (4H chart)
Support levels: $1986 $1965 $1931 (4H chart)
CRUDE WTI
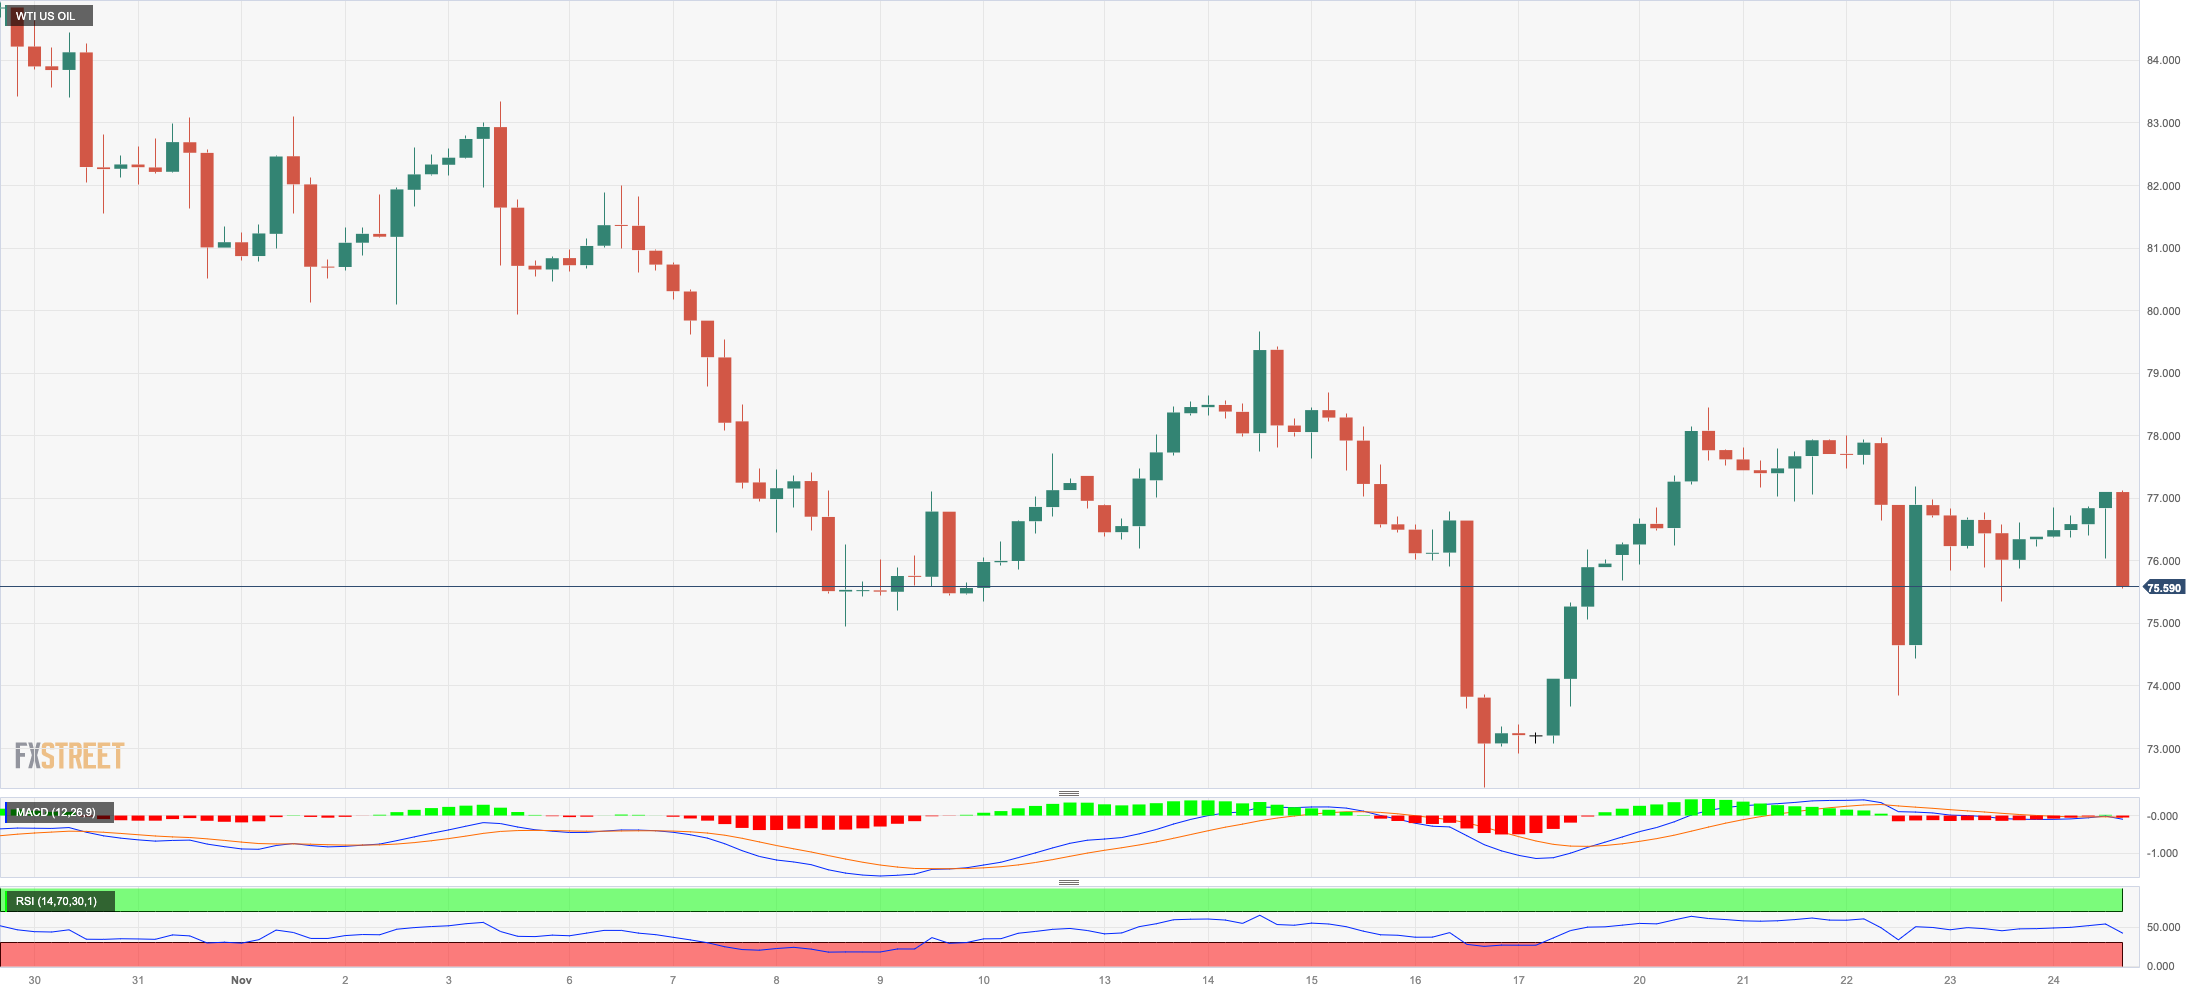
Prices of the American benchmark for sweet light crude oil remained well under pressure and receded to two-day lows near the $75.00 mark per barrel at the end of the week.
In the meantime, traders remained cautious ahead of the OPEC+ meeting on November 30 amidst rising speculation over the continuation (or not) of oil output cuts by the cartel in the next few months.
Other drivers behind the recent crude oil dynamics remain the likelihood of further stimulus in China, the increasing US crude oil production, the larger-than-expected weekly supplies (reported by the EIA on Wednesday), and prospects for interest rate reductions by the Fed as soon as in the spring of 2024.
Further gains in WTI might hit the weekly high of $79.72 (November 14) before the November top of $80.15 (November 3). North from here emerges the provisional 55-day SMA of $84.26 followed by weekly peaks of $89.83 (October 18), $94.99 (September 28), and $97.65 (August 30, 2022), all of which are ahead of the psychological $100.00 threshold. On the flip side, the immediate support comes at the November low of $72.22 (November 16), prior to the critical $70.00 level per barrel and the 2023 low of $63.61 (May 4), all preceding the key $60.00 mark.
Resistance levels: $78.42 $81.49 $83.56 (4H chart)
Support levels: $73.77 $72.13 $70.18 (4H chart)
GER40
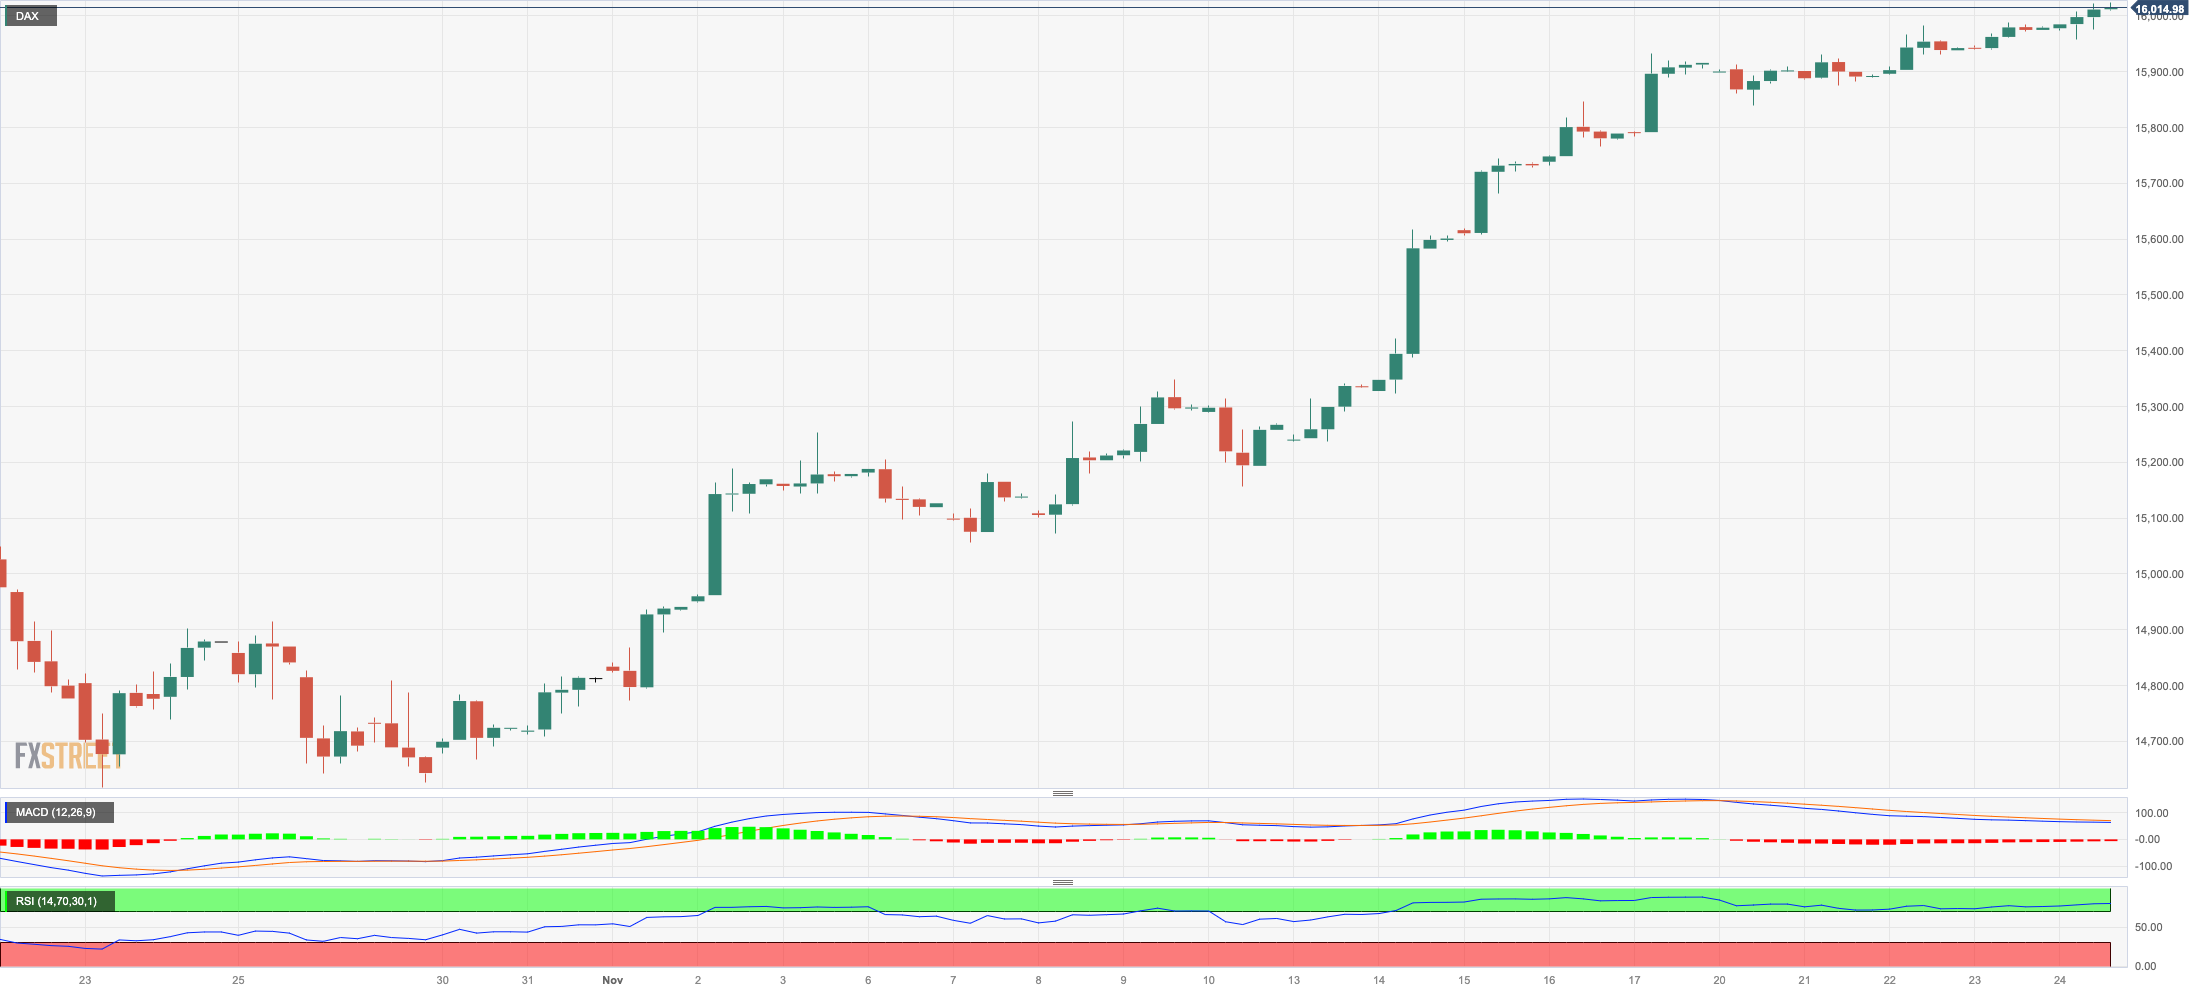
Germany’s reference DAX40 rose for the third consecutive session on Friday, this time extending the recent breakout of the key 16000 threshold.
Further gains in the index came on the back of the broad-based optimism among market participants and receding geopolitical concerns, all in combination with further indication that the ECB might keep its current monetary stance for the foreseeable future.
In addition, investors appear to have quickly shrugged off negative GDP readings for the July-September period, refocusing instead in the auspicious measures from the IFO institute.
The daily uptick in the index came in line with the small climb in the 10-year bund yields.
Next on the upside for the DAX40 comes the November high of 16041 (November 24), which almost coincides with the weekly top of 16042 (August 31) and comes just ahead of 16060 (August 10). Further up, the index should target the all-time peak of 16528 (July 31). By contrast, there is initial contention at the 200-day SMA at 15665 before the intermediate 55-day SMA at 15356. If this level is breached, the October low of 14630 (October 23) may be tried again before the March low of 14458 (March 20). The RSI surpassed 74 on a daily basis, suggesting that the market remained well overbought.
Best Performers: Covestro, Continental AG, Dr Ing hc F Porsche Prf
Worst Performers: SAP, Bayer, Deutsche Boerse
Resistance levels: 16041 16060 16528 (4H chart)
Support levels: 15419 15171 15068 (4H chart)
NASDAQ
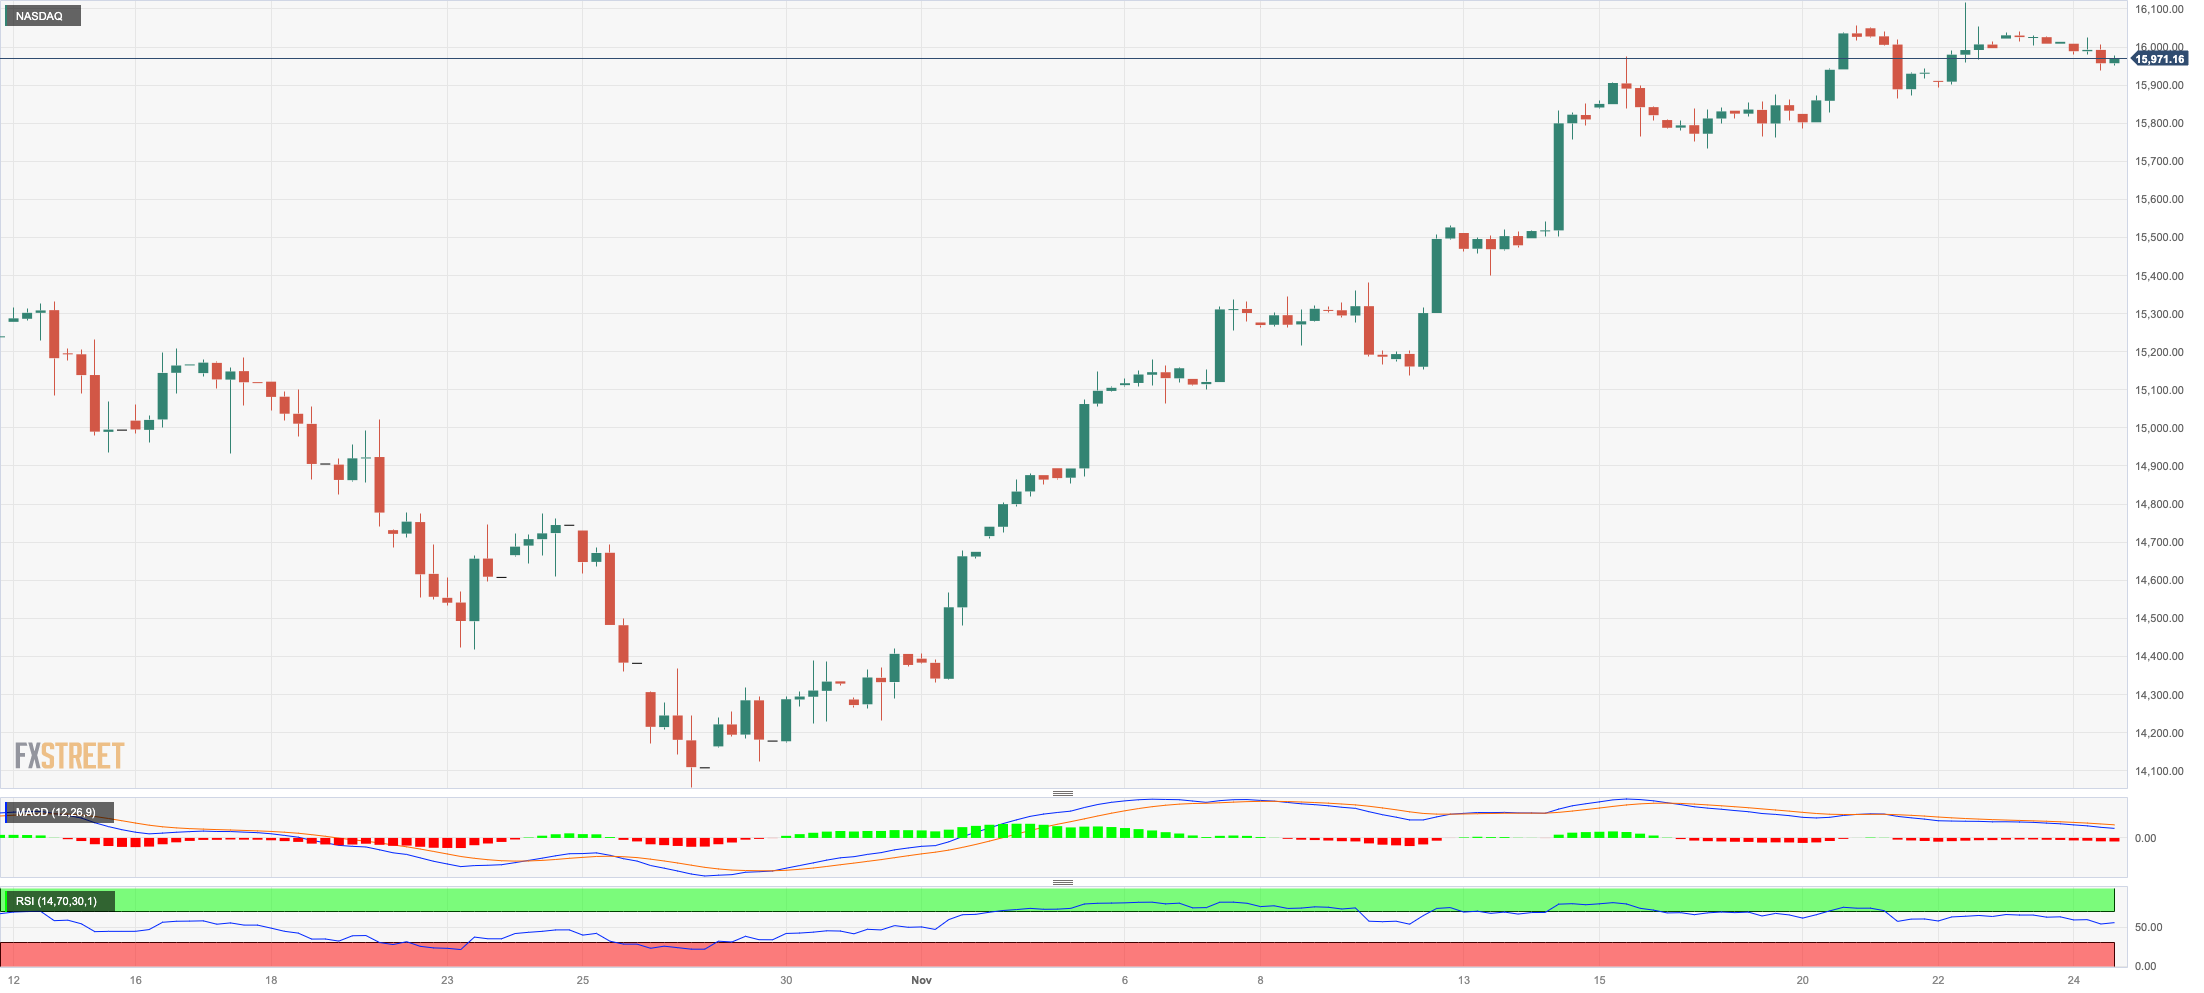
A small correction in the US tech sector saw the benchmark Nasdaq 100 retreat marginally to the sub-16000 zone at the end of the week.
Despite this knee-jerk, the index managed to clinch its fourth consecutive week of gains.
While the pronounced decline in the greenback helped the risk-link galaxy, higher US yields across the curve and the pullback in giant chipmaker NVIDIA played against the continuation of the uptrend in the Nasdaq 100.
Additional Nasdaq gains might take the index to the 2023 peak of 16119 (November 22) before the December 2021 high of 16607 (December 28) and the all-time top of 16764 (November 22 2021). Immediate support, on the other hand, looks to be in the region of the preliminary 55-day SMA of 15056, which is located ahead of the important 200-day SMA of 14232 and the October low of 14058 (October 26). Further losses might put the April bottom of 12724 (April 25) in jeopardy, ahead of the March low of 11695 (March 13) and the 2023 low of 10696 (January 3). The RSI moved slightly below the 69 level.
Top Gainers: DexCom, Warner Bros Discovery, JD.com Inc Adr
Top Losers: NVIDIA, Globalfoundries, Alphabet A
Resistance levels: 16119 16607 16764 (4H chart)
Support levels: 15168 14983 14058 (4H chart)
DOW JONES
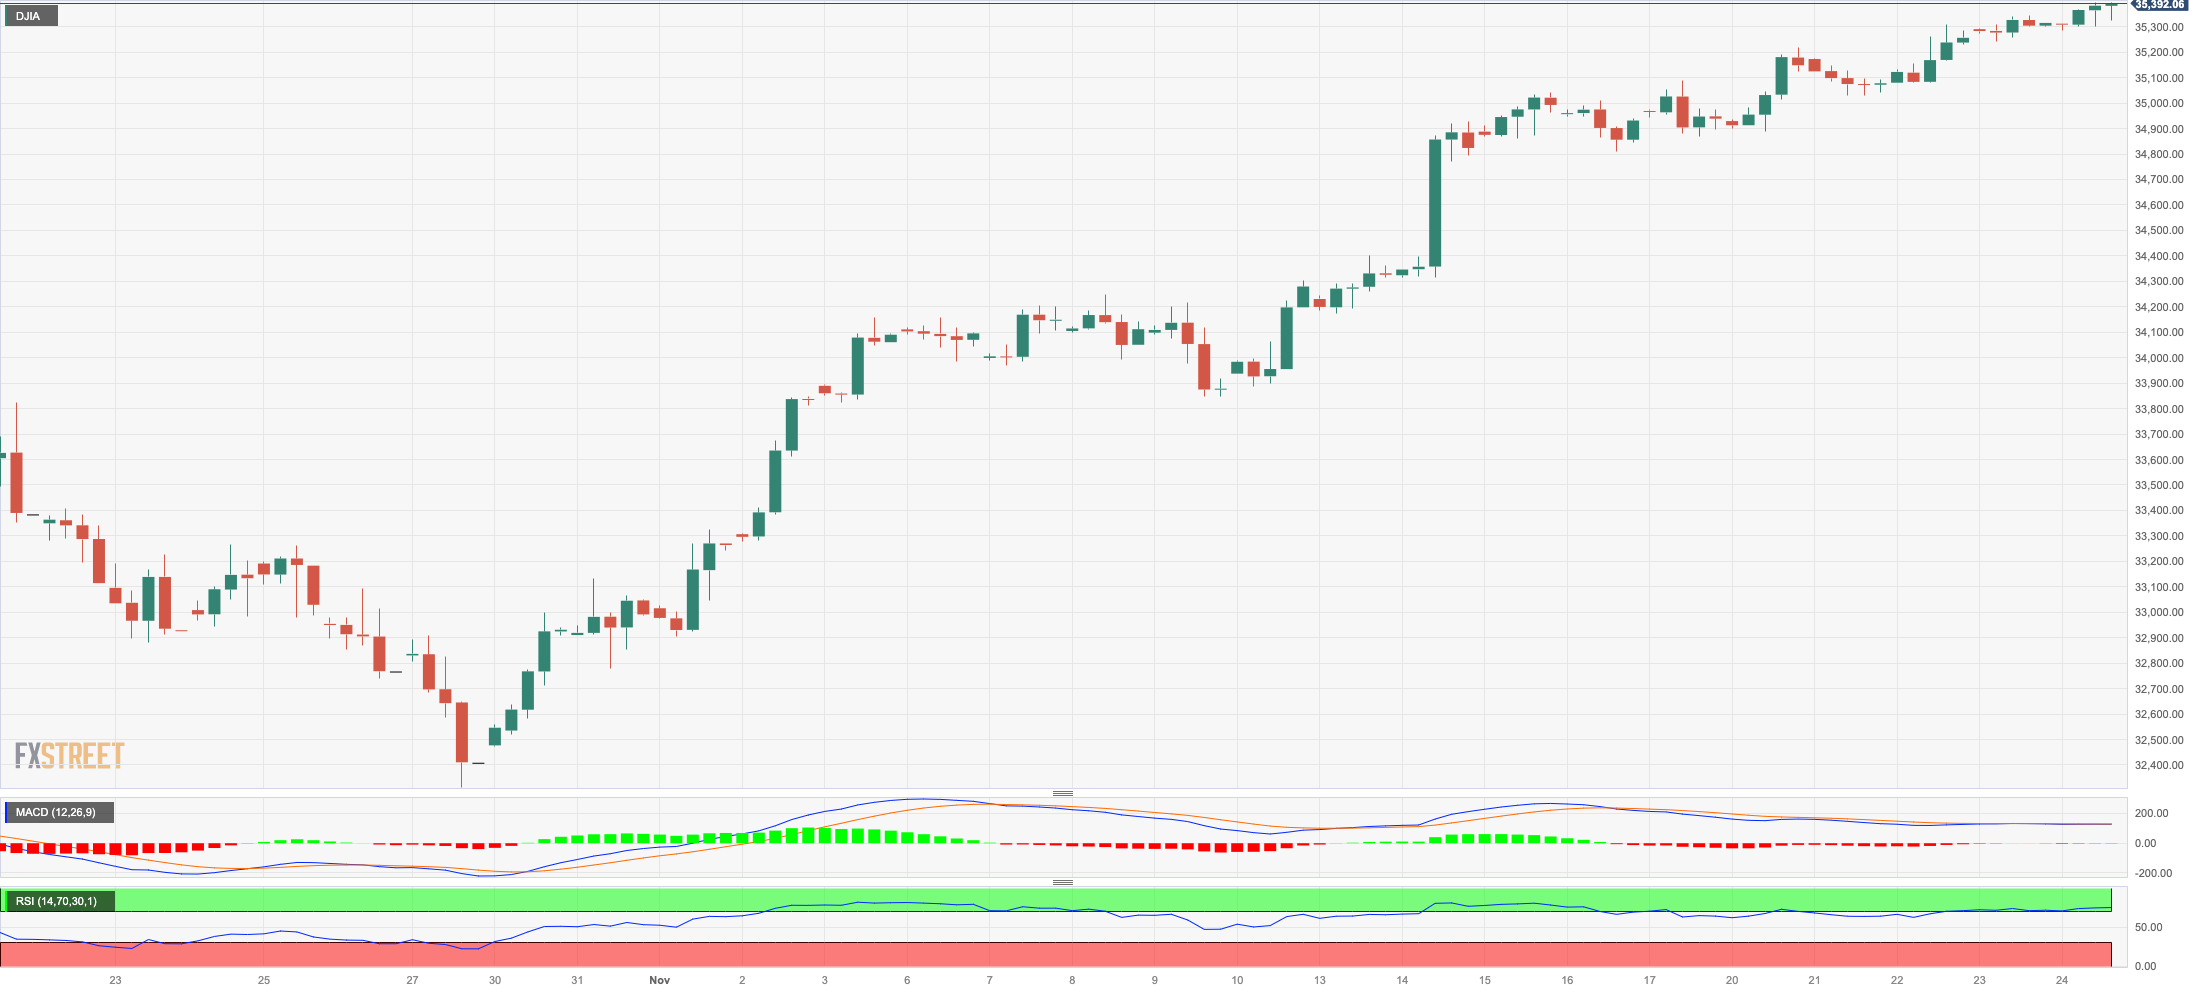
US equities returned to the markets in a positive fashion following the Thanksgiving Day holiday, lifting the key Dow Jones to the 35400 region for the first time since late August on Friday.
In a shortened trading session, stocks added to the recent upside amidst the broad-based appetite for the risk-associated assets, which was in turn bolstered by dwindling geopolitical effervescence and the persevering speculation about possible interest rate reductions by the Fed as soon as in the spring of 2024.
Adding to the upbeat mood also emerged auspicious prints from the US Services sector and a smaller-than-expected correction in the manufacturing sector, according to preliminary readings from S&P Global.
All in all, the Dow Jones rose 0.33% to 35390, the S&P500 gained 0.06% to 4559, and the tech-focused Nasdaq Composite eased 0.11% to 14250.
If the Dow Jones surpass the November high of 35399 (November 24), it could then confront the 2023 top of 35679 (August 1) prior to the all-time peak of 36952 (January 5, 2022). Just the opposite, the 200-day SMA is expected to provide contention at 33853, ahead of the October low of 32327 (October 27). The breakdown of the latter might pave the way for a decline to the 2023 low of 31429 (March 15), followed by a dip to the 2022 low of 28660 (October 13). The daily RSI entered the overbought zone beyond 72.
Top Performers: J&J, Walt Disney, Walmart
Worst Performers: Apple, Nike, Microsoft
Resistance levels: 35399 35578 35679 (4H chart)
Support levels: 34348 33859 33647 (4H chart)
MACROECONOMIC EVENTS
All Information & Updates provided by:

All information relating to the financial markets available on this page has been prepared and issued by FXStreet (Forexstreet SL, Spain, Reg: B62498233) on the basis of publicly available information and all information believed to be reliable and does not conflict with Kuwaiti local laws, and all necessary care has been taken to before the company to ensure that the facts mentioned are correct from the source.
NCM Investment nor any of its directors or employees shall in any way be held responsible for the contents of this news, and the information contained on this page is intended only to provide clients with publicly available information and should not be construed as investment advice, report or analysis and/or constitute an offer or invitation to buy or sell financial instruments of any kind.
RISK WARNING: Forex and CFDs are highly risky leveraged products, as losses can exceed deposits. Please ensure you understand all the risks and take independent advice if necessary. NCM will segregate the clients based on the criteria of the regulator and its bylaws. NCM does not provide any advisory service; the material published does not constitute advice or a recommendation for a transaction in any financial instrument. NCM accepts no responsibility for any use of the content presented and any consequences of that use. Anyone acting on the information provided does so at their own risk.