
- Contact Us:
-

-

-

-


Daily Market Updates
28 Nov 2023
USDJPY
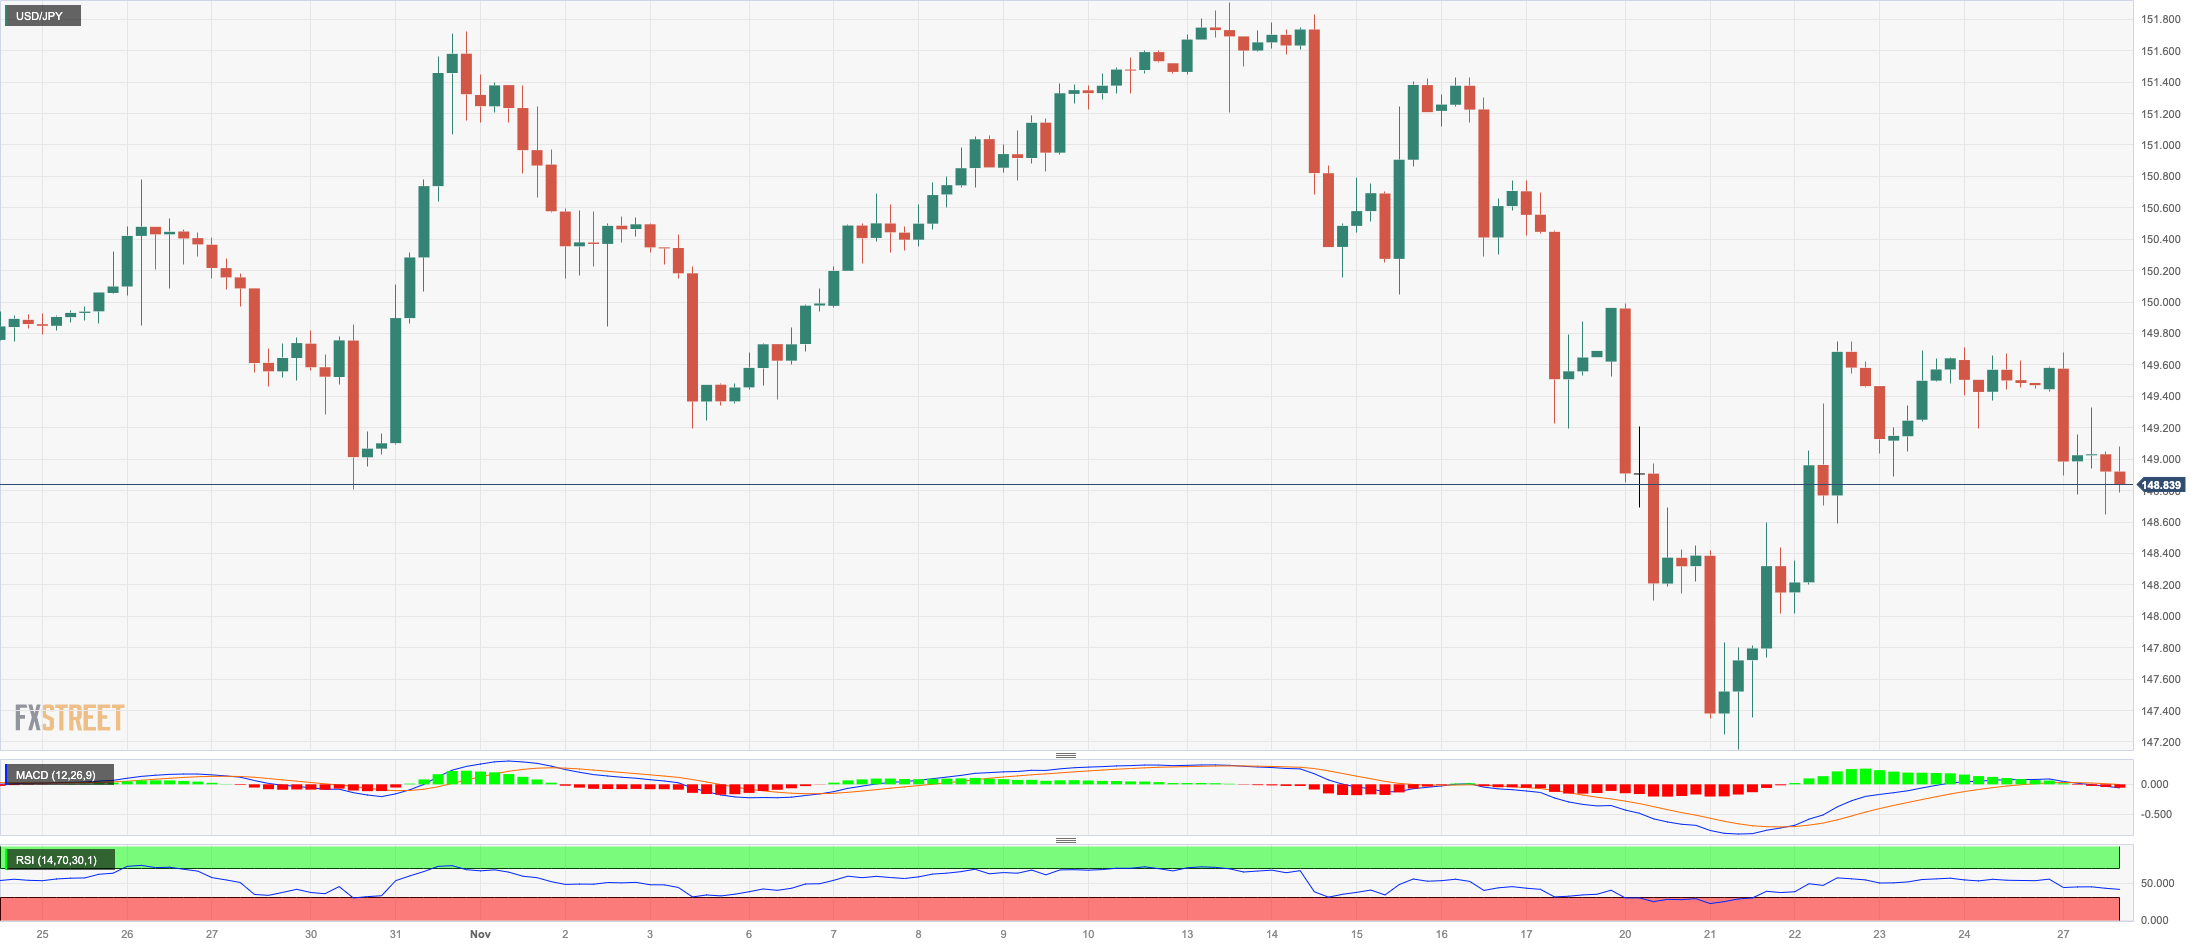
USD/JPY added to Friday’s small pullback and retreated markedly to three-day lows in the 148.70/65 band at the beginning of the week.
Indeed, the vacillating price action in the greenback, coupled with the strong retracement in US yields across different maturities, accompanied the pair on Monday.
In Japan, the JGB 10-year yields rose for the third session in a row, approaching the key 0.80% level.
From the BoJ, Governor K. Ueda stated that Japan's economy was experiencing a moderate recovery and expressed a lack of sufficient assurance regarding the attainment of the price goal. He noted some positive signs in wages and inflation but highlighted the high uncertainty surrounding the strengthening of this cycle.
If USD/JPY falls further, it might test the November low of 147.15 (November 21), which is just ahead of the preliminary 100-day SMA at 146.80, as well as the weekly low of 145.89 (September 11) and the September bottom of 144.43 (September 1). Beyond that, there are no notable support levels until the August low of 141.50 (August 7), which appears to be reinforced by the vicinity of the crucial 200-day SMA (141.83) and comes ahead of the July low of 137.23 (July 14). Bulls, instead, should aim to retest the 2023 high of 151.90 (November 13), closely followed by the 2022 top of 151.94 (October 21) and the 152.00 round figure. The RSI grinded lower to the sub-45 zone.
Resistance levels: 149.74 150.00 151.42 (4H chart)
Support levels: 148.65 147.15 145.89 (4H chart)
GBPUSD
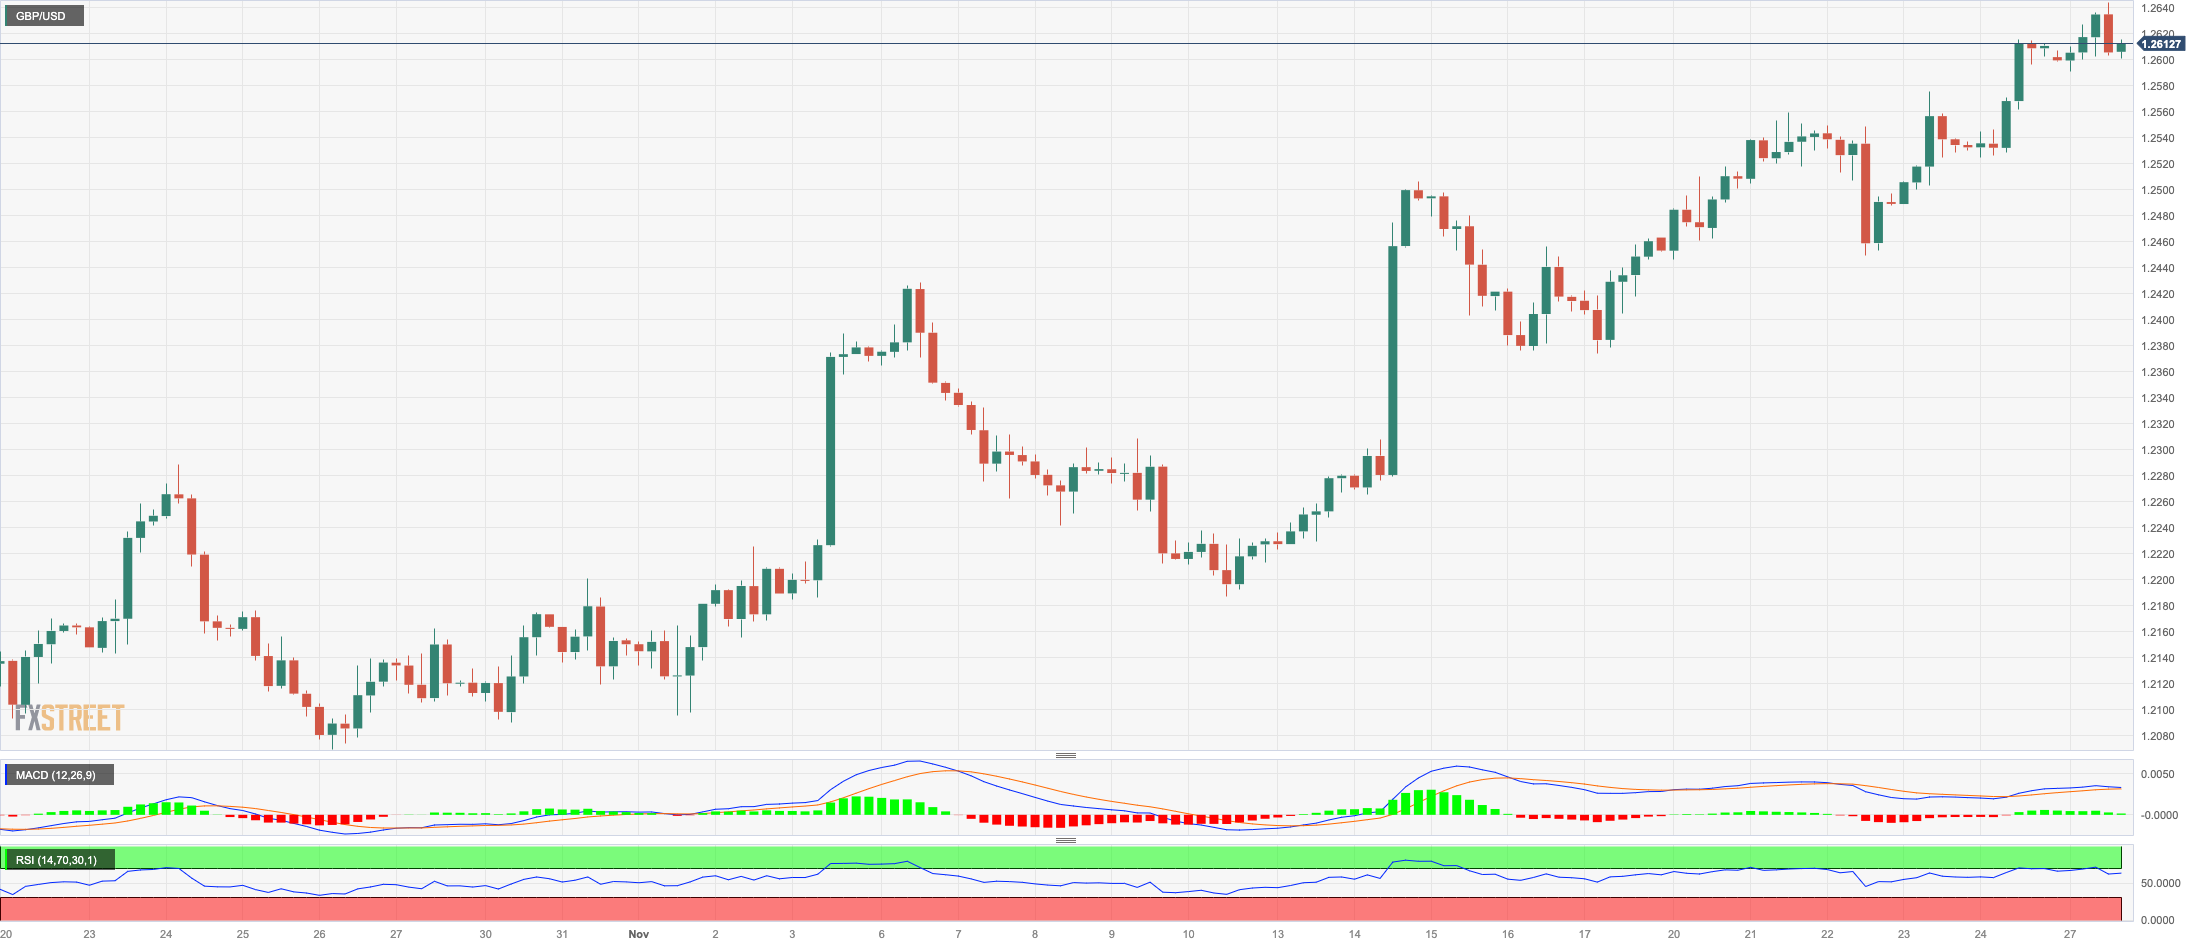
Further gains in the British pound bolstered the third consecutive session with gains in GBP/USD, this time revisiting levels past 1.2600 the figure for the first time since early September.
The flattish performance of the US dollar propped up further the ongoing upside bias in Cable, while comments from BoE’s Bailey pushed further back expectations of monetary easing, which morphed into added strength for the quid.
On the latter, Bailey said that bringing inflation down to 2% would be challenging and expressed that it was too early to discuss reducing rates. Additionally, Bailey mentioned being concerned about the slowdown on the supply side of the economy.
In the UK, CBI Distributive Trades improved to -11 for the current month (from -36).
GBP/USD reached a new high of 1.2644 on November 27. The breakout of this level opens the door to weekly tops of 1.2746 (August 30), 1.2818 on (August 10), and 1.2995 (July 27), all before the crucial 1.3000 barrier. In contrast, the critical 200-day SMA at 1.2457 is projected to provide initial contention prior to the intermediate 55-day SMA of 1.2282. From here, the weekly low of 1.2187 (November 10) is aligned, seconded by weekly lows of 1.2069 (October 26) and 1.2037 (October 3), all before the critical 1.2000 level and the 2023 low of 1.1802 (March 8). For the day, the RSI climbed to the boundaries of 68.
Resistance levels: 1.2644 1.2746 1.2800 (4H chart)
Support levels: 1.2448 1.2373 1.2286 (4H chart)
AUDUSD
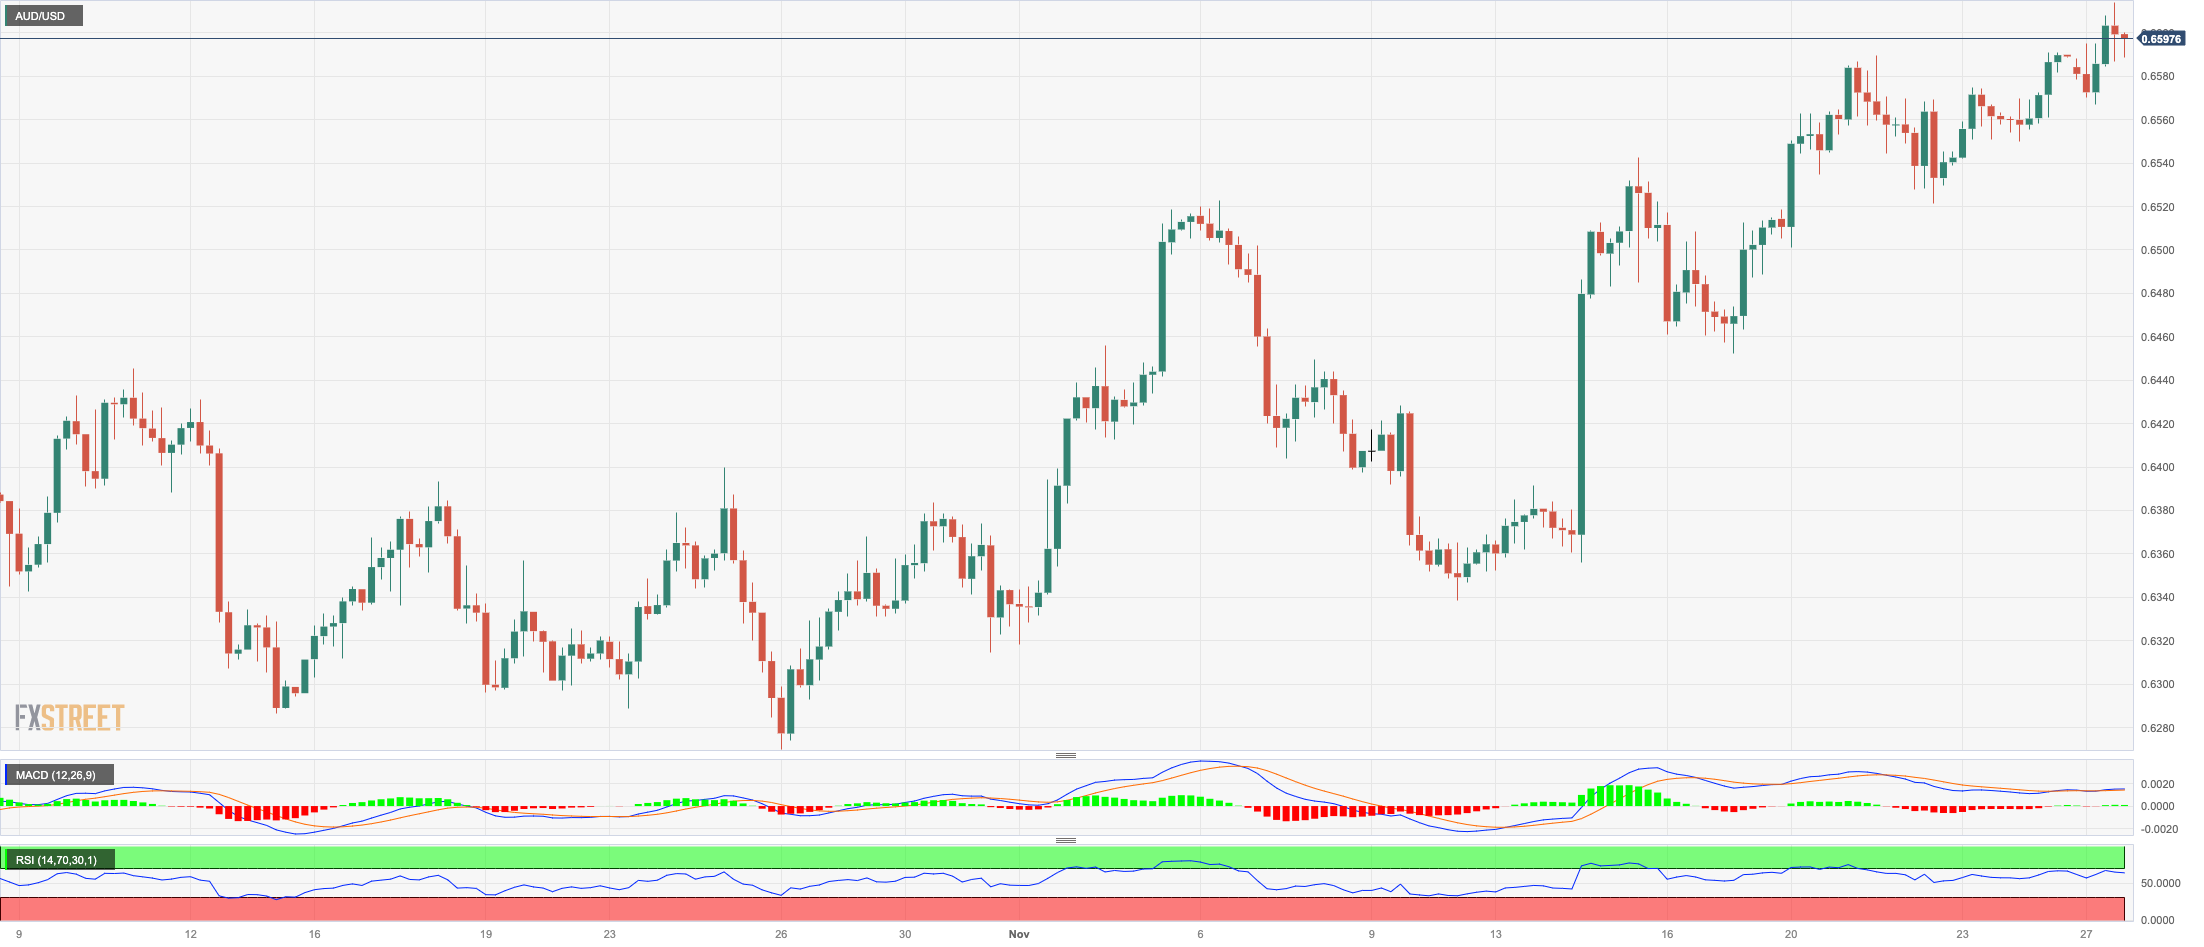
AUD/USD advanced further and managed to break above the 0.6600 barrier for the first time since August.
The lack of a clear direction in the greenback seems to have been the sole driver behind the continuation of the upside momentum in the Aussie dollar, while extra gains in iron ore also contributed to the move higher despite the generalized bearish tone in the commodity universe.
There were no data releases scheduled in Oz on Monday, leaving all attention to Tuesday’s publication of advanced Retail Sales for the month of October.
The November high of 0.6614 is immediately on the upside for AUD/USD (November 27). The breakout of this level might reintroduce a challenge of the weekly top of 0.6616 (August 10) before the July peak of 0.6894 (July 14). The June high of 0.6899 (June 16) aligns north from here, right before the critical 0.7000 level. The 55-day SMA at 0.6413, on the other hand, provides temporary support ahead of the 2023 bottom of 0.6270 (October 26). If this area fails, the pair is likely to slip back to 0.6200, just ahead of the 2022 bottom of 0.6169 (October 13). The daily RSI rose past the 65 mark.
Resistance levels: 0.6614 0.6739 0.6821 (4H chart)
Support levels: 0.6521 0.6452 0.6416 (4H chart)
GOLD
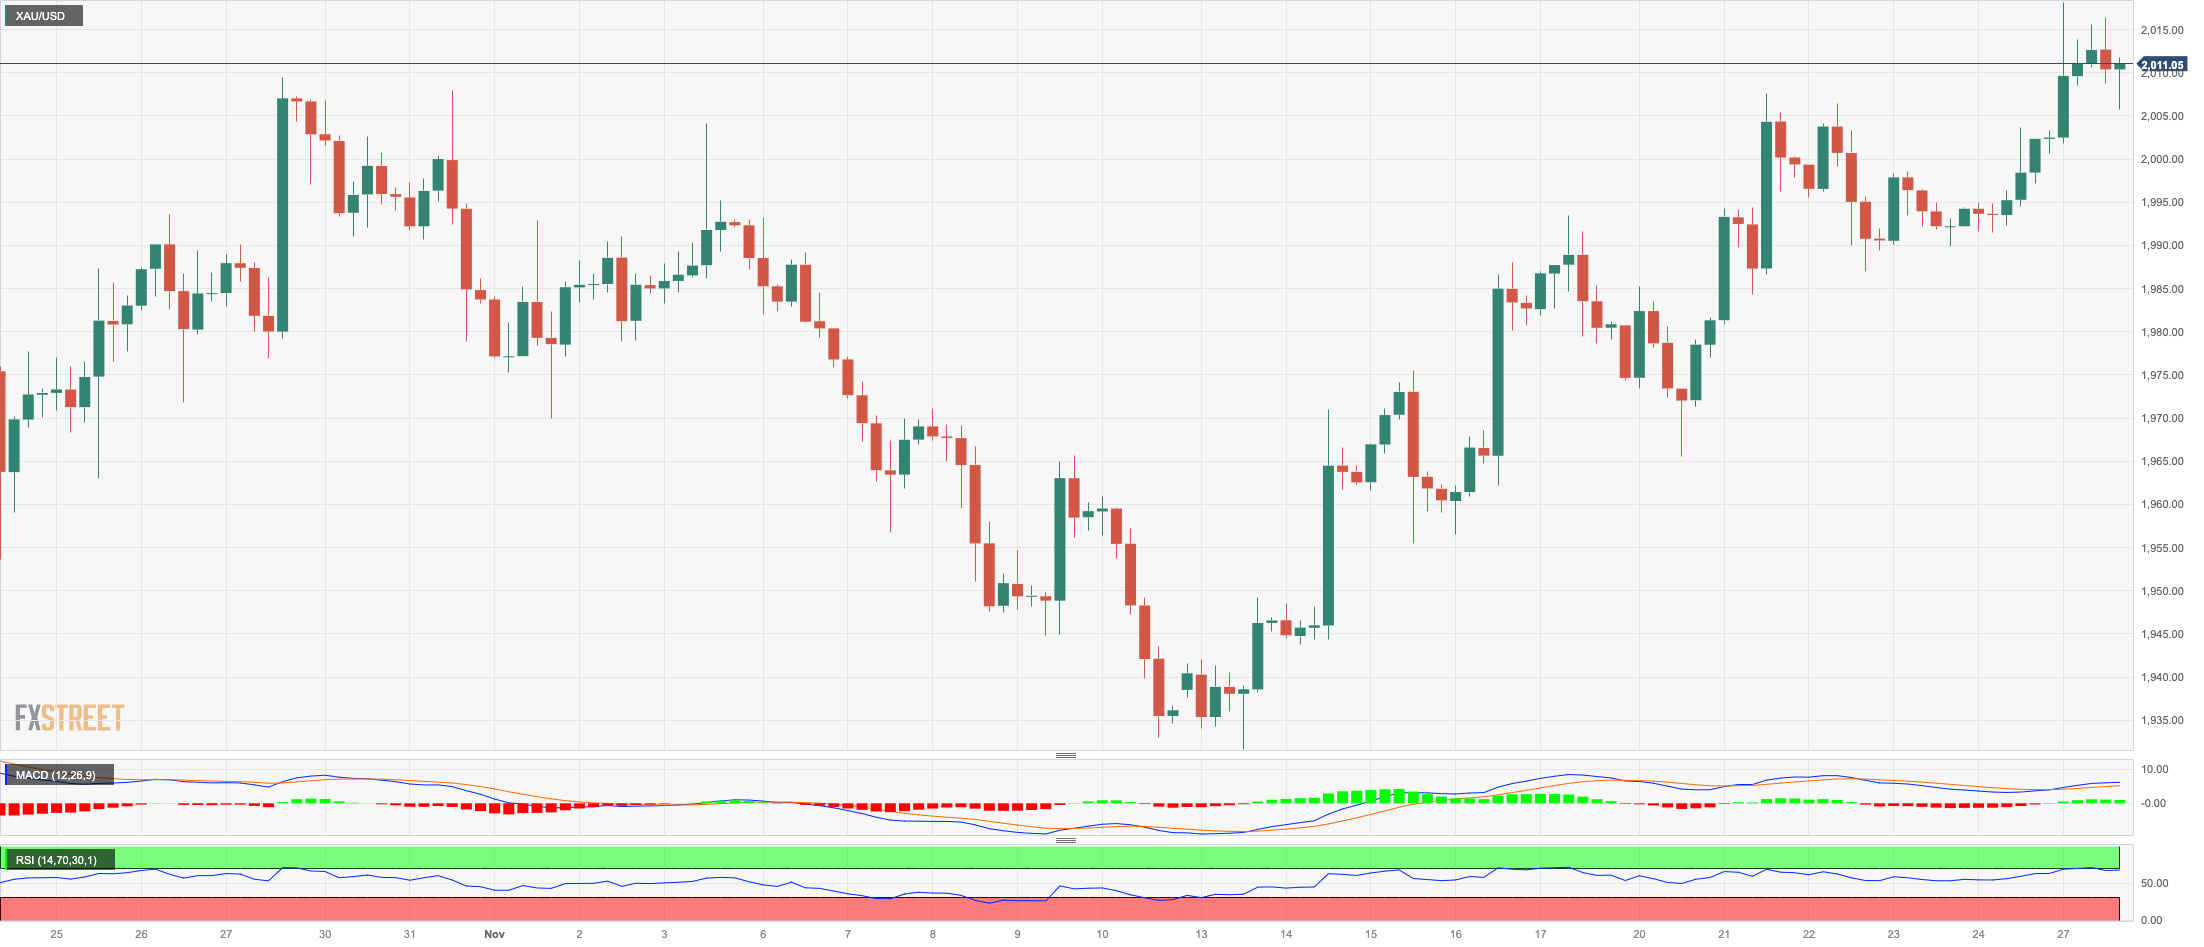
Gold prices edged further up on Monday, clinching new monthly highs in the proximity of the $2020 level, starting at the same time its third consecutive week of gains.
The promising start of the week for the yellow metal came on the back of the absence of a clear direction in the buck, while the pronounced pullback in US yields across the curve also provided extra legs for the non-yielder asset.
Moving forward, bullion is expected to keep monitoring upcoming data releases in the US docket as well as comments from the Fed’s rate setters, including Chief Powell, towards the end of the week.
The next upward hurdle for gold is the November high of $2018 (November 27). If this level is cleared, the 2023 top of $2067 (May 4) and the 2022 peak of $2070 (March 8) may be challenged before the all-time high of $2075 (August 7, 2020). Occasional bearish attempts could drag the precious metal to the November low of $1931 (November 13), which looks to be supported by the preliminary 55-day SMA ($1934). Once this level has been breached, a potential test the October low of $1810 (October 6) could emerge on the horizon seconded by the 2023 bottom of $1804 (February 28) and the big conflict region of $1800.
Resistance levels: $2018 $2022 $2048 (4H chart)
Support levels: $1986 $1965 $1955 (4H chart)
CRUDE WTI
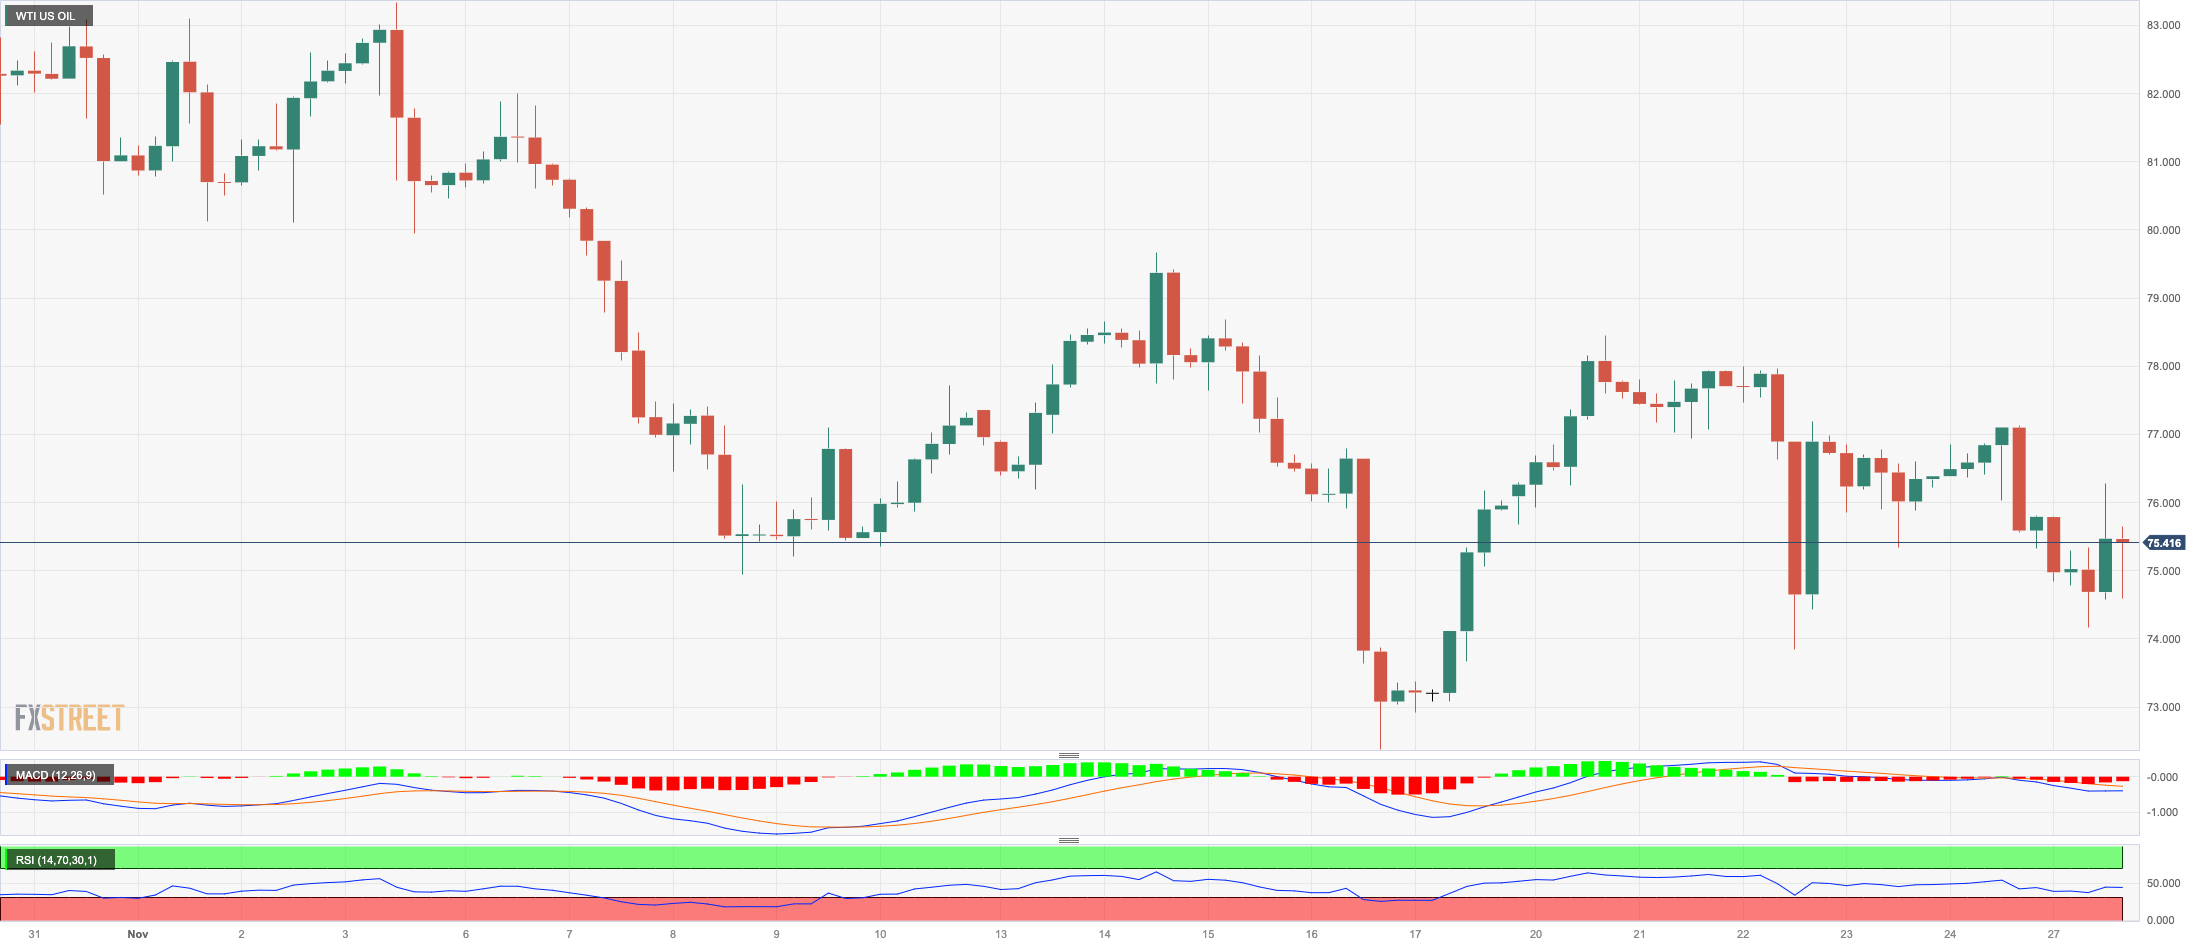
WTI prices extended the bearish mood and dropped for the fourth session in a row on Monday, this time breaking below the $75.00 mark per barrel.
The continuation of the selling pressure around crude oil came pari passu with rising traders’ prudence ahead of the postponed OPEC+ meeting on November 30, where probable extra oil output cuts by Saudi Arabia are expected to take centre stage.
In addition, key data releases in China (PMIs), Europe (CPI figures), and the US (GDP and PCE readings) are also predicted to impact crude oil dynamics, along with the usual weekly reports on US crude oil supplies and production by the API (Tuesday) and the EIA (Wednesday).
Further WTI losses might reach the November low of $72.22 (November 16), before to the important $70.00 level per barrel, and the 2023 low of $63.61 (May 4), all of which precede the critical $60.00 mark. Having said that, the next up-barrier comes at the 200-day SMA at $78.06 prior to the weekly high of $79.72 (November 14) and the November top of $80.15 (November 3). North from here emerges the preliminary 55-day SMA of $84.00 ahead of the weekly peaks of $89.83 (October 18), $94.99 (September 28), and $97.65 (August 30, 2022), all before the psychological $100.00 threshold.
Resistance levels: $78.42 $81.11 $83.56 (4H chart)
Support levels: $73.77 $72.13 $70.18 (4H chart)
GER40
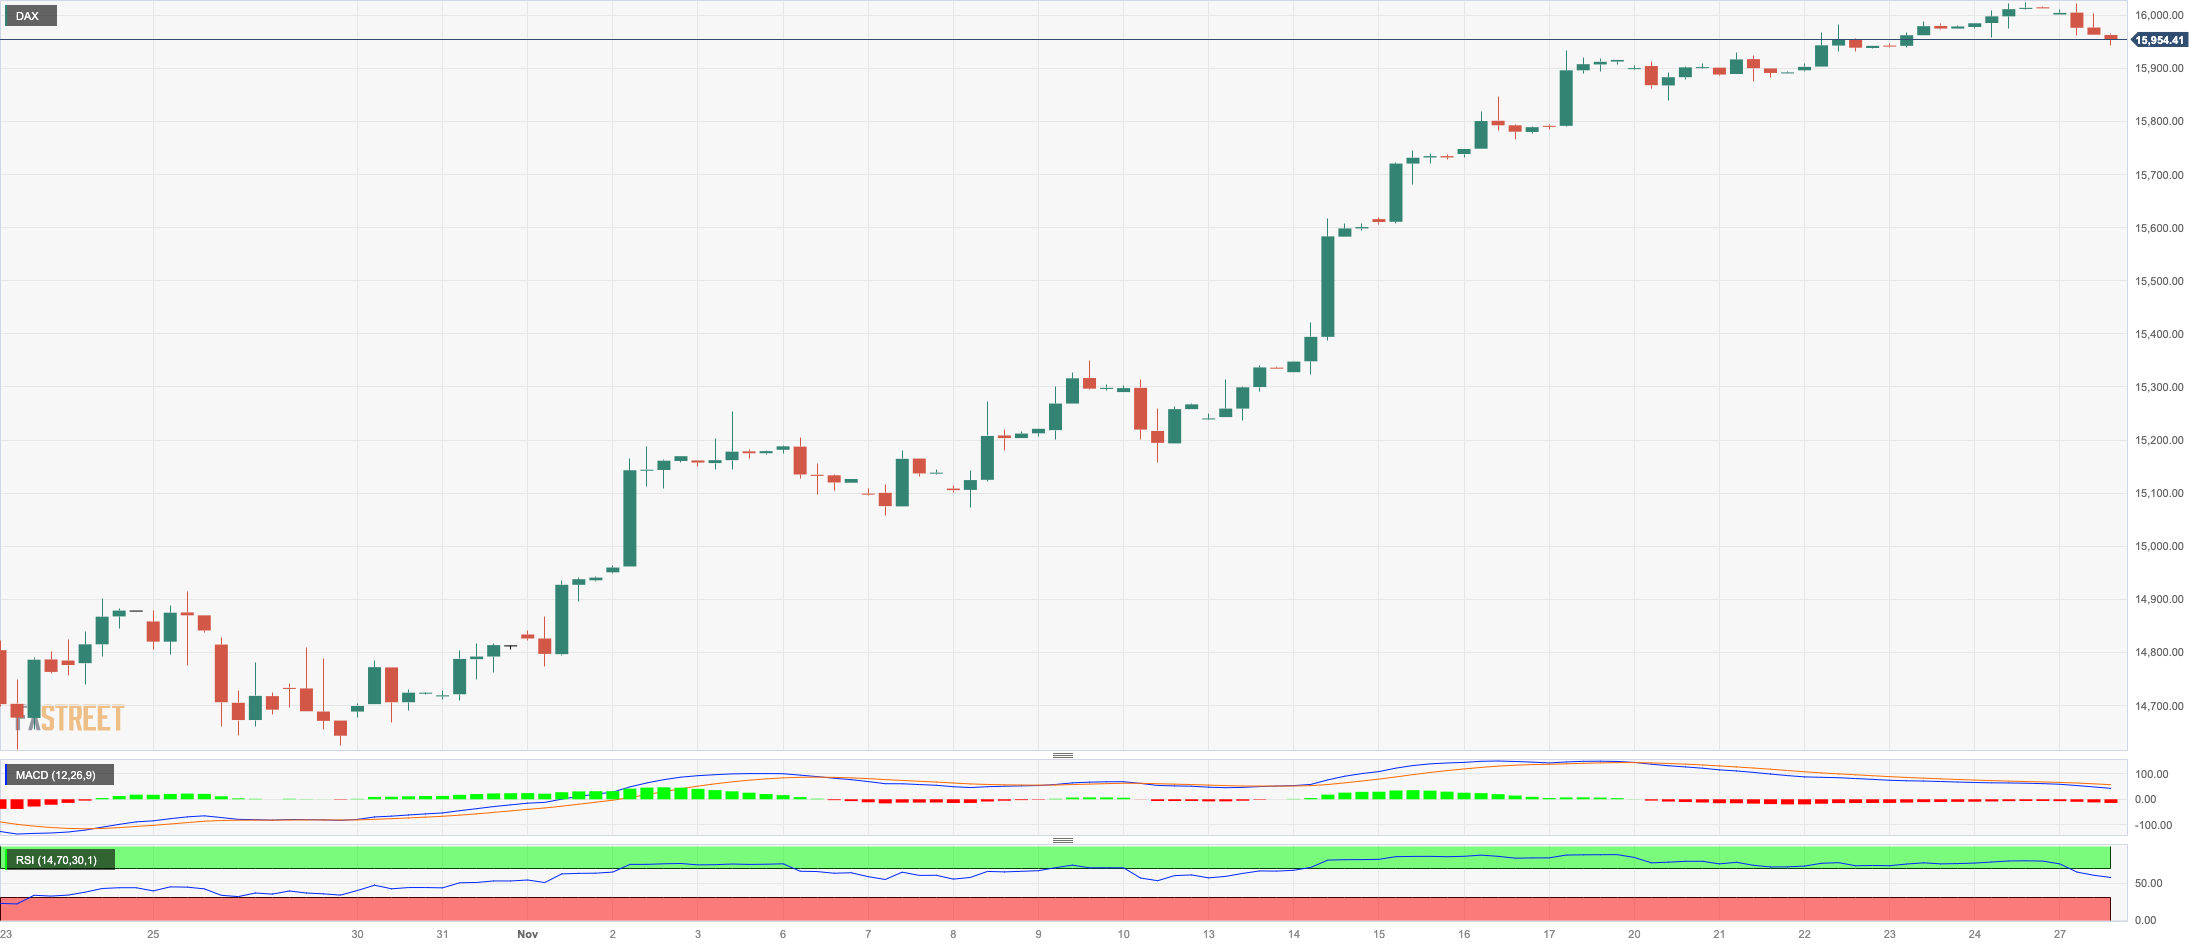
German equities tracked by the DAX40 reversed three consecutive daily advances and charted a decent knee-jerk on Monday, revisiting the sub-16000 region at the same time.
The negative session in the DAX40 fell in line with the broader losses in the rest of its European peers, all against the backdrop of increasing prudence prior to key releases in the euro bloc and the US.
In the meantime, investors continue to see the ECB entering a protracted pause until probably the spring of 2024, when it may start reducing its interest rates. So far, President C. Lagarde reiterated before the European Parliament on Monday that inflation is seen creeping higher in the next few months, while uncertainty keeps dominating the landscape around the economic outlook in the region.
In the German money markets, 10-year bund yields plummeted to the 2.55% zone, or three-day highs, all in line with their US counterparts.
The DAX40's next target is the November high of 16041 (November 24), which practically corresponds with the weekly high of 16042 (August 31) and is just ahead of another weekly top of 16060 (August 10). Further up, the index should aim for the all-time peak of 16528 (July 31). Just the opposite, there is early support at the 200-day SMA at 15668, which is ahead of the intermediate 55-day SMA at 15359. If this level is broken, the October low of 14630 (October 23) might be disputed again before the March low of 14458 (March 20). On a daily basis, the RSI eased to the 70 zone, still in the overbought territory.
Best Performers: Vonovia, Hannover Rueck SE, Fresenius SE
Worst Performers: Rheinmetall AG, BASF, Bayer
Resistance levels: 16041 16060 16528 (4H chart)
Support levels: 15568 15171 15068 (4H chart)
NASDAQ
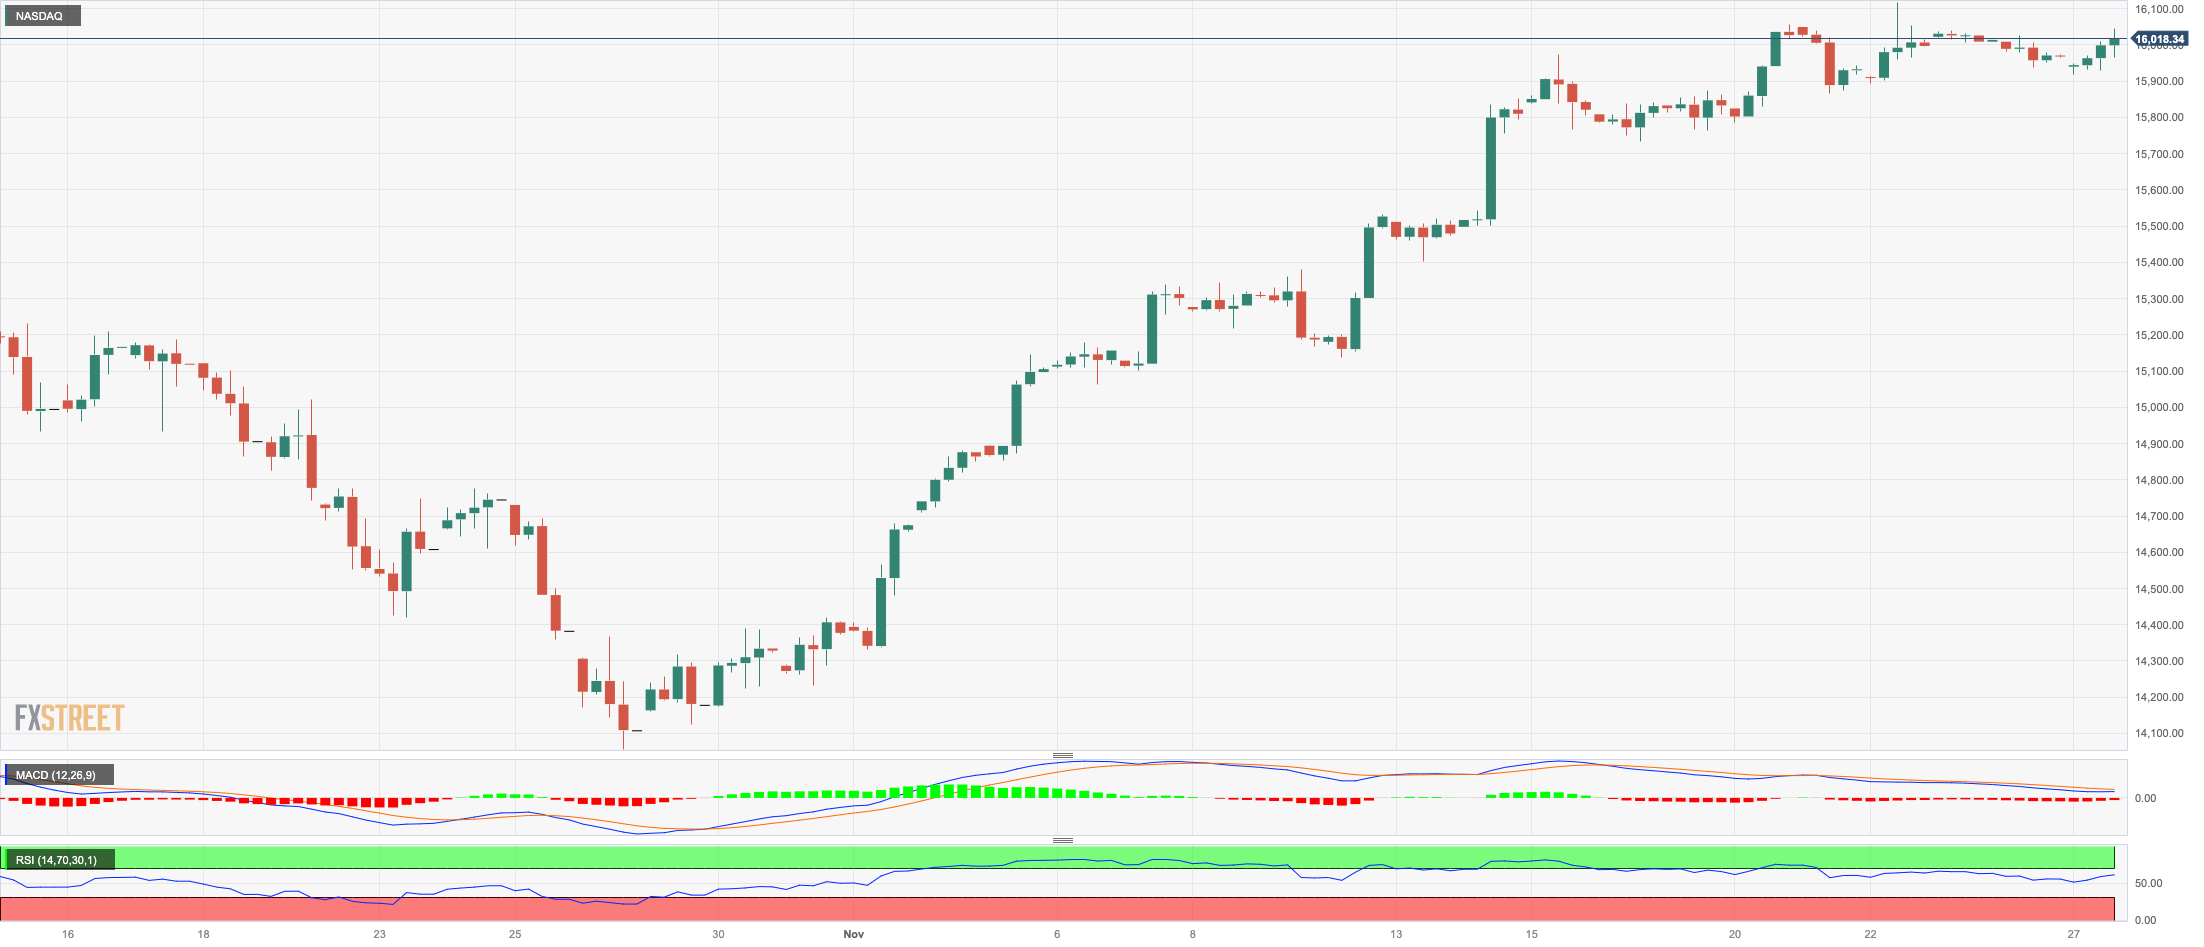
Unlike its US peers, the tech reference Nasdaq 100 edged higher and quickly left behind Friday’s small pullback, advancing once again beyond the 16000 threshold at the beginning of a new trading week.
The soft tone in the greenback and the marked pullback in US yields across the board lent extra wings to the index, while firmer expectations of interest rate cuts by the Fed in H1 2024 also added to the upbeat sentiment in tech equities.
Additional Nasdaq gains might propel the index to the 2023 peak of 16119 (November 22) before the December 2021 high of 16607 (December 28) and the all-time top of 16764 (November 22 2021). Immediate support, on the other hand, appears to be around the preliminary 55-day SMA of 15083, which is placed ahead of the critical 200-day SMA of 14267 and the October low of 14058 (October 26). Further losses might jeopardize the April bottom of 12724 (April 25), as well as the March low of 11695 (March 13) and the 2023 low of 10696 (January 3). The RSI advanced to the boundaries of the key 70 level.
Top Gainers: MercadoLibre, The Trade Desk, Lam Research
Top Losers: GE HealthCare, Walgreen Boots, Illumina
Resistance levels: 16119 16607 16764 (4H chart)
Support levels: 15171 15039 14058 (4H chart)
All Information & Updates provided by:

All information relating to the financial markets available on this page has been prepared and issued by FXStreet (Forexstreet SL, Spain, Reg: B62498233) on the basis of publicly available information and all information believed to be reliable and does not conflict with Kuwaiti local laws, and all necessary care has been taken to before the company to ensure that the facts mentioned are correct from the source.
NCM Investment nor any of its directors or employees shall in any way be held responsible for the contents of this news, and the information contained on this page is intended only to provide clients with publicly available information and should not be construed as investment advice, report or analysis and/or constitute an offer or invitation to buy or sell financial instruments of any kind.
RISK WARNING: Forex and CFDs are highly risky leveraged products, as losses can exceed deposits. Please ensure you understand all the risks and take independent advice if necessary. NCM will segregate the clients based on the criteria of the regulator and its bylaws. NCM does not provide any advisory service; the material published does not constitute advice or a recommendation for a transaction in any financial instrument. NCM accepts no responsibility for any use of the content presented and any consequences of that use. Anyone acting on the information provided does so at their own risk.