
- Contact Us:
-

-

-

-


Daily Market Updates
30 Nov 2023
USDJPY
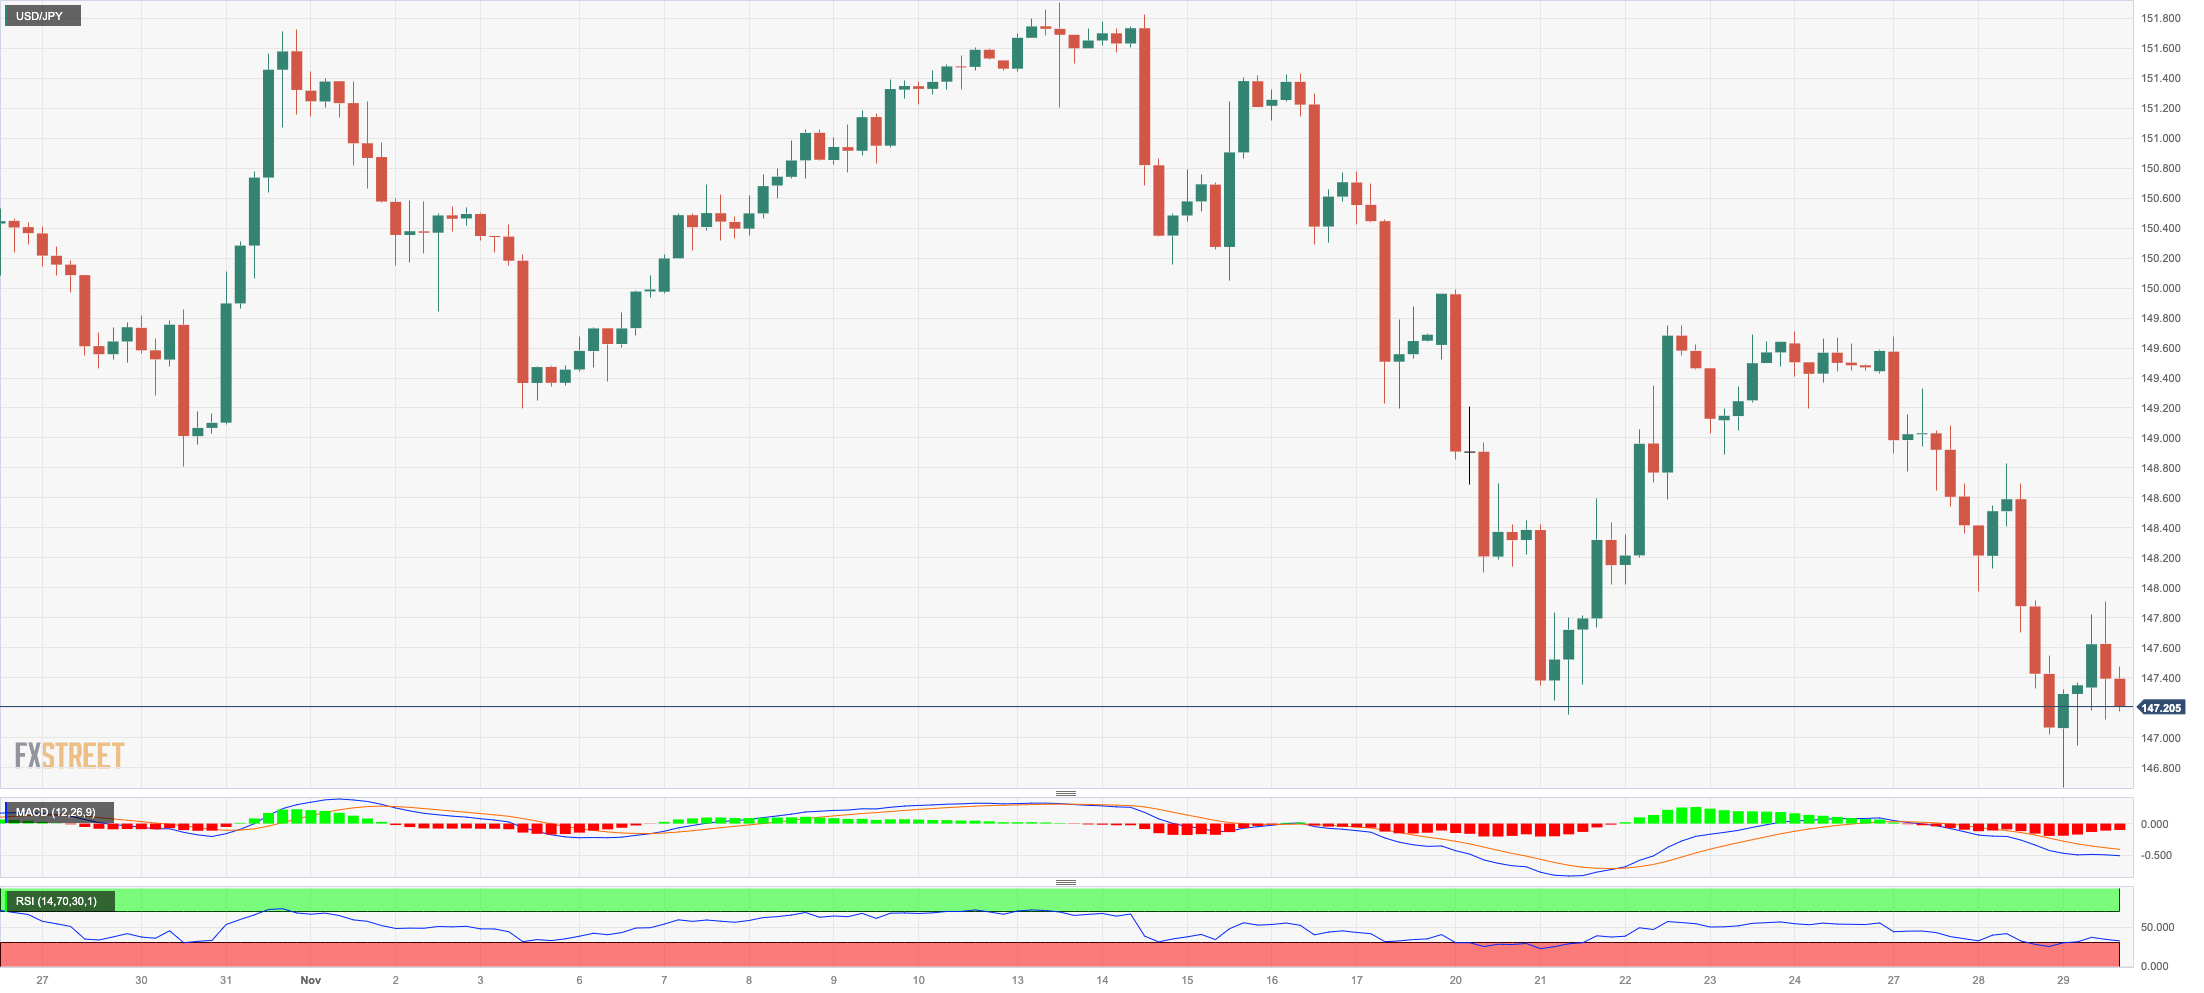
The selling pressure around USD/JPY remained unabated for yet another session on Wednesday.
Indeed, this time the pair slipped back to the 146.70 zone for the first time since mid-September in a context dominated by the strong demand for bonds and the persevering retracement in US and Japanese yields.
The above came pari passu with escalating speculation that the Fed might start trimming its interest rates early in 2024.
There were no data releases scheduled in Japan other than the speech by BoJ S. Adachi who said that waiting for a clear sign of sustained wage growth was necessary. He mentioned the possibility of needing to wait until the next fiscal year to assess the wage outlook. He emphasized that next year's wage negotiations were crucial for a significant policy decision. Adachi also highlighted that there was no consensus within the BoJ board regarding the timing of an easy policy exit.
If USD/JPY falls further, it might reach the November low of 146.67 (November 29), which is ahead of the September bottom of 144.43 (September 1). Beyond that, there are no discernible support levels until the key 200-day SMA at 141.95 prior to the August low of 141.50 (August 7) and the July low of 137.23 (July 14). Just the opposite, immediate resistance appears at the 2023 peak of 151.90 (November 13), followed by the 2022 high of 151.94 (October 21) and the 152.00 round number. The RSI retreated to the 36 zone.
Resistance levels: 149.74 149.91 151.42 (4H chart)
Support levels: 146.67 145.89 144.43 (4H chart)
GBPUSD
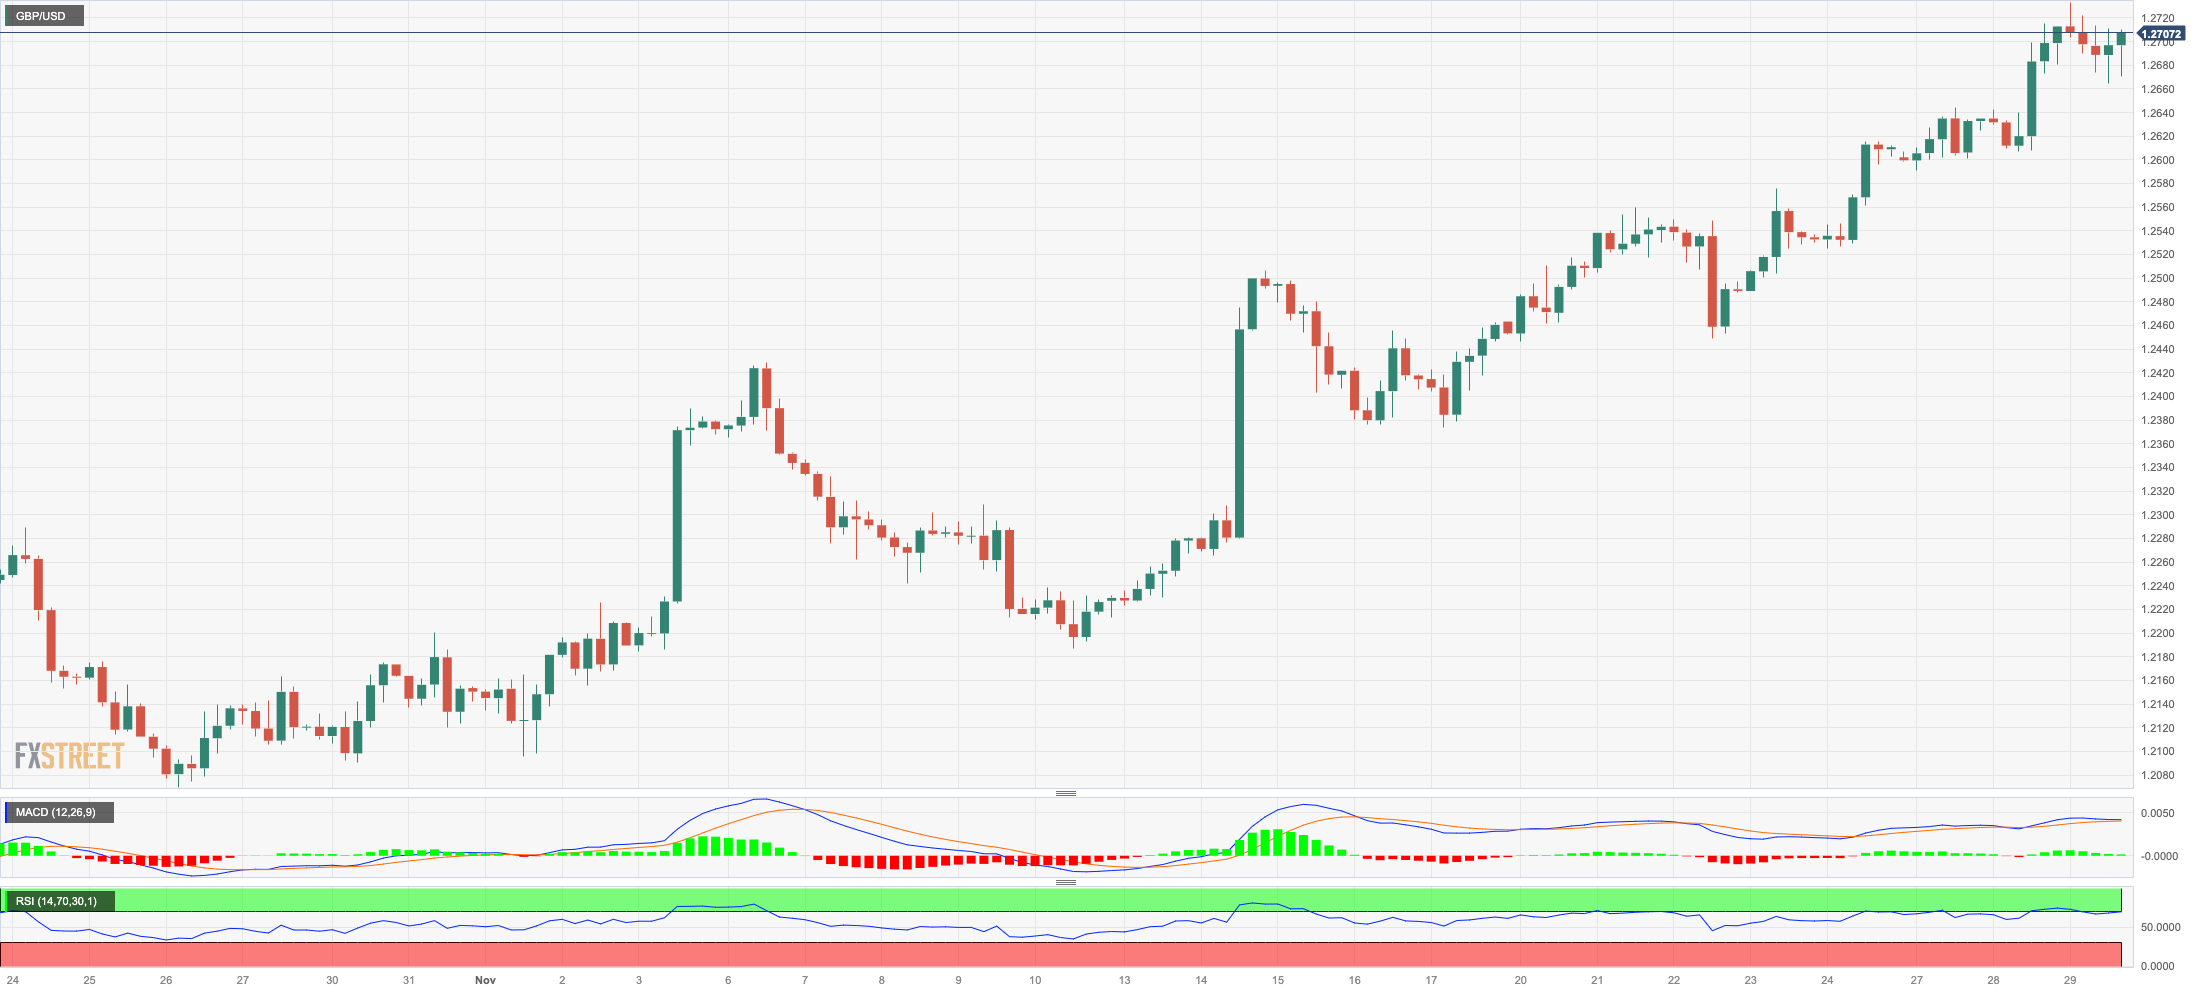
GBP/USD charted an inconclusive session and returned to the 1.2700 zone following an auspicious early move to the 1.2730/35 band, or new three-month peaks.
Despite the vacillating price action, Cable managed to keep intact its monthly gains as well as the positive three-week streak on Wednesday.
In line with the rest of the global bond markets, UK yields retreated further and approached multi-session lows near the key 4.00% zone.
In the UK, Mortgage Approvals increased by 47.383K in October and Mortgage Lending contracted £0.05B in the same period.
The November high of 1.2733 (November 29) is the next up-barrier for GBP/USD. The surpass of this level opens the door to weekly tops of 1.2746 (August 30), 1.2818 (August 10), and 1.2995 (July 27), all of which occur before to the key 1.3000 yardstick. The crucial 200-day SMA at 1.2463, on the other hand, is projected to provide early resistance before the transitory 55-day SMA of 1.2290. From here, the weekly low of 1.2187 (November 10) is aligned south, seconded by weekly lows of 1.2069 (October 26) and 1.2037 (October 3), all before the key 1.2000 level and the 2023 low of 1.1802 (March 8). The RSI settled around the 72 level, still in the overbought territory.
Resistance levels: 1.2733 1.2746 1.2800 (4H chart)
Support levels: 1.2549 1.2448 1.2373 (4H chart)
AUDUSD
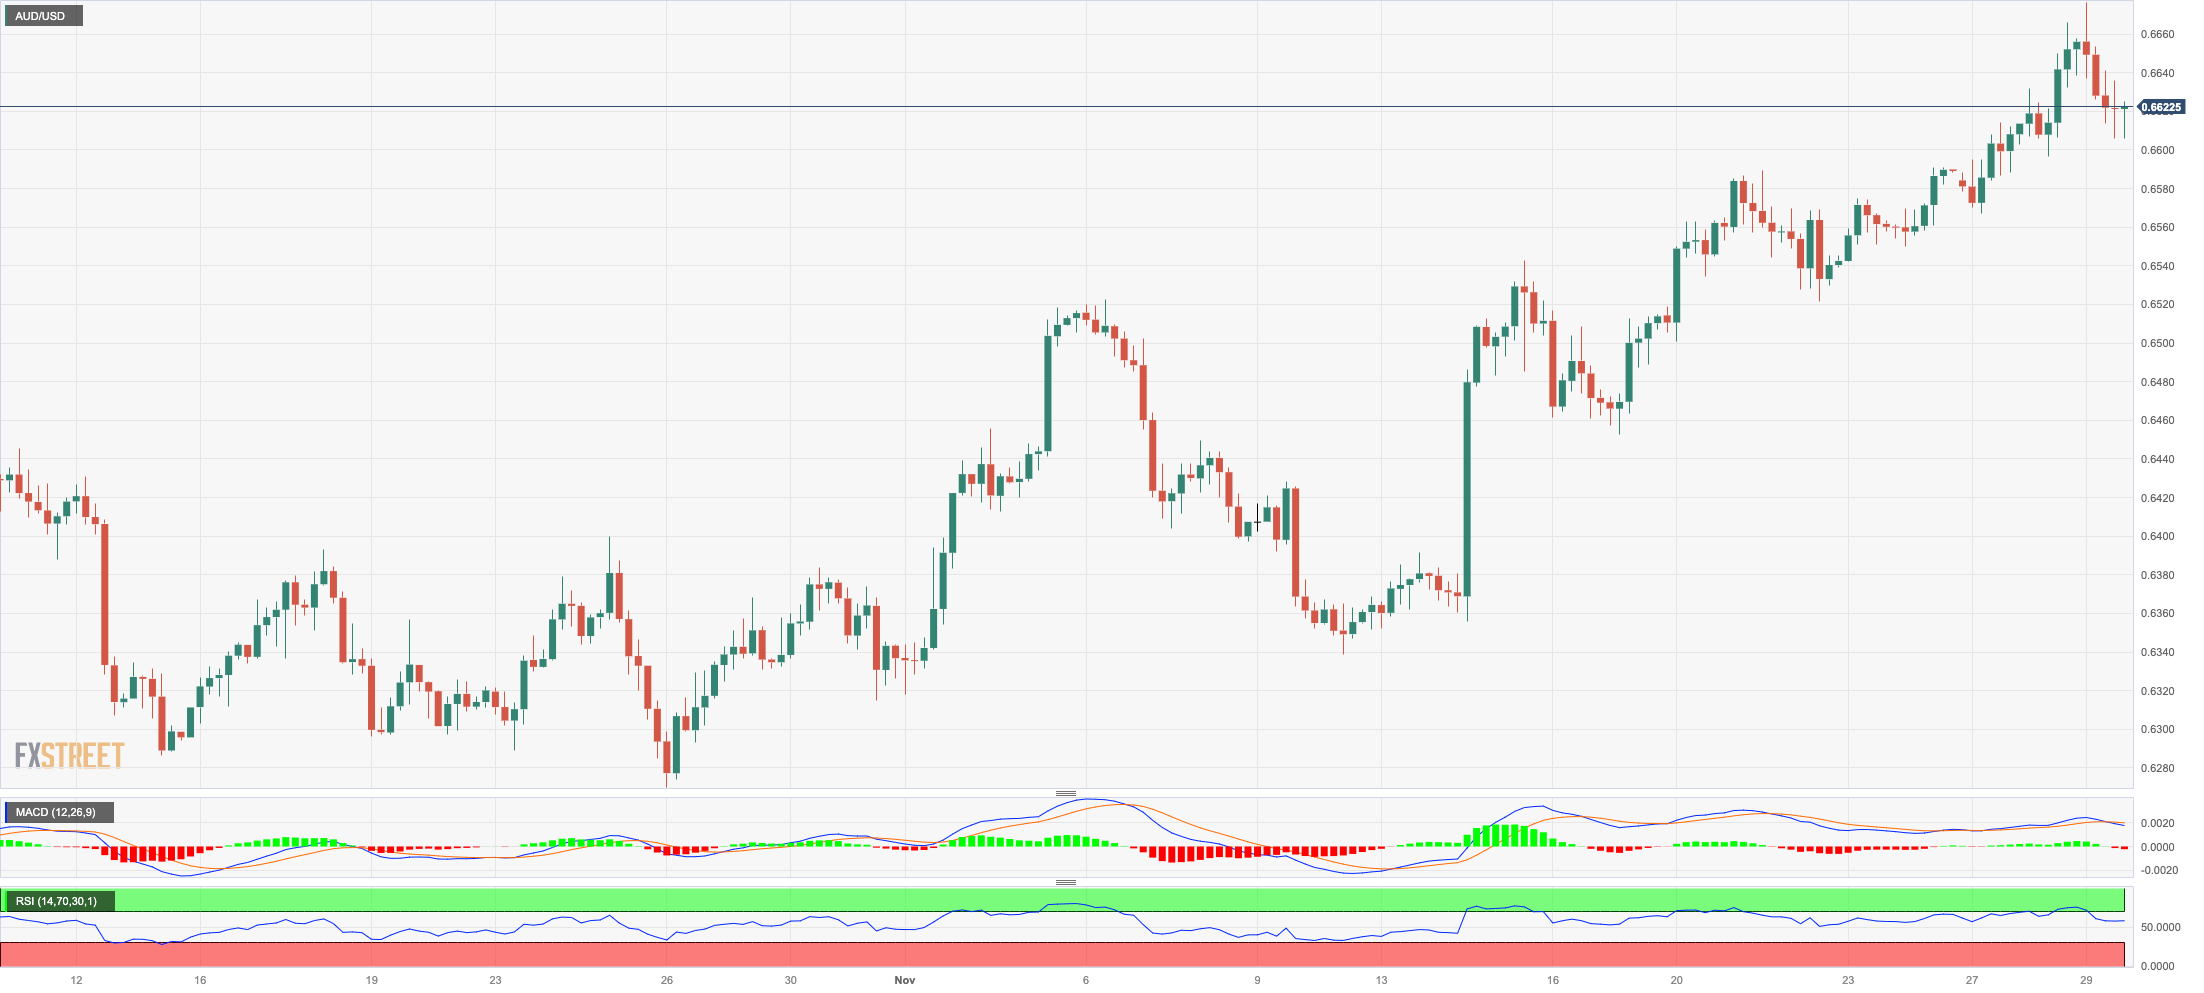
The decent recovery in the greenback and the generalized bearish tone in the risk-associated universe weighed on the Aussie dollar and forced AUD/USD to trade with marked losses near the 0.6600 neighbourhood.
In fact, the pair could not maintain the bull run to new highs near 0.6680 during early trade, eventually succumbing to the recovery in the greenback and the poor session in the commodity galaxy.
In Oz, the Monthly CPI Indicator eased to 4.9% in October (from 5.6%).
The November high of 0.6676 (November 29) is immediately on the upside for the AUD/USD. A breakout of this level might re-establish a challenge to the July top of 0.6894 (July 14). The June peak of 0.6899 (June 16) aligns north from here, right before the important 0.7000 level. Having said that, the key 200-day SMA at 0.6580 emerges as an important contention ahead of the temporary 55-day SMA at 0.6421. The loss of this level could pave the way for a move to the 2023 bottom of 0.6270 (October 26) 0.6200, ahead of the round level of 0.6200 and the 2022 low of 0.6169 (October 13). The day-to-day RSI grinded lower to sub-66 levels.
Resistance levels: 0.6676 0.6739 0.6821 (4H chart)
Support levels: 0.6565 0.6521 0.6452 (4H chart)
GOLD
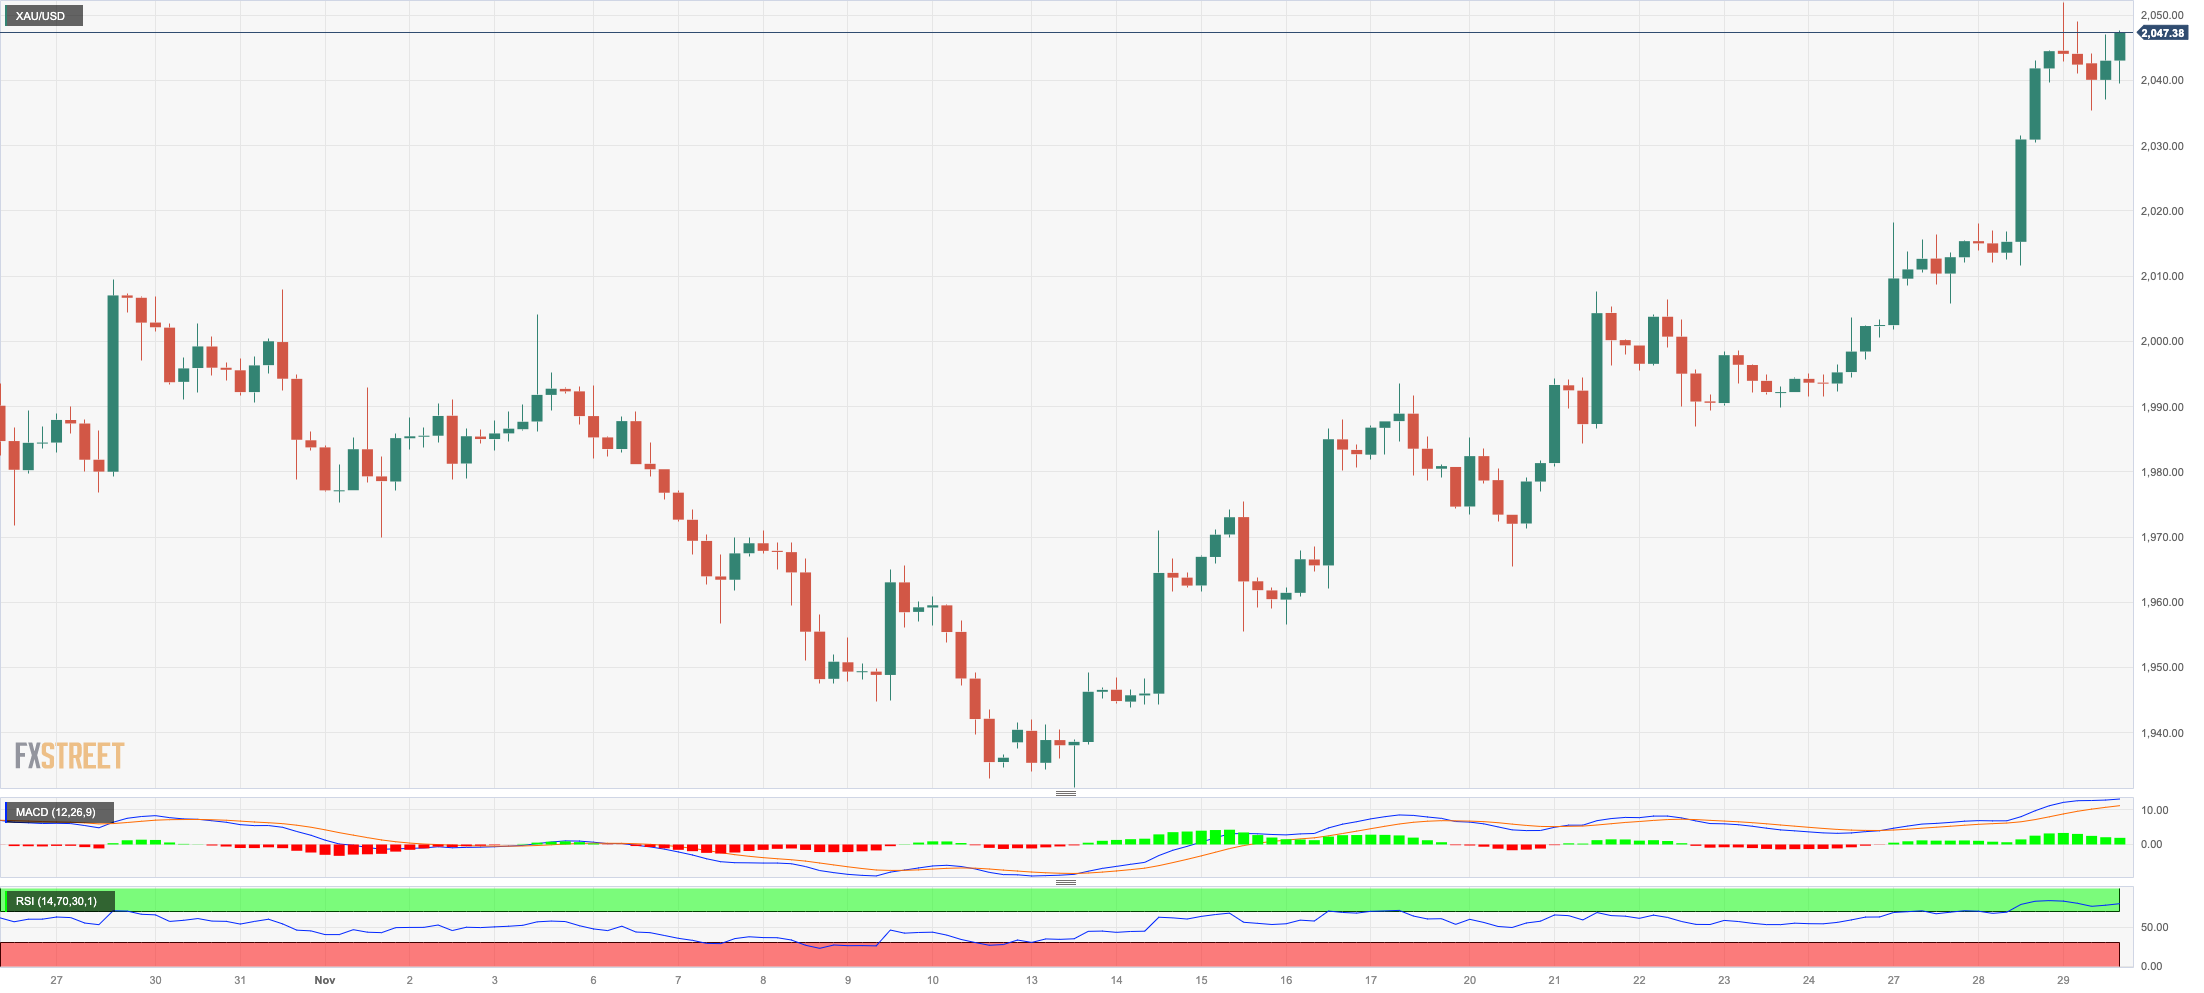
Wednesday’s inconclusive session in the greenback seems to have been enough to motivate prices of the yellow metal to extend their sharp advance for the fifth straight session.
That said, gold prices hovered around the $2050 region per troy ounce, an area last visited in early May, helped by the continuation of the downward trend in US yields across the curve, all against the unchanged backdrop of firm market chatter over potential interest rate cuts by the Fed in H1 2024.
The next upward hurdle for gold is the November top of $2052. (November 29). If this level is cleared, the 2023 peak of $2067 (May 4) and the 2022 high of $2070 (March 8) may be encountered before the all-time top of $2075 is achieved (August 7, 2020). Instead, periodic bearish efforts may send gold down to the important 200-day SMA at $1943 prior to the November low of $1931 (November 13), which looks to be supported by the vicinity of the preliminary 55-day SMA ($1939). Once this level is breached, the October low of $1810 (October 6) may be in play, followed by the 2023 bottom of $1804 (February 28) and the key contention zone of $1800.
Resistance levels: $2052 $2067 $2075 (4H chart)
Support levels: $2001 $1965 $1931 (4H chart)
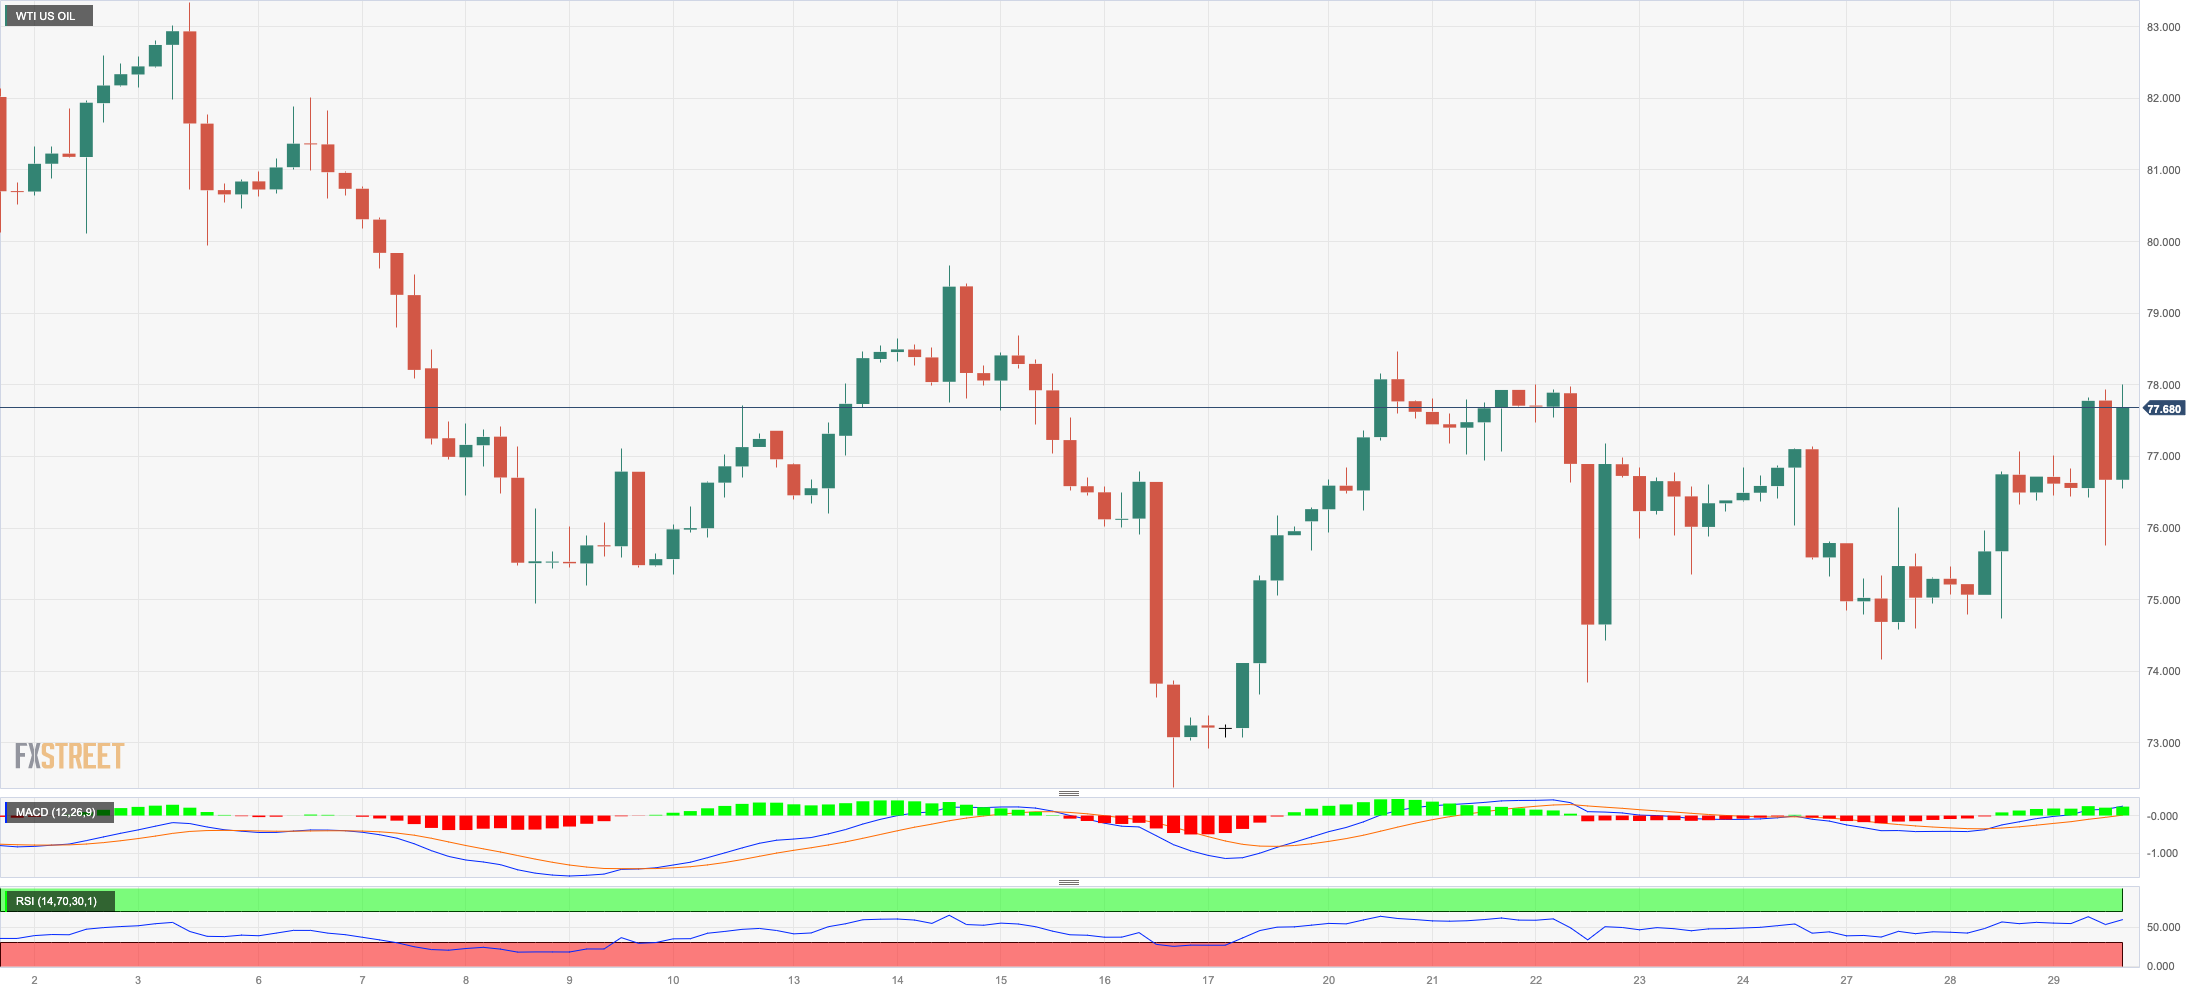
CRUDE WTI
WTI prices advanced for the second session in a row on Wednesday, flirting with the critical 200-day SMA around the $78.00 region per barrel.
Support for crude oil prices came after weather-related disruptions in Kazakhstan and Russia appear to have reignited the tight supply narrative, all ahead of rising speculation that the OPEC+ could announce extra oil output cuts at its meeting on November 30.
Also contributing to the upside bias in the commodity emerged auspicious results from flash US GDP figures during the July–September period.
On the not-so-bright side, the EIA reported that crude oil inventories increased more than expected by 1.609M barrels in the week to November 24, while supplies at Cushing rose by 1.854M barrels, Weekly Distillate Stocks went up by 5.217M barrels, and gasoline stockpiles climbed by 1.764M barrels.
If the WTI recovery gains speed, it may revisit the crucial 200-day SMA at $78.06, as well as the weekly high of $79.72 (November 14) and the November top of $80.15 (November 3). The preliminary 55-day SMA of $83.57 aligns north of here, ahead of weekly peaks of $89.83 (October 18), $94.99 (September 28), and $97.65 (August 30, 2022), all before the psychological $100.00 threshold. The resumption of the selling bias, on the flip side, might approach the November low of $72.22 (November 16) before hitting the important $70.00 mark, as well as the 2023 low of $63.61 (May 4), all of which come prior to the vital $60.00 level.
Resistance levels: $77.83 $78.42 $80.86 (4H chart)
Support levels: $74.03 $72.13 $70.18 (4H chart)
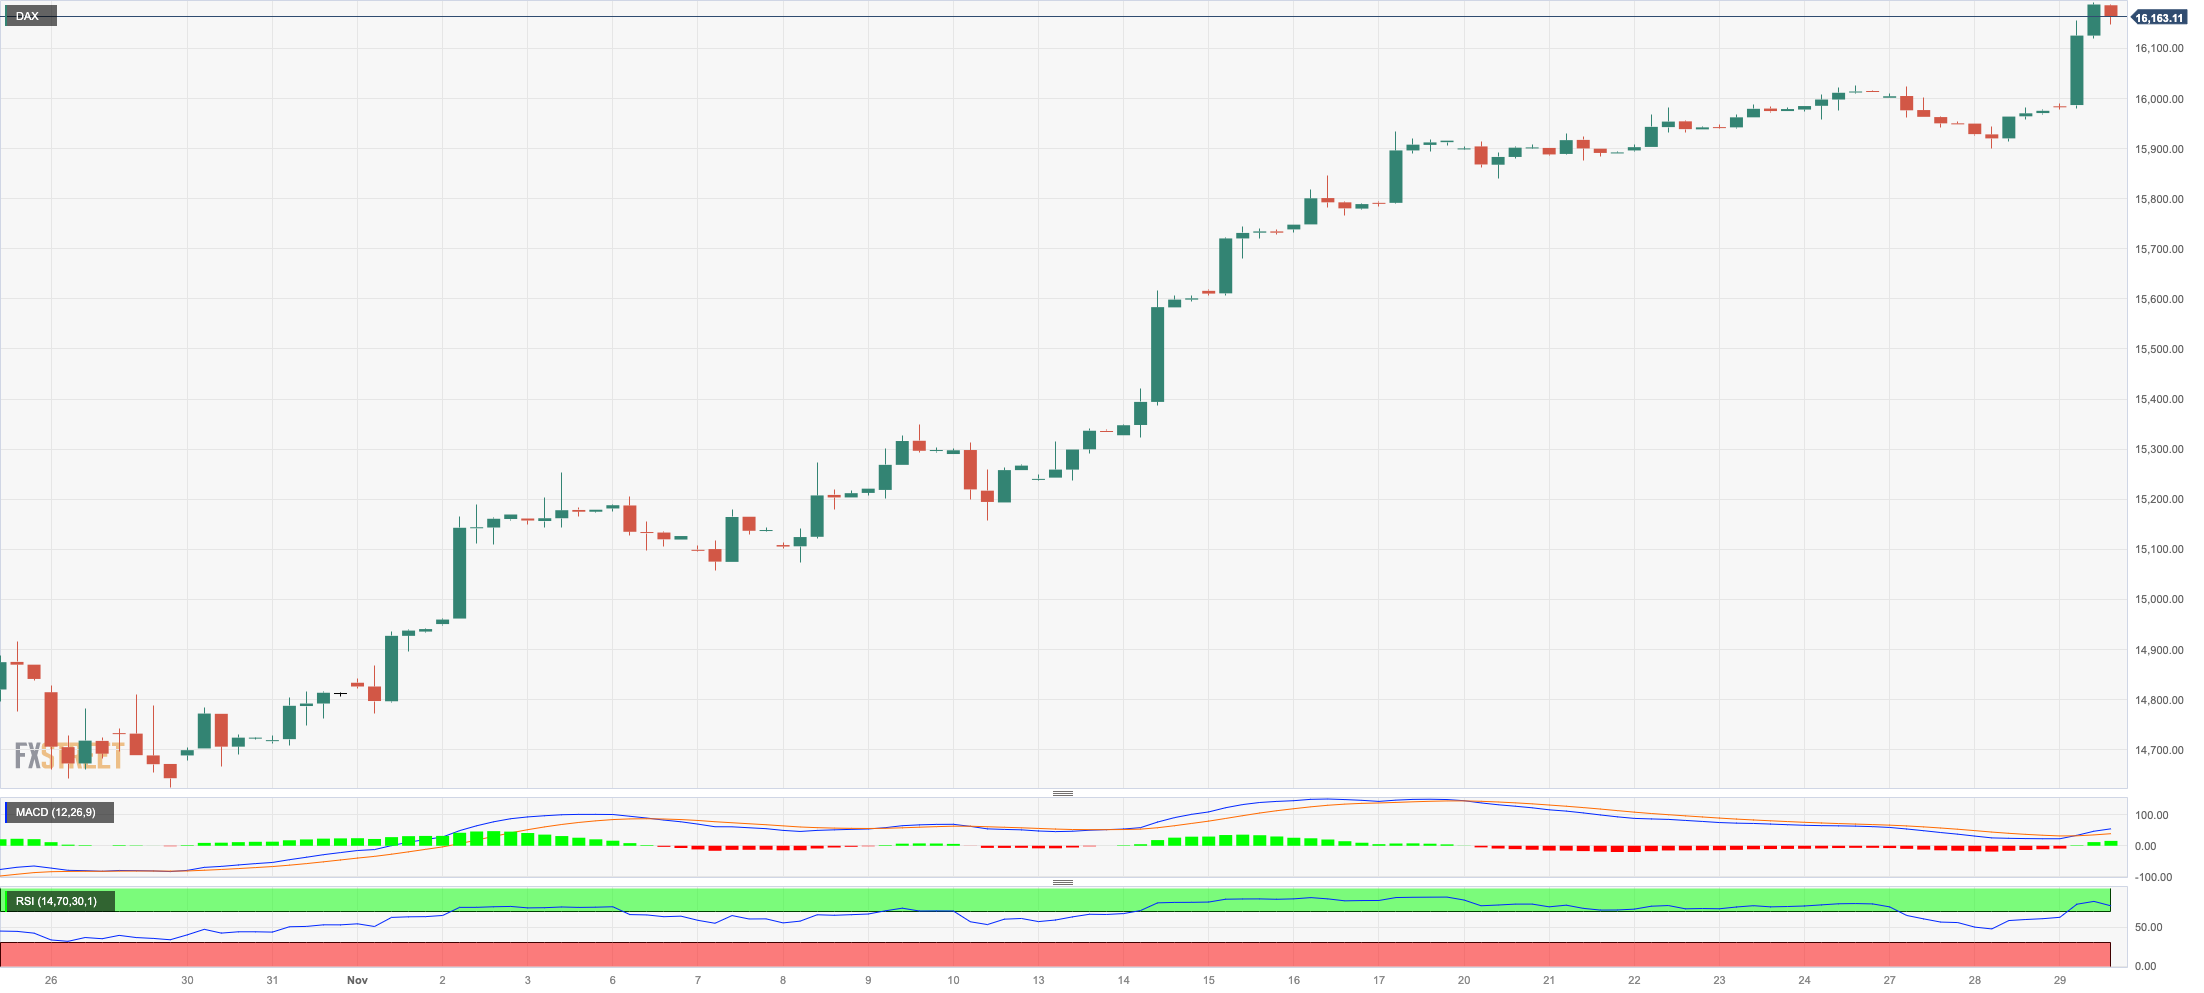
GER40
Further gains saw Germany’s benchmark DAX40 advance to fresh tops in levels last seen in late July near the 16200 zone on Wednesday.
In fact, optimism among investors gathered extra pace in response to further disinflationary pressure in the German economy, all after the CPI rose less than expected by 3.2% in the year to November, according to preliminary readings.
Also sustaining the bid bias emerged market talk regarding the likelihood that both the Fed and the ECB could start reducing their interest rates in the first half of next year.
In the German money market, the 10-year bund yields mirrored their US and global peers and declined markedly to the proximity of 2.40% for the first time since early August.
Further upside in the DAX40 could challenge the November top of 16208 (November 29), ahead of the all-time peak of 16528 (July 31). On the flip side, there is early support at the 200-day SMA of 15673, which is above the intermediate 55-day SMA of 15374. If this region is broken, the October bottom of 14630 (October 23) might be tested again before the March low of 14458 (March 20). The everyday RSI advanced further into the overbought zone above 75.
Best Performers: Infineon, Sartorius AG VZO, Zalando SE
Worst Performers: RWE AG ST, Munich Re Group, Covestro
Resistance levels: 16208 16528 (4H chart)
Support levels: 15915 15448 15171 (4H chart)
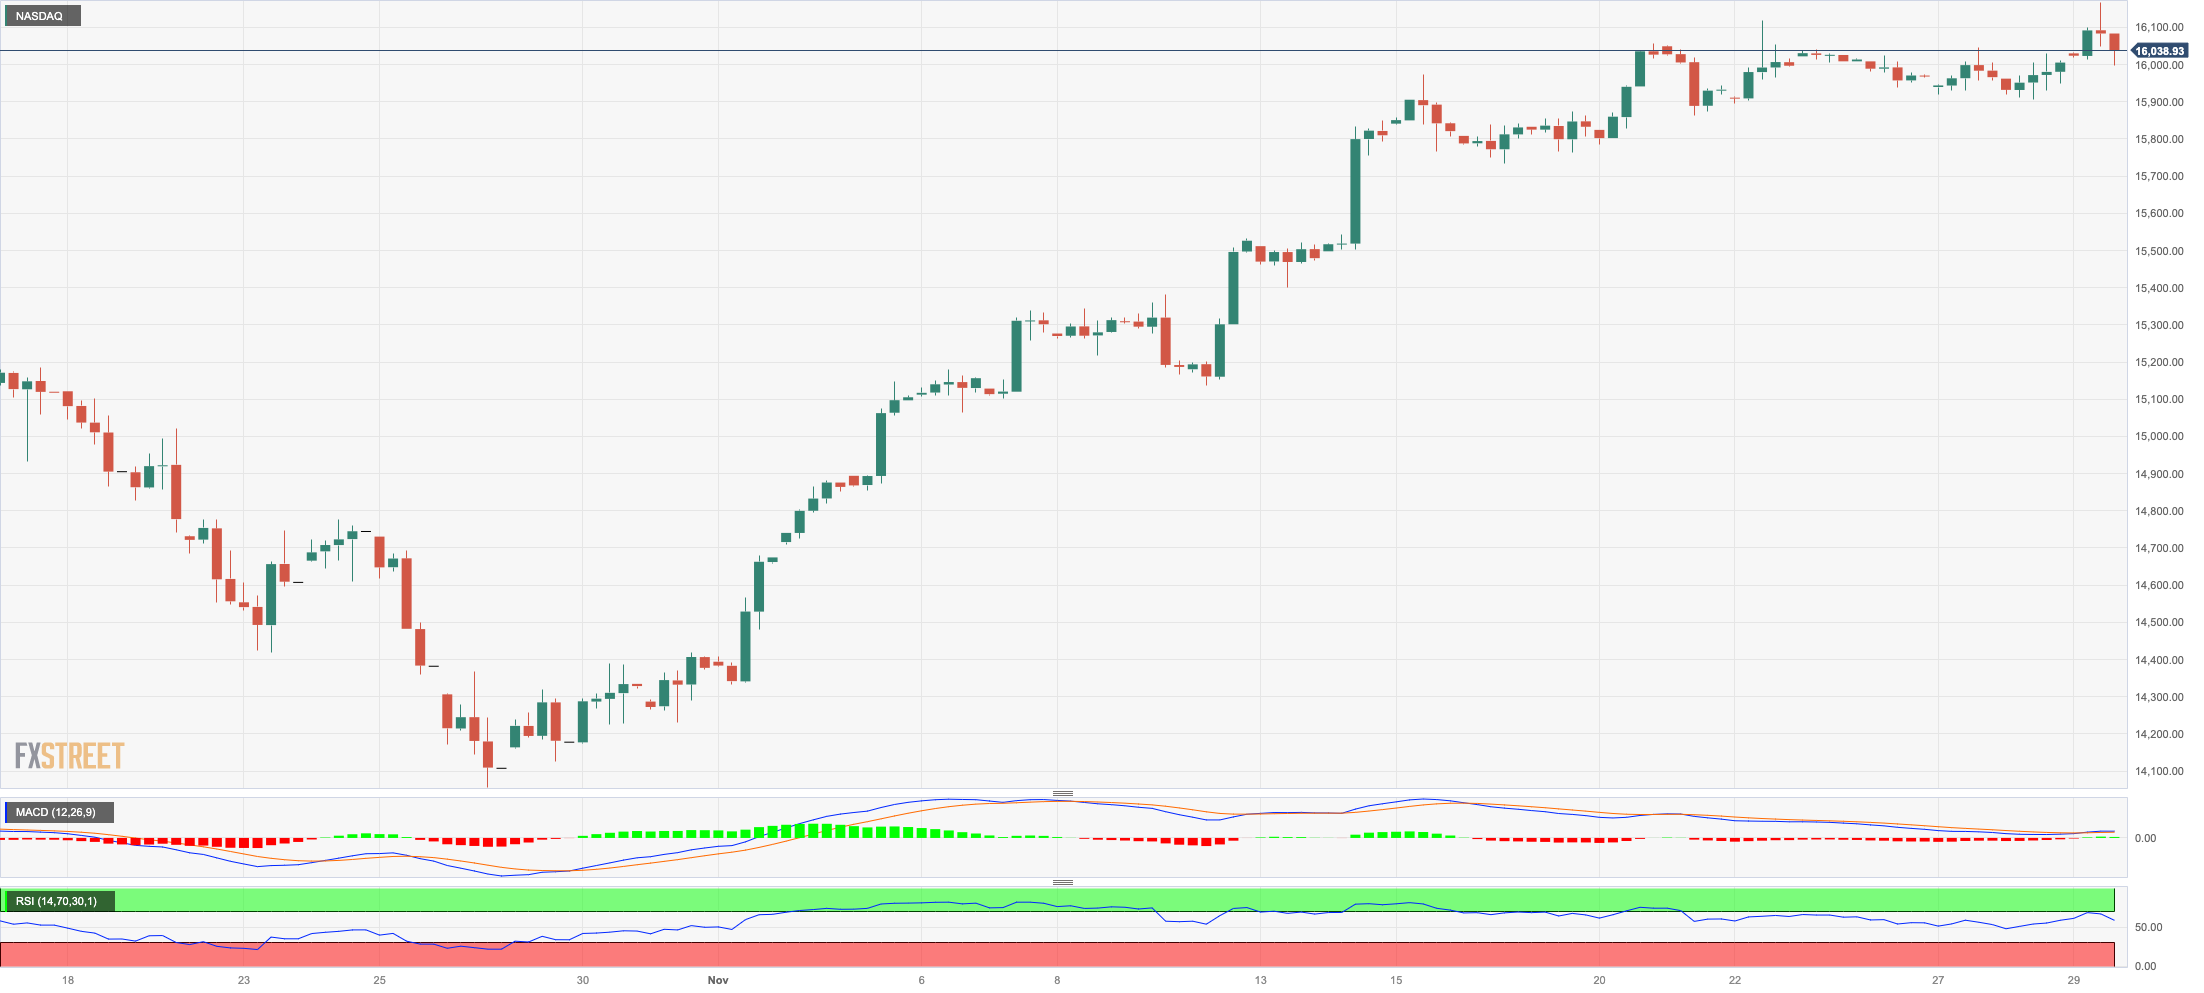
NASDAQ
Further optimism pushed the key Nasdaq 100 to new yearly peaks near 16200 on Wednesday, an area last traded in January 2022.
The second consecutive daily advance in tech stocks came on the back of further weakness in US yields across different maturities along with unabated speculation of interest rate cuts by the Fed at some point in H1 2024, all despite the still hawkish narrative from some policymakers.
Additional Nasdaq gains might propel the index to the 2023 peak of 16166 (November 29) before the December 2021 high of 16607 (December 28) and the all-time top of 16764 (November 22 2021). On the contrary, the next level of support appears to be around the preliminary 55-day SMA of 15105, which is above the critical 200-day SMA of 14303 and the October low of 14058 (October 26). Further losses might put the April low of 12724 (April 25) to the test ahead of the March low of 11695 (March 13) and the 2023 low of 10696 (January 3). The RSI looked stable above 69.
Top Gainers: Workday, CrowdStrike Holdings, Illumina
Top Losers: Constellation Energy, JD.com Inc Adr, Sirius XM
Resistance levels: 16166 16607 16764 (4H chart)
Support levels: 15738 15193 14058 (4H chart)
All Information & Updates provided by:

All information relating to the financial markets available on this page has been prepared and issued by FXStreet (Forexstreet SL, Spain, Reg: B62498233) on the basis of publicly available information and all information believed to be reliable and does not conflict with Kuwaiti local laws, and all necessary care has been taken to before the company to ensure that the facts mentioned are correct from the source.
NCM Investment nor any of its directors or employees shall in any way be held responsible for the contents of this news, and the information contained on this page is intended only to provide clients with publicly available information and should not be construed as investment advice, report or analysis and/or constitute an offer or invitation to buy or sell financial instruments of any kind.
RISK WARNING: Forex and CFDs are highly risky leveraged products, as losses can exceed deposits. Please ensure you understand all the risks and take independent advice if necessary. NCM will segregate the clients based on the criteria of the regulator and its bylaws. NCM does not provide any advisory service; the material published does not constitute advice or a recommendation for a transaction in any financial instrument. NCM accepts no responsibility for any use of the content presented and any consequences of that use. Anyone acting on the information provided does so at their own risk.