
- Contact Us:
-

-

-

-


Daily Market Updates
01 Dec 2023
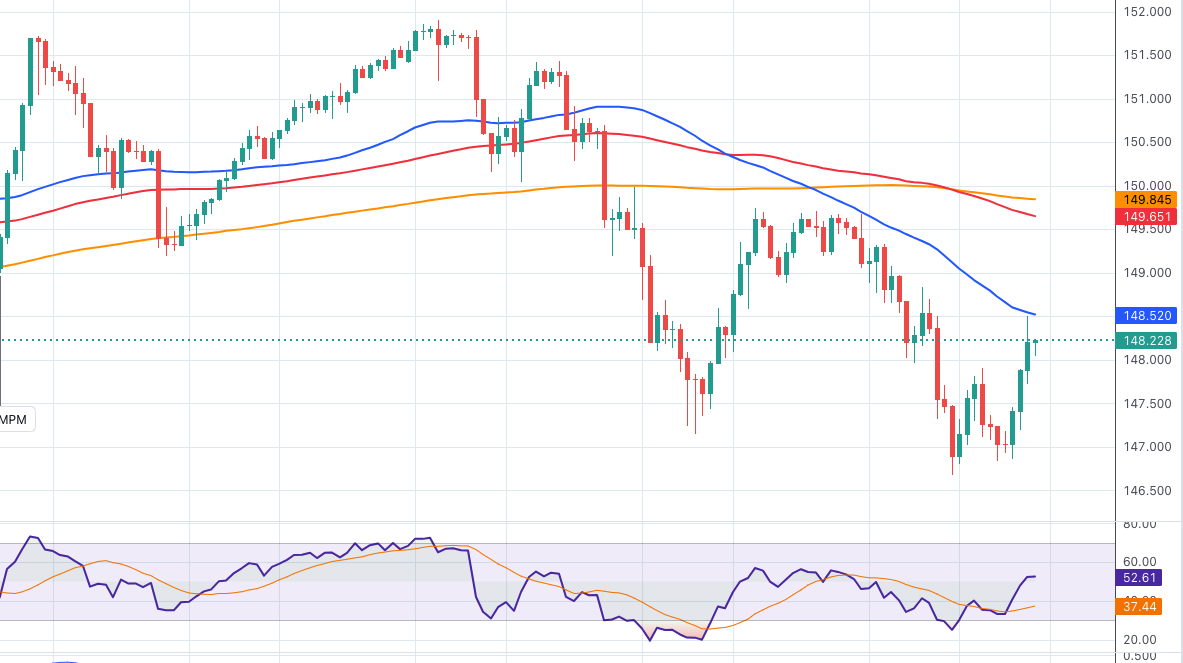
USDJPY
Further recovery in the greenback in combination with the equally robust uptick in US yields across the board helped USD/JPY reverse four daily drops in a row and stage a decent advance past the 148.00 barrier on Thursday.
In the Japanese debt market, the JGB 10-year yields also bounced strongly to the vicinity of the 0.68% area.
From the BoJ, member Nakamura stated that they deemed it necessary to maintain the current monetary easing patiently for the time being. They emphasized the need for additional time before considering any policy adjustments. Nakamura expressed optimism about Japan's economy, noting its moderate recovery. They highlighted the rare and significant opportunity they perceived for a wage-price cycle.
In the docket, Foreign Bond Investment shrank by ¥84.5B in the week to November 25, flash Industrial Production expanded by 0.9% in the year to October; and Retail Sales expanded by 4.2% over the last twelve months, also in October. Finally, Consumer Confidence improved to 36.1 in November and Housing Starts contracted at an annualized 6.3% in October.
If USD/JPY continues to decrease, it might reach the November low of 146.67 (November 29), which aligns before the September low of 144.43 (September 1). There are no clear support levels below the latter until the important 200-day SMA at 142.01, which is previous to the August bottom of 141.50 (August 7) and the July low of 137.23 (July 14). Just the opposite, immediate resistance occurs at the 2023 top of 151.90 (November 13), followed by the 2022 peak of 151.94 (October 21) and the round number of 152.00. The RSI rebounded past the 42 level.
Resistance levels: 148.50 149.74 151.43 (4H chart)
Support levels: 146.67 145.89 144.43 (4H chart)
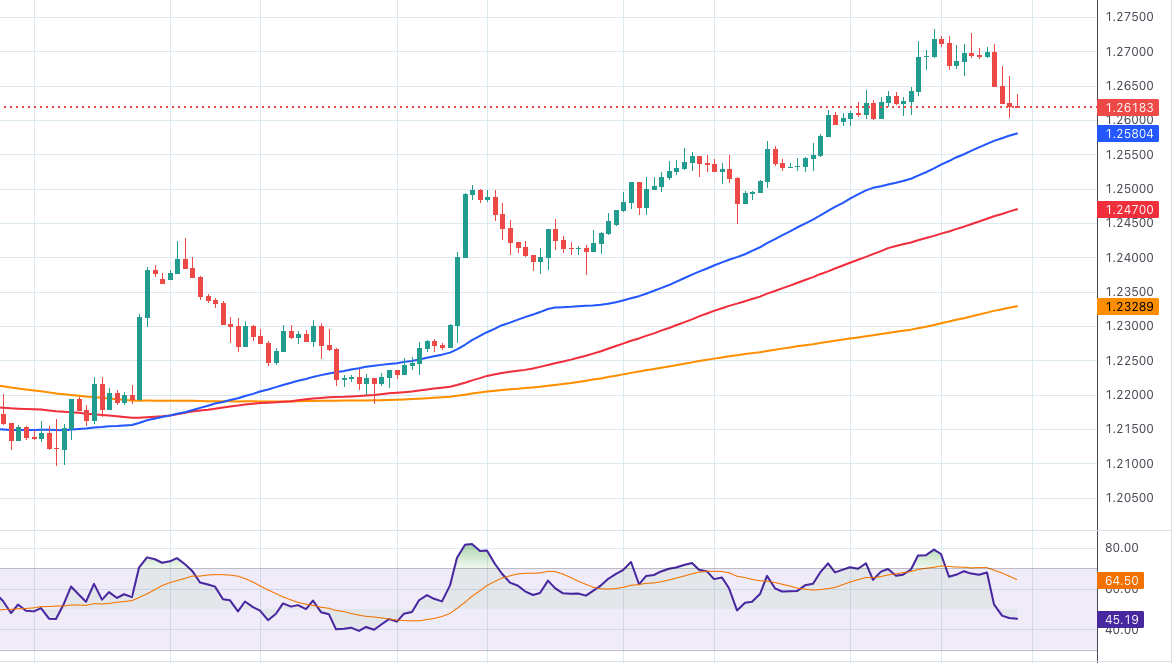
GBPUSD
Following five consecutive daily advances, GBP/USD came under renewed downside pressure and tested the area of three-day lows in the 1.2600 neighbourhood on Thursday.
The corrective decline in Cable came in tandem with further strength in the greenback, which was in turn helped by the marked rebound in US yields and the broad-based offered stance in the risk-linked galaxy.
From the BoE, MPC member Greene expressed concern regarding the potential mishap of a soft landing in the UK. He also mentioned the possibility of needing prolonged restrictive policies to restore inflation to 2% over the medium-term. Greene noted that inflation, excluding energy, remained excessively high and highlighted the persistently tight state of the UK labor market. Furthermore, he observed that the current policy was less restrictive than previously anticipated.
In the UK docket, Car Production expanded by 31.6% in October vs. the same month in 2022.
The next upward hurdle for GBP/USD is the November high of 1.2733 (November 29). If this level is surpassed, it opens the door to weekly tops of 1.2746 (August 30), 1.2818 (August 10), and 1.2995 (July 27), all of which occur before the critical 1.3000 yardstick. The pivotal 200-day SMA at 1.2466, on the other hand, is expected to provide early resistance ahead of the transitory 55-day SMA at 1.2294. The weekly low of 1.2187 (November 10) is directed south from here, followed by weekly lows of 1.2069 (October 26) and 1.2037 (October 3), all before the critical 1.2000 level and the 2023 low of 1.1802 (March 8). The day-to-day RSI slipped back to the 65 zone.
Resistance levels: 1.2733 1.2746 1.2800 (4H chart)
Support levels: 1.2603 1.2448 1.2373 (4H chart)
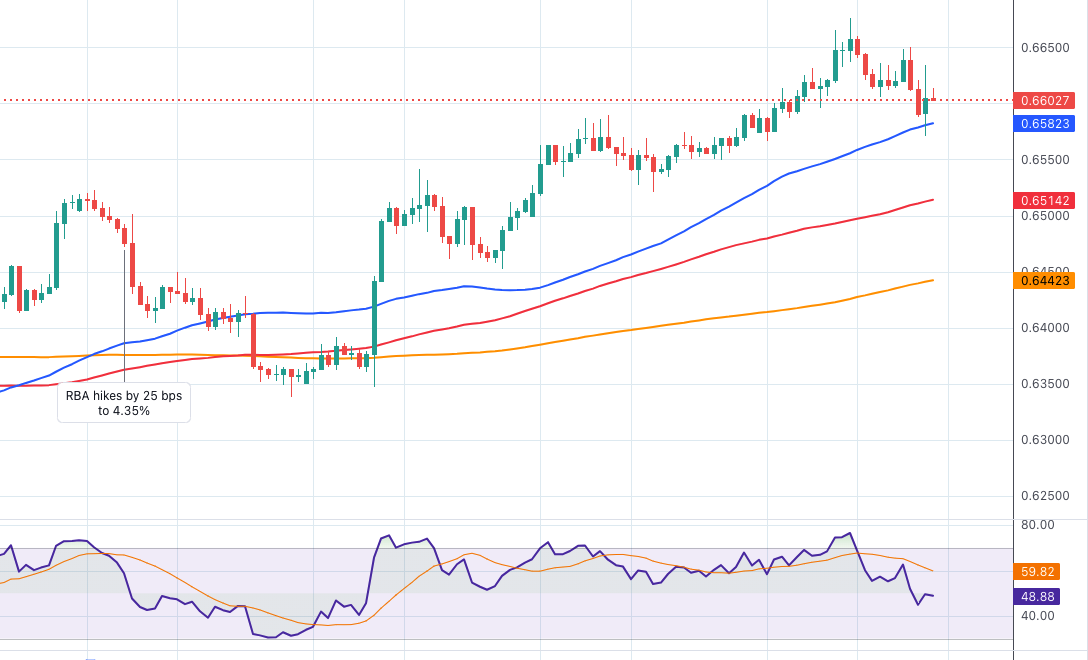
AUDUSD
Following the intense recovery in the greenback, AUD/USD retreated modestly to the low-0.6600s on Thursday, building at the same time on Wednesday’s marked decline.
In the same line, the pair suffered the poor session in the commodity universe as well as weaker-than-expected official PMIs in China for the current month, according to NBS.
In Oz, preliminary Building Permits expanded at a monthly 7.5% in October, and Housing Credit rose 0.4% MoM in the same period.
For AUD/USD, the November peak of 0.6676 (November 29) is immediately on the upside. A trespass of this level might reintroduce a challenge to the July high of 0.6894 (July 14) ahead of the June top of 0.6899 (June 16) and the crucial 0.7000 threshold. Nonetheless, the significant 200-day SMA at 0.6579 emerges as a key issue ahead of the transitory 55-day SMA at 0.6424. If this level is breached, a move to the 2023 bottom of 0.6270 (October 26) could start shaping up, prior to the round level of 0.6200 and the 2022 low of 0.6169 (October 13). The daily RSI grinded lower to the 64 region.
Resistance levels: 0.6676 0.6739 0.6821 (4H chart)
Support levels: 0.6570 0.6521 0.6452 (4H chart)
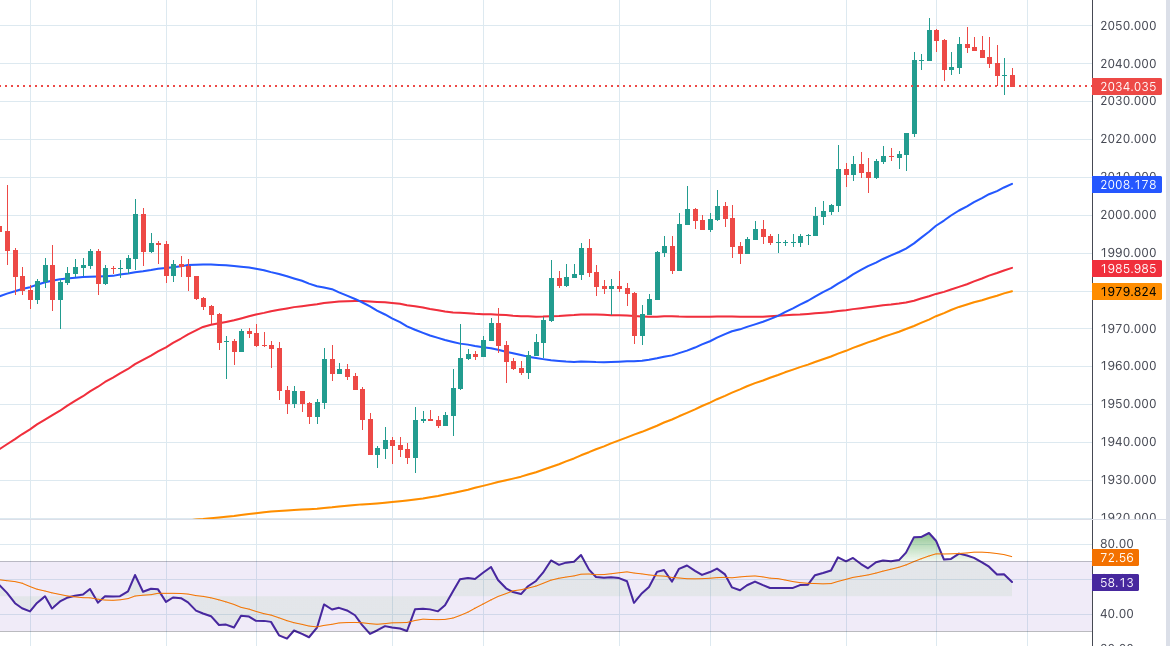
GOLD
Gold prices came under pressure and gave away some of their multi-day gains on Thursday, briefly retreating to two-day lows around the $2030 zone.
Indeed, following Wednesday’s monthly highs past $2050 per troy ounce, the precious metal succumbed to the sharp move higher in the dollar along with the equally firm advance in US yields across different maturities.
The November high of $2052 (November 29) represents the next upward barrier for gold. If this level is broken, the 2023 top of $2067 (May 4) and the 2022 peak of $2070 (March 8) may be reached before the all-time high of $2075 is reached (August 7, 2020). Instead, occasional bearish efforts may drive gold down to the critical 200-day SMA at $1944 before the November low of $1931 (November 13). Once this level is cleared, the October low of $1810 (October 6) may be in play, followed by the 2023 bottom of $1804 (February 28) and the $1800 critical contention zone.
Resistance levels: $2052 $2067 $2075 (4H chart)
Support levels: $2031 $2005 $1986 (4H chart)
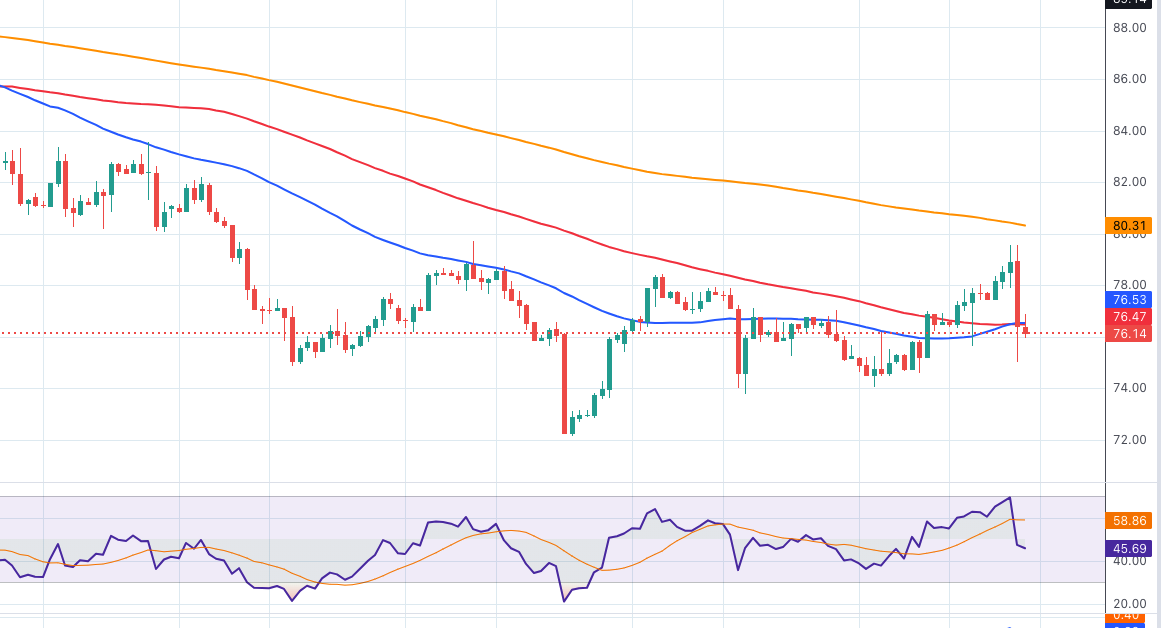
CRUDE WTI
Prices of WTI could not sustain a move to multi-day highs just below the key $80.00 mark per barrel on Thursday, eventually sparking a corrective move to the $75.00 zone amidst a strong resumption of the selling pressure.
Indeed, the resurgence of the bearish trend came in tandem with rising scepticism after the OPEC+ announced further oil output cuts near to 2 mbpd at the cartel’s gathering earlier in the session.
Extra weakness in the commodity also came from the persistent rebound in the US dollar and disheartening prints from Chinese PMIs for the current month.
If the WTI rebound picks up extra momentum, it might test the key $80.00 mark, which is closely followed by the November high of $80.15 (November 3). The preliminary 55-day SMA of $83.31 aligns north of here, prior to weekly tops of $89.83 (October 18), $94.99 (September 28), and $97.65 (August 30, 2022), all of which occur before the psychological $100.00 mark. On the flip side, a return of the selling tendency may approach the November low of $72.22 (November 16) before reaching the critical $70.00 level, as well as the 2023 low of $63.61 (May 4), and the critical $60.00 yardstick.
Resistance levels: $79.56 $83.56 $85.85 (4H chart)
Support levels: $74.03 $72.13 $70.18 (4H chart)
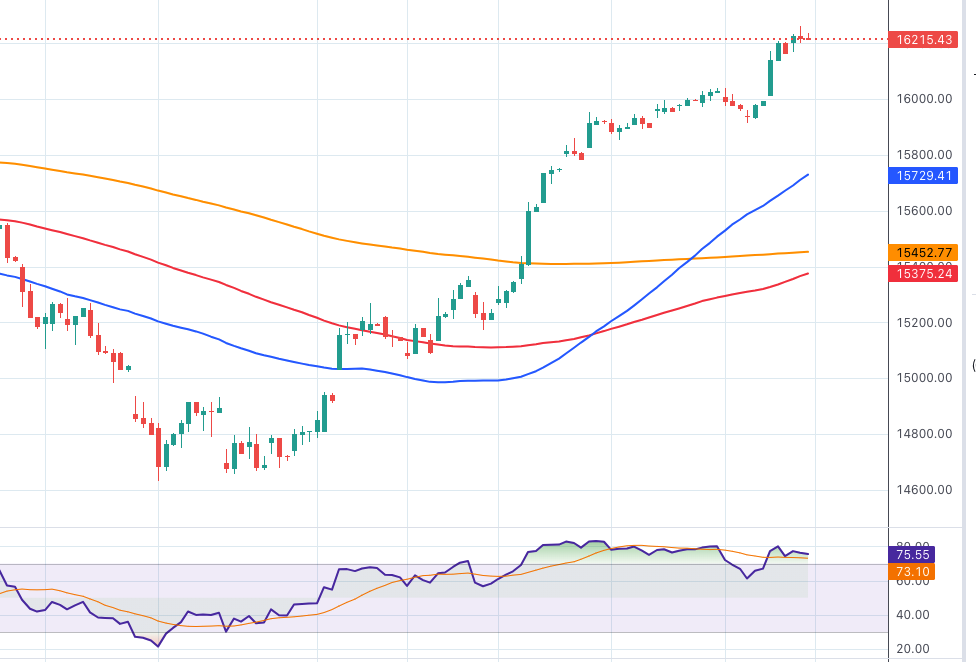
GER40
German equities rose to fresh highs in levels last traded in early August past the 16200 region when gauged by the benchmark DAX40 on Thursday.
Increasing optimism boosted the sentiment among European investors after flash inflation figures in the euro bloc showed another lower print during November, while auspicious results from Retail Sales in Germany also added to the upbeat mood.
The third session in a row of gains in the index came in line with the marked rebound in the 10-year bund yields after three consecutive daily pullbacks.
Further gains in the DAX40 might push it over the November high of 16262 (November 30), ahead of the all-time top of 16528 (July 31). On the other hand, there is early support at the 200-day SMA of 15677, which is above the intermediate 55-day SMA of 15381. If this area is breached, the October low of 14630 (October 23) may be challenged again before the March low of 14458 is reached (March 20). The daily RSI increased higher into the overbought zone beyond 76.
Best Performers: Brenntag AG, Bayer, Fresenius SE
Worst Performers: Vonovia, Porsche, Dr Ing hc Porsche Prf
Resistance levels: 16262 16528 (4H chart)
Support levels: 15915 15452 15171 (4H chart)
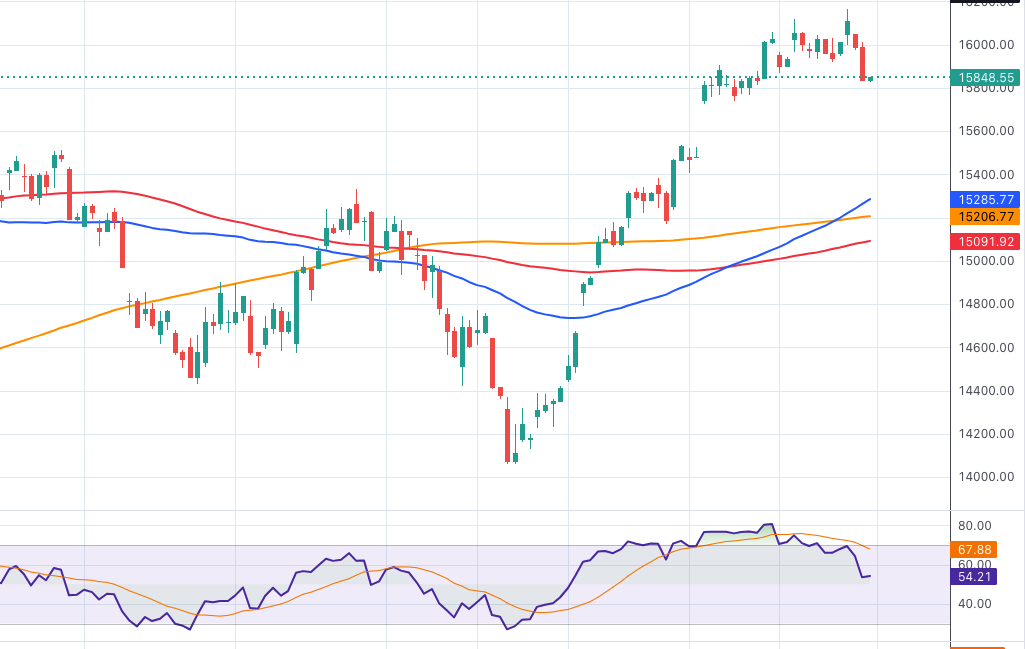
NASDAQ
The tech sector remained under pressure on Thursday, prompting the reference Nasdaq 100 to add to Wednesday’s losses and reach multi-session lows near the 15800 zone.
The intense rebound in the greenback coupled with the robust bounce in US yields across the curve weighed on tech equities and sponsored another knee-jerk in the index on Thursday.
Additional Nasdaq gains might take the index to the 2023 peak of 16166 (November 29) before the December 2021 high of 16607 (December 28) and the all-time top of 16764 (November 22 2021). The other way around, the 55-day SMA of 15113 should offer interim contention prior to the crucial 200-day SMA of 14319 and the October low of 14058 (October 26). Further losses might challenge the April bottom of 12724 (April 25), as well as the March low of 11695 (March 13) and the 2023 low of 10696 (January 3). The RSI on the daily chart deflated to the proximity of 61.
Top Gainers: PDD Holdings DRC, Regeneron Pharma, Dollar Tree
Top Losers: Synopsys, Lucid Group, AMD
Resistance levels: 16166 16607 16764 (4H chart)
Support levels: 15738 15202 14058 (4H chart)
All Information & Updates provided by:

All information relating to the financial markets available on this page has been prepared and issued by FXStreet (Forexstreet SL, Spain, Reg: B62498233) on the basis of publicly available information and all information believed to be reliable and does not conflict with Kuwaiti local laws, and all necessary care has been taken to before the company to ensure that the facts mentioned are correct from the source.
NCM Investment nor any of its directors or employees shall in any way be held responsible for the contents of this news, and the information contained on this page is intended only to provide clients with publicly available information and should not be construed as investment advice, report or analysis and/or constitute an offer or invitation to buy or sell financial instruments of any kind.
RISK WARNING: Forex and CFDs are highly risky leveraged products, as losses can exceed deposits. Please ensure you understand all the risks and take independent advice if necessary. NCM will segregate the clients based on the criteria of the regulator and its bylaws. NCM does not provide any advisory service; the material published does not constitute advice or a recommendation for a transaction in any financial instrument. NCM accepts no responsibility for any use of the content presented and any consequences of that use. Anyone acting on the information provided does so at their own risk.