
- Contact Us:
-

-

-

-


Daily Market Updates
04 Dec 2023
USDJPY
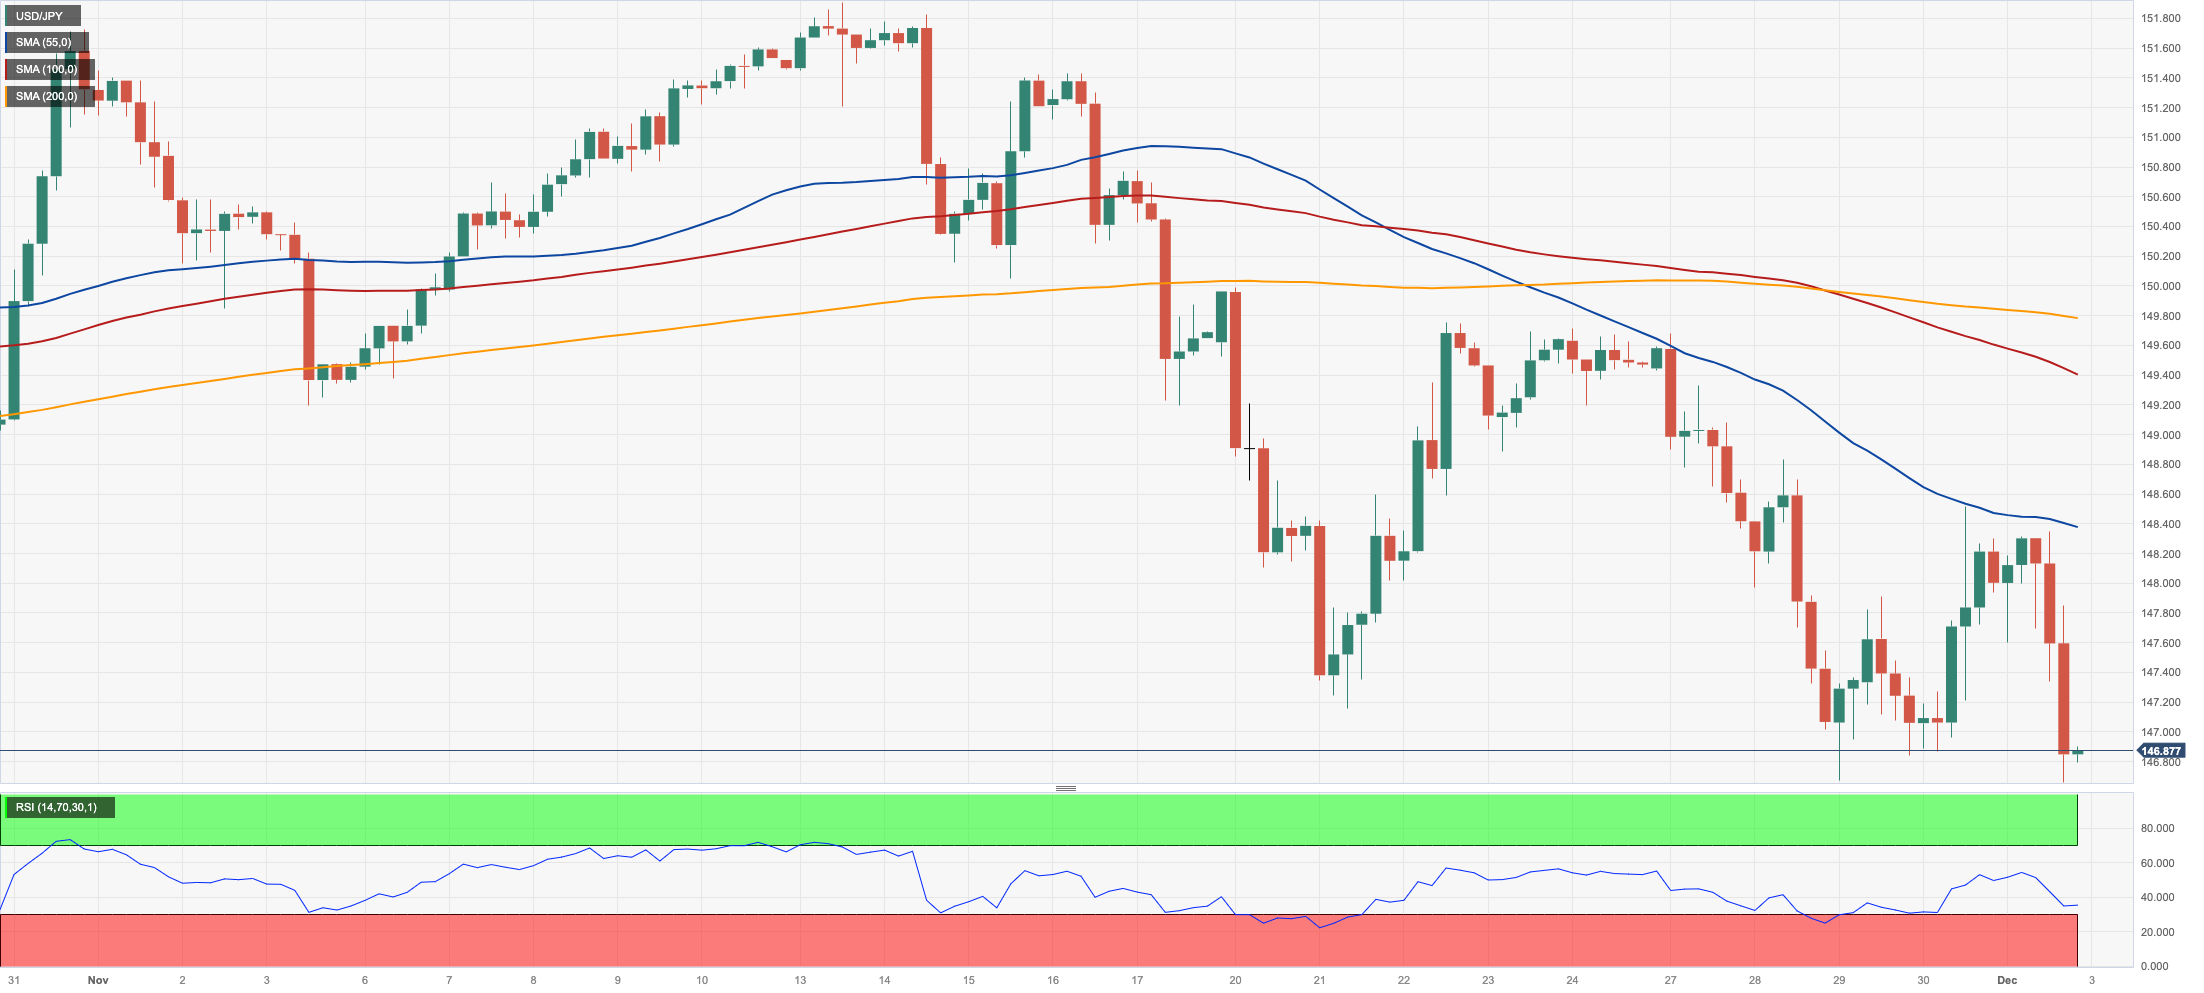
USD/JPY resumed the decline and breached once again the temporary 100-day SMA (147.14) to flirt with the November lows in the 146.70/60 band on Friday. That said, the pair extended its retracement for the third consecutive week following the 2023 top at 151.90 (November 13).
The pair’s daily pullback came amidst the resurgence of the bearish tone in the greenback and extra demand for US bonds, which in turn weighed on US yields across different timeframes.
In the Japanese money market, JGBP 10-year yields rose to two-day highs past 0.70%.
In Japan, the jobless rate dwindled to 2.5% in October, and Capital Spending expanded to an annualized 3.4% in the July–September period.
The breakdown of the weekly low of 146.65 (December 1) could prompt USD/JPY to dispute the September low of 144.43 (September 1). There are no obvious support levels below the latter until the 200-day SMA at 142.07, which is prior to the August low of 141.50 (August 7) and the July low of 137.23 (July 14). Just the opposite, immediate resistance is found at the 2023 top of 151.90 (November 13), followed by the 2022 peak of 151.94 (October 21) and the round number of 152.00. The RSI grinded lower to the area below the 37 level.
Resistance levels: 148.52 149.78 151.43 (4H chart)
Support levels: 146.65 145.89 144.43 (4H chart)
GBPUSD
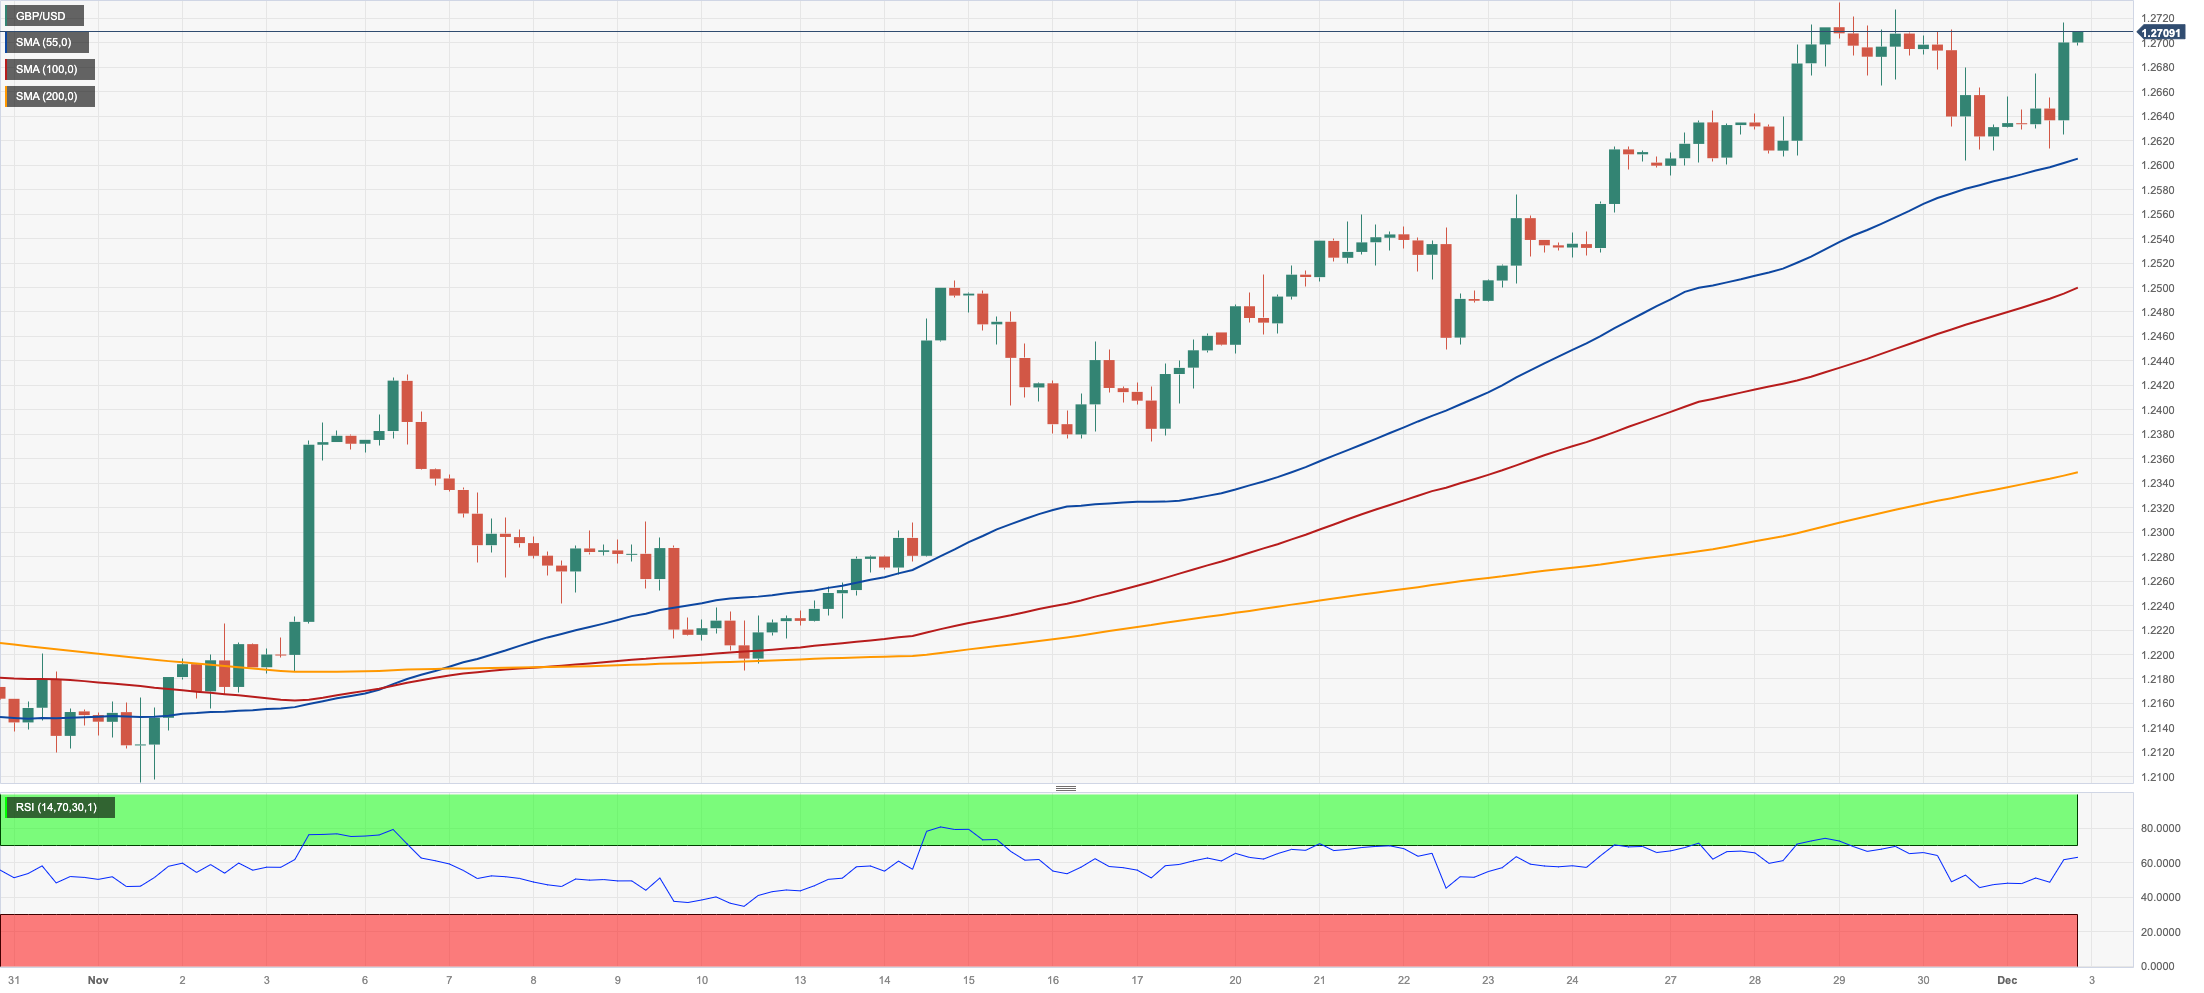
GBP/USD reversed Thursday’s bearish tone and ended Friday’s session just above the key 1.2700 barrier, extending its positive streak for the third week in a row.
Indeed, Cable managed to post marked gains against the backdrop of the pronounced sell-off in the greenback along with the resumption of the downward bias in US yields across the board.
Still in the fixed-income space, 10-year gilt yields followed their global counterparts and retreated modestly to the 4.15% region following the robust bounce seen in the previous session.
In the UK, final Manufacturing PMI improved to 47.2 for the month of November, and house prices tracked by Nationwide contracted by 2.0% in the year to November.
The November high of 1.2733 represents the next upward barrier for GBP/USD (November 29). If this level is trespassed, the door could open to weekly tops of 1.2746 (August 30), 1.2818 (August 10), and 1.2995 (July 27), all of which occur before the important 1.3000 yardstick. In contrast, the crucial 200-day SMA at 1.2466 is projected to provide early resistance ahead of the transitory 55-day SMA at 1.2299. From here, the weekly low of 1.2187 (November 10) heads south, seconded by weekly lows of 1.2069 (October 26) and 1.2037 (October 3), all before the key 1.2000 threshold and the 2023 low of 1.1802 (March 8). The day-to-day RSI improved past the 68 yardstick.
Resistance levels: 1.2715 1.2733 1.2746 (4H chart)
Support levels: 1.2603 1.2448 1.2373 (4H chart)
AUDUSD
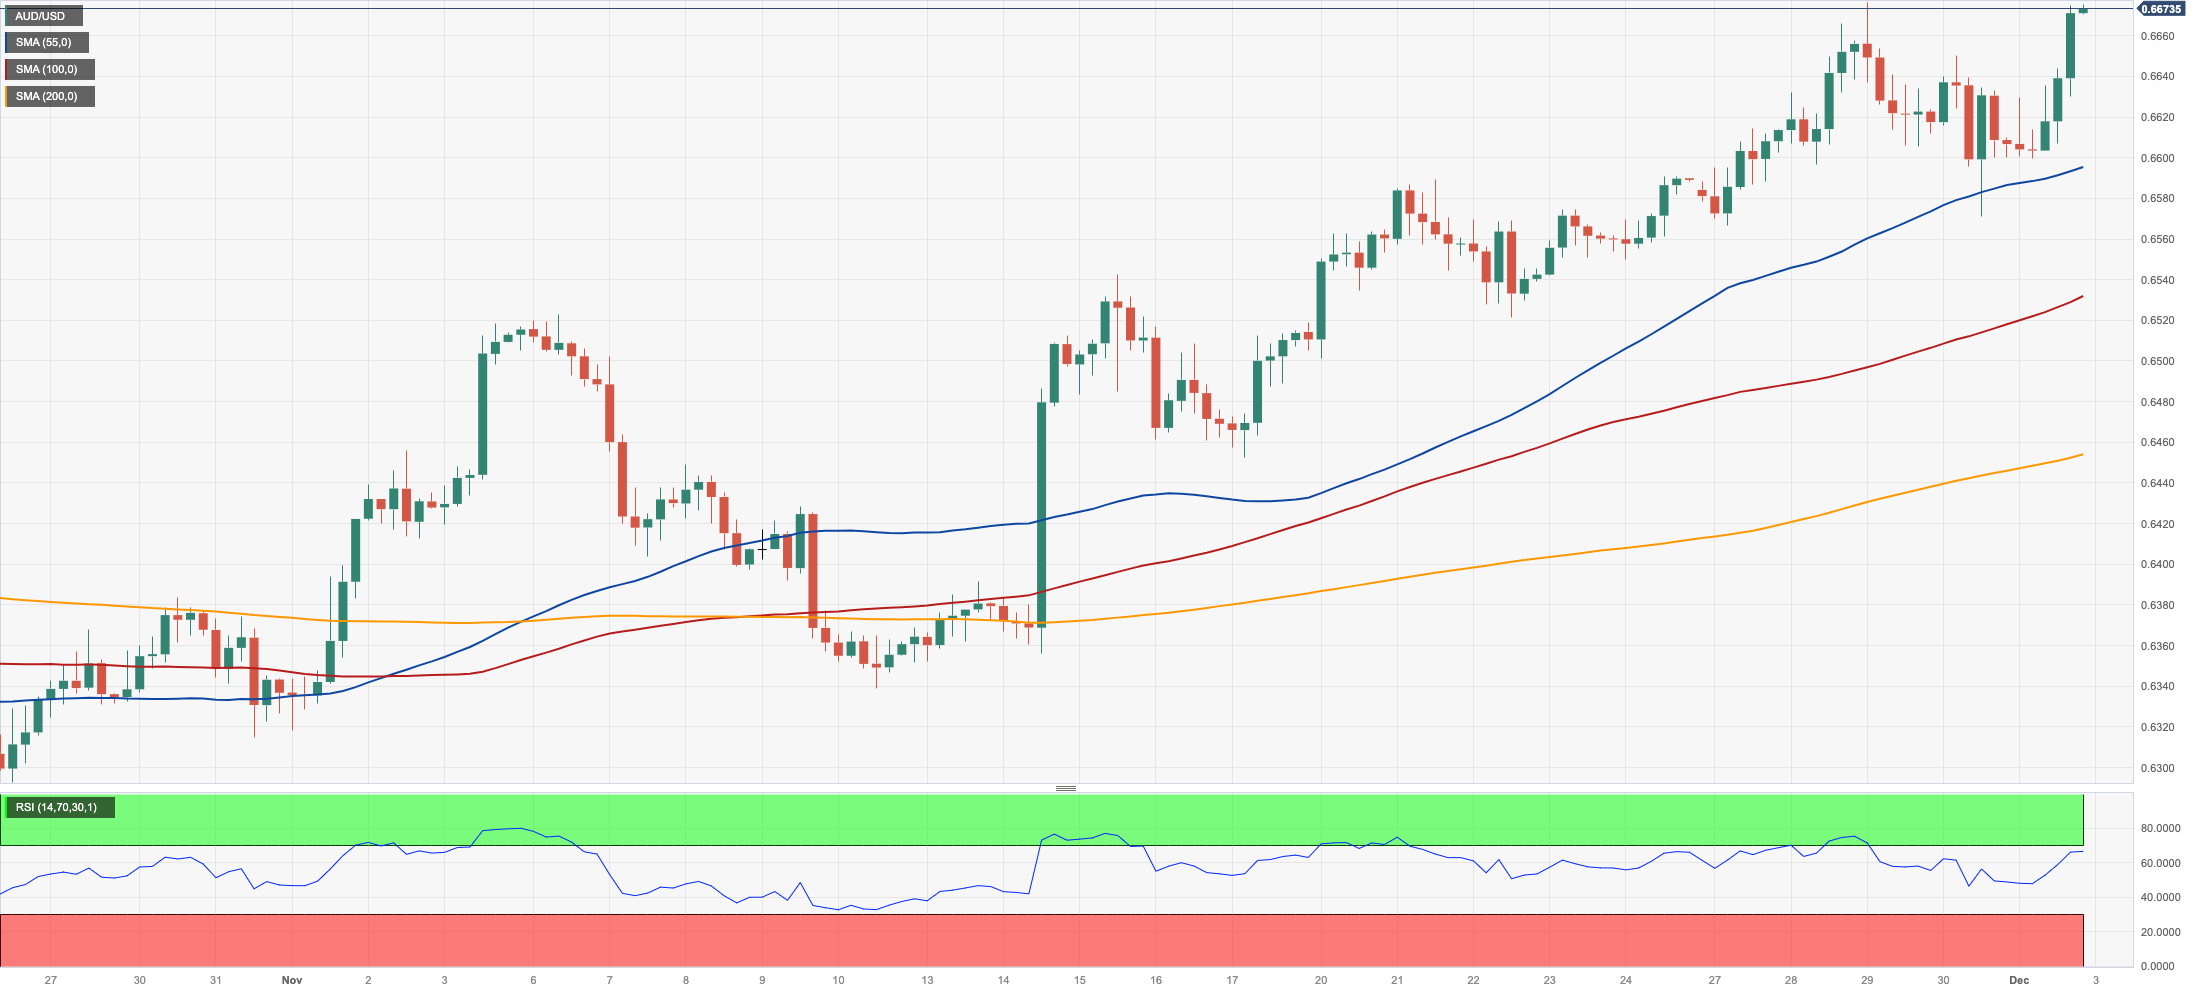
The Aussie dollar regained its smile and sponsored a robust bounce in AUD/USD after two daily drops in a row, managing to trade at shouting distance from the November peak around 0.6670 on Friday.
Extra buying pressure in the AUD came from the auspicious prints from the Chinese Manufacturing PMI tracked by Caixin for the month of November, while the positive performance from copper and iron ore also contributed to the daily uptick in spot.
The Australian docket was empty on Friday.
The November top of 0.6676 (November 29) is immediately on the upside for AUD/USD. A breakout of this level might revive a challenge to the July peak of 0.6894 (July 14), which is just ahead of the June high of 0.6899 (June 16) and the critical 0.7000 barrier. Nonetheless, the important 200-day SMA at 0.6579 looms as a critical contention zone ahead of the temporary 55-day SMA at 0.6428. If this level is breached, a move to the 2023 bottom of 0.6270 (October 26) could start shaping up prior to the round level of 0.6200 and the 2022 low of 0.6169 (October 13). The daily RSI improved past the 68 mark.
Resistance levels: 0.6675 0.6739 0.6821 (4H chart)
Support levels: 0.6570 0.6521 0.6449 (4H chart)
GOLD
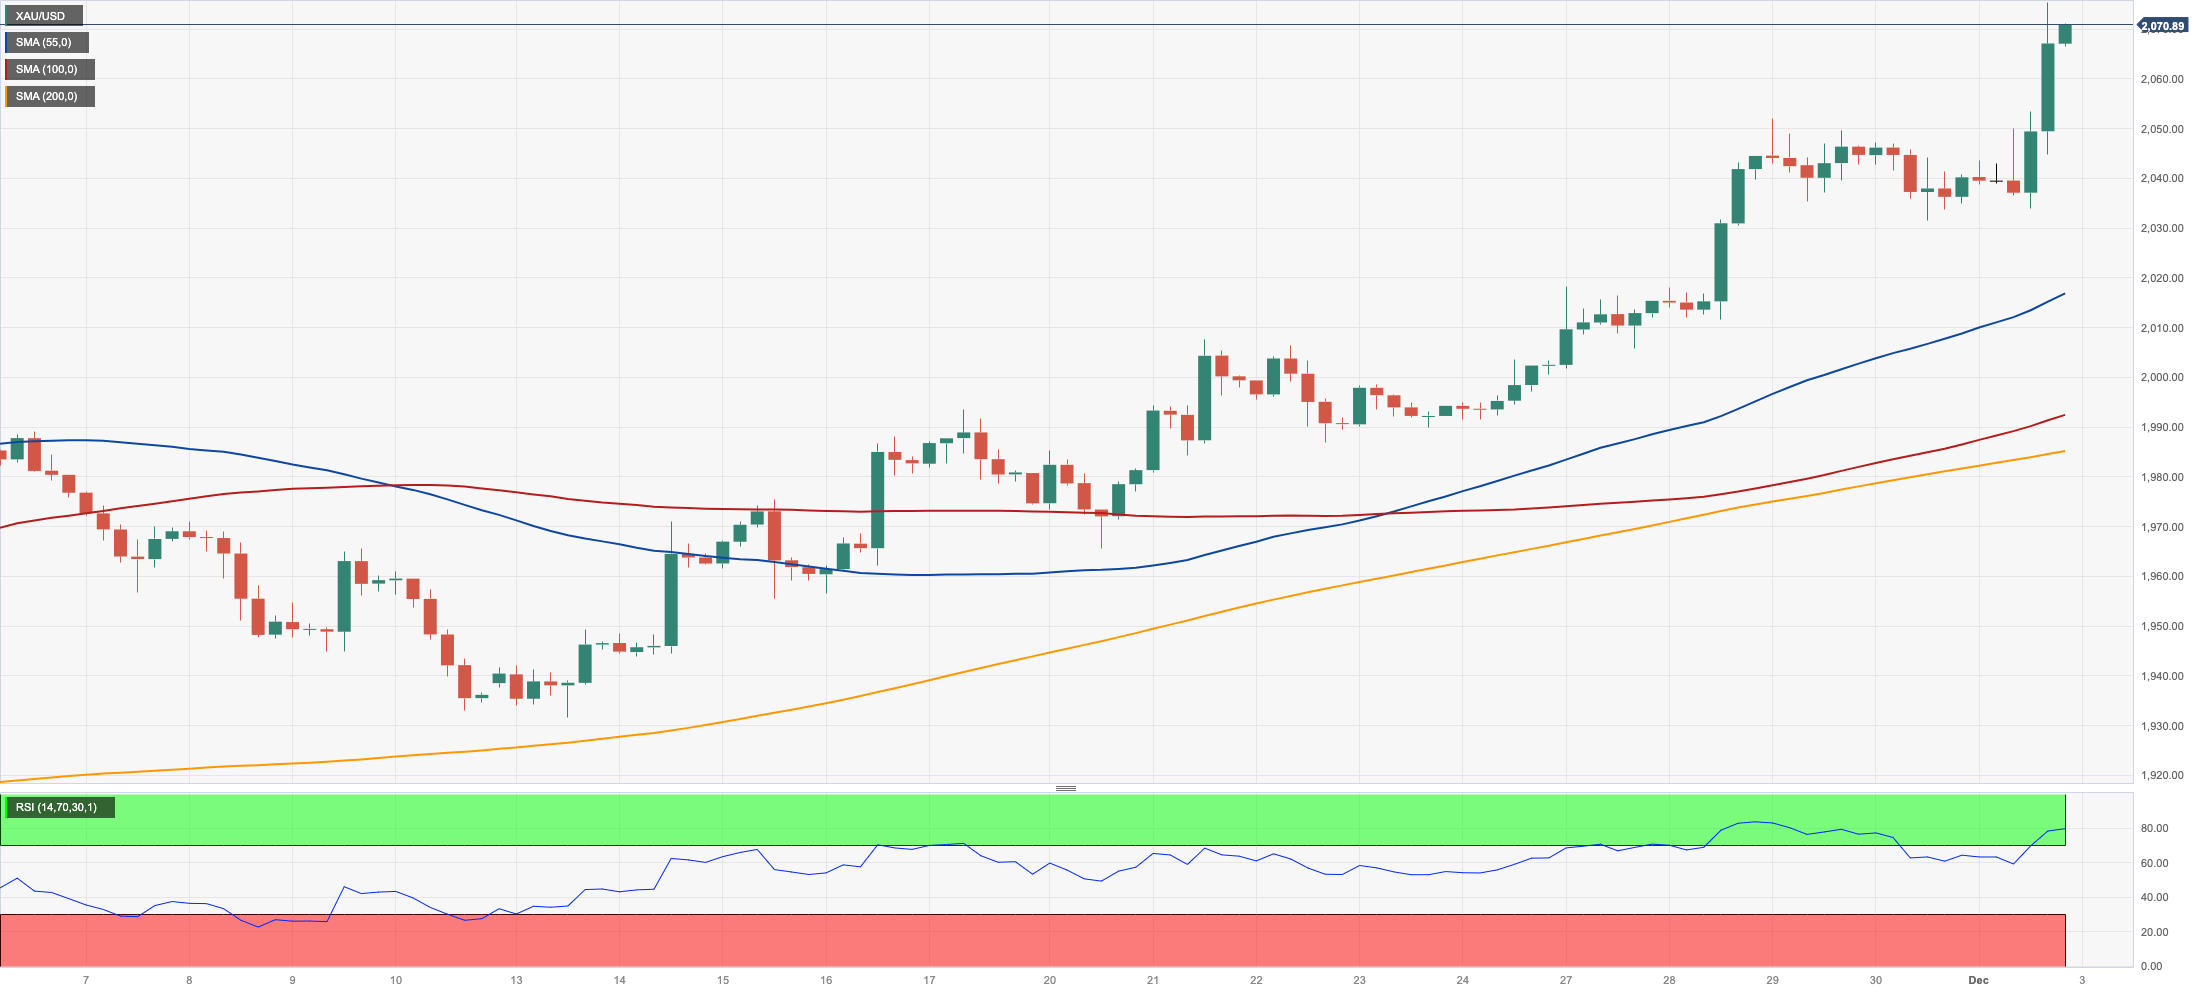
Prices of the troy ounce of gold rose to new all-time highs around $2075 on Friday.
The continuation of the sharp rally in the precious metal came in response to the strong decline in the dollar, falling US yields, and investors’ repricing of the likelihood that the Fed could start reducing its interest rates around March 2024.
Following the recent price action, the yellow metal managed to clinch its third consecutive week of gains, while it has gained nearly 15% since its October lows in the $1810 region.
The next upward hurdle for gold is the all-time high of $2075 (December 1). Instead, negative attempts may occasionally send gold down to the 200-day SMA around $1945 before the November low of $1931 (November 13). Once this level is breached, the October low of $1810 (October 6) might be in play, followed by the 2023 low of $1804 (February 28) and the key $1800 contention zone.
Resistance levels: $2075 $2080 $2100 (4H chart)
Support levels: $2031 $1983 $1965 (4H chart)
CRUDE WTI
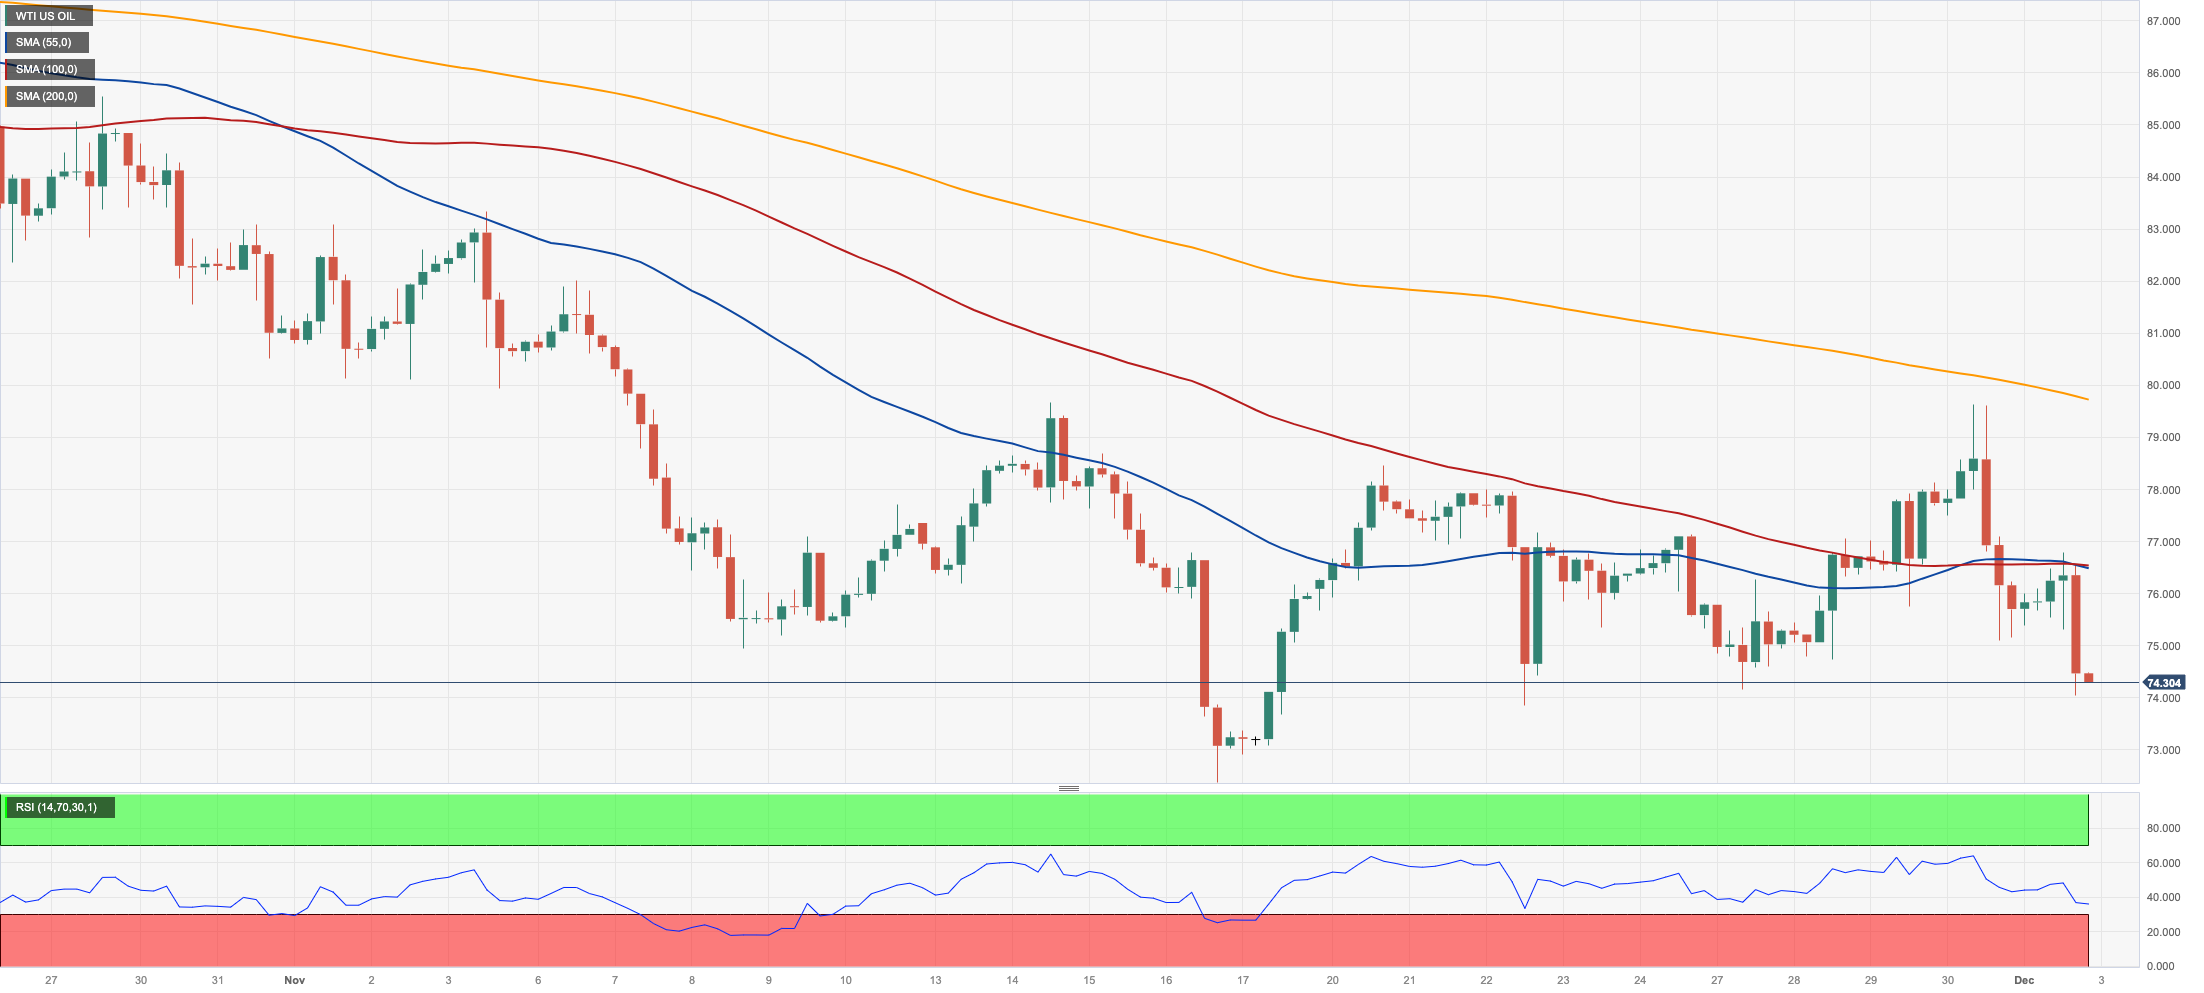
WTI prices tumbled further and printed multi-session lows in the sub-$74.00 mark per barrel on Friday.
Extra losses in the commodity followed persistent traders’ scepticism surrounding Thursday’s announcement that the OPEC+ will extend further its oil output cuts to Q1 2024.
Also weighing on the downward bias in prices emerged discouraging results from the manufacturing sector in Europe as well as the unexpected deceleration in US ISM Manufacturing.
Closing the weekly docket, driller Baker Hughes reported that the total US oil rig count went up by 5 to 505 in the week to December 1.
Immediately to the downside for WTI aligns the November low of $72.22 (November 16), prior to the 2023 bottom of $63.61 (May 4), and the important $60.00 yardstick. On the upside, the surpass of the key 200-day SMA at $78.06 could put a test of the significant $80.00 mark back on the radar, closely followed by the November high of $80.15. (November 3). North from here comes the weekly tops of $89.83 (October 18), $94.99 (September 28), and $97.65 (August 30, 2022), all anticipating the psychological $100.00 threshold.
Resistance levels: $79.56 $83.56 $85.85 (4H chart)
Support levels: $73.96 $72.13 $70.18 (4H chart)
GER40
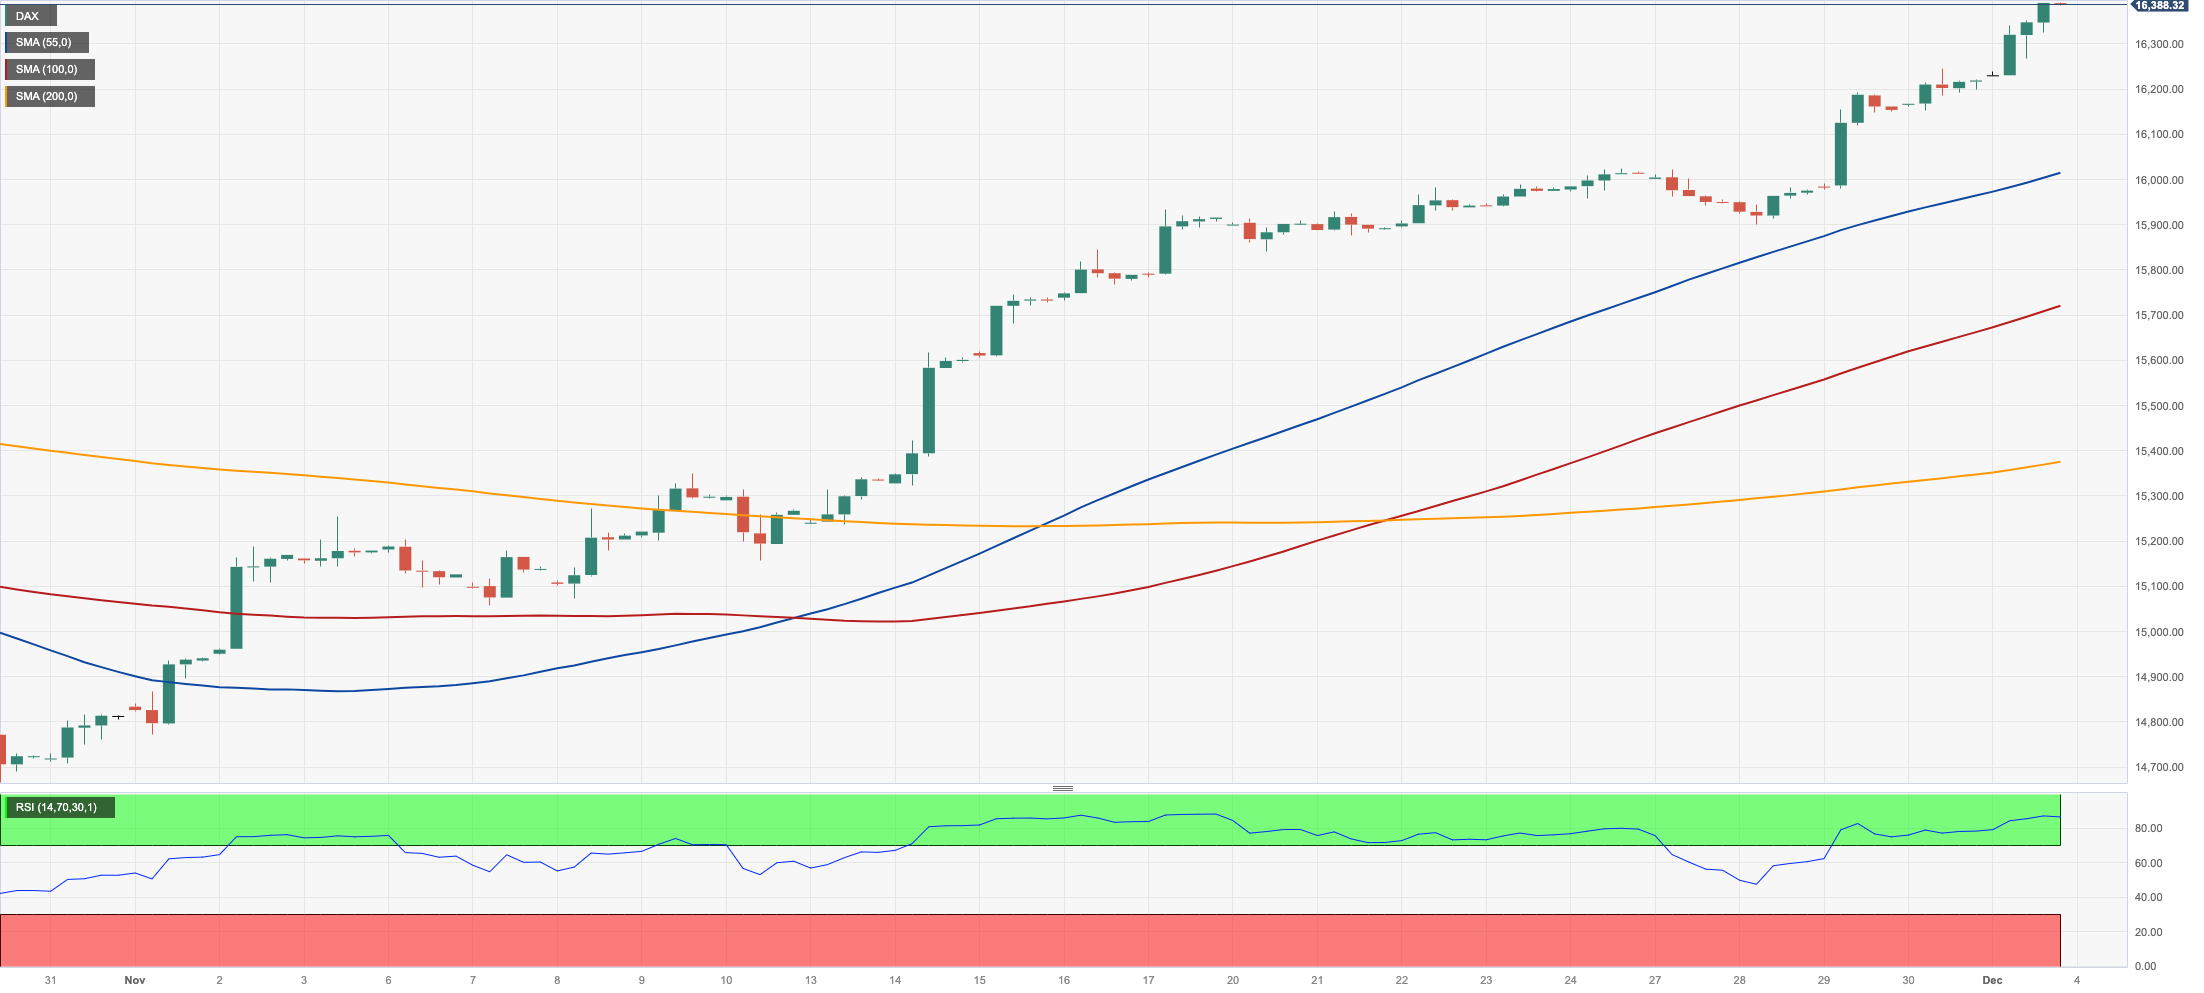
A promising start to the new month saw Germany’s reference DAX40 advance to the boundaries of the 16400 zone for the first time since August on Friday.
The continuation of the sharp advance in the index came on the back of the generalized optimism among market participants and a firm appetite for risky assets.
The above appeared bolstered by encouraging prints from the Chinese manufacturing sector and persevering speculation that the ECB will most likely extend its pause until Q2 2024.
The sharp daily advance in the index came in contrast to another negative session in the 10-year bund yields, this time plummeting to 2.35%, the lowest level since mid-July.
Further gains might propel the DAX40 to the all-time high of 16528 (July 31). Early support, on the other hand, may be found at the 200-day SMA of 15682, which is above the intermediate 55-day SMA of 15390. If this zone is breached, the October bottom of 14630 (October 23) may be retested before the March low of 14458 is achieved (March 20). Near 80, the daily RSI remained in the overbought territory.
Best Performers: Covestro, Siemens Energy AG, Vonovia
Worst Performers: Sartorius AG VZO, Bayer, Merck
Resistance levels: 16399 16528 (4H chart)
Support levels: 15915 15459 15171 (4H chart)
NASDAQ
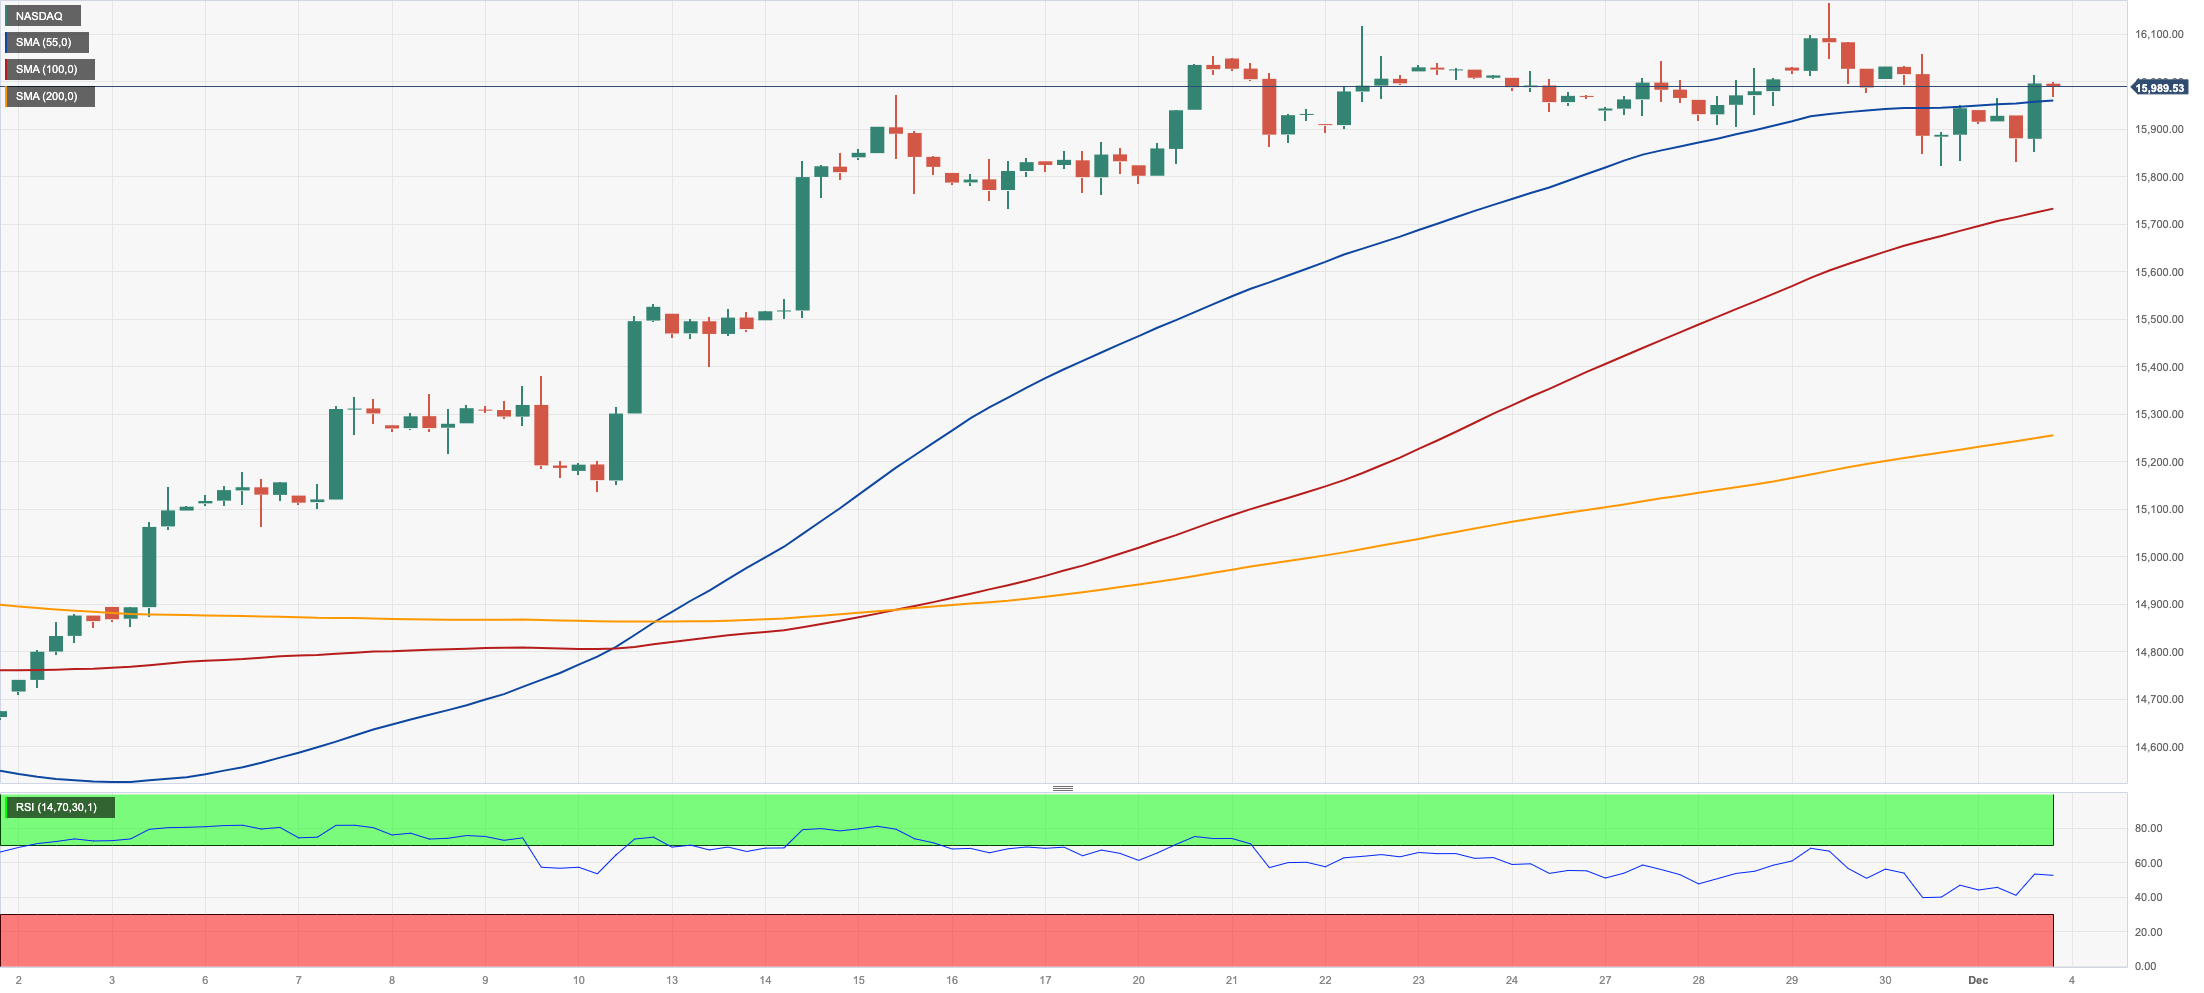
US tech equities regained the smile and pushed the benchmark Nasdaq 100 to the 16000 zone at the end of the week, leaving behind two daily pullbacks in a row.
The resurgence of strong selling sentiment in the greenback, coupled with the noticeable move lower in US yields across the curve, lent support to the index.
In addition, rising bets on potential rate cuts by the Fed early in 2024 also contributed to the daily gains in the tech sector.
Further upside in the Nasdaq now look to another test of the 2023 top of 16166 (November 29) before the December 2021 peak of 16607 (December 28) and the all-time high of 16764 (November 22 2021). The other way around, the 55-day SMA of 15125 should provide transitory contention before the key 200-day SMA of 14336 and the October low of 14058 (October 26). Further losses may put the April low of 12724 (April 25) to the test, as well as the March low of 11695 (March 13) and the 2023 low of 10696 (January 3). On the daily chart, the RSI edges higher and trespassed 67.
Top Gainers: Warner Bros Discovery, Illumina, Airbnb
Top Losers: Marvell, Intel, Netflix
Resistance levels: 16166 16607 16764 (4H chart)
Support levels: 15738 15215 14058 (4H chart)
DOW JONES
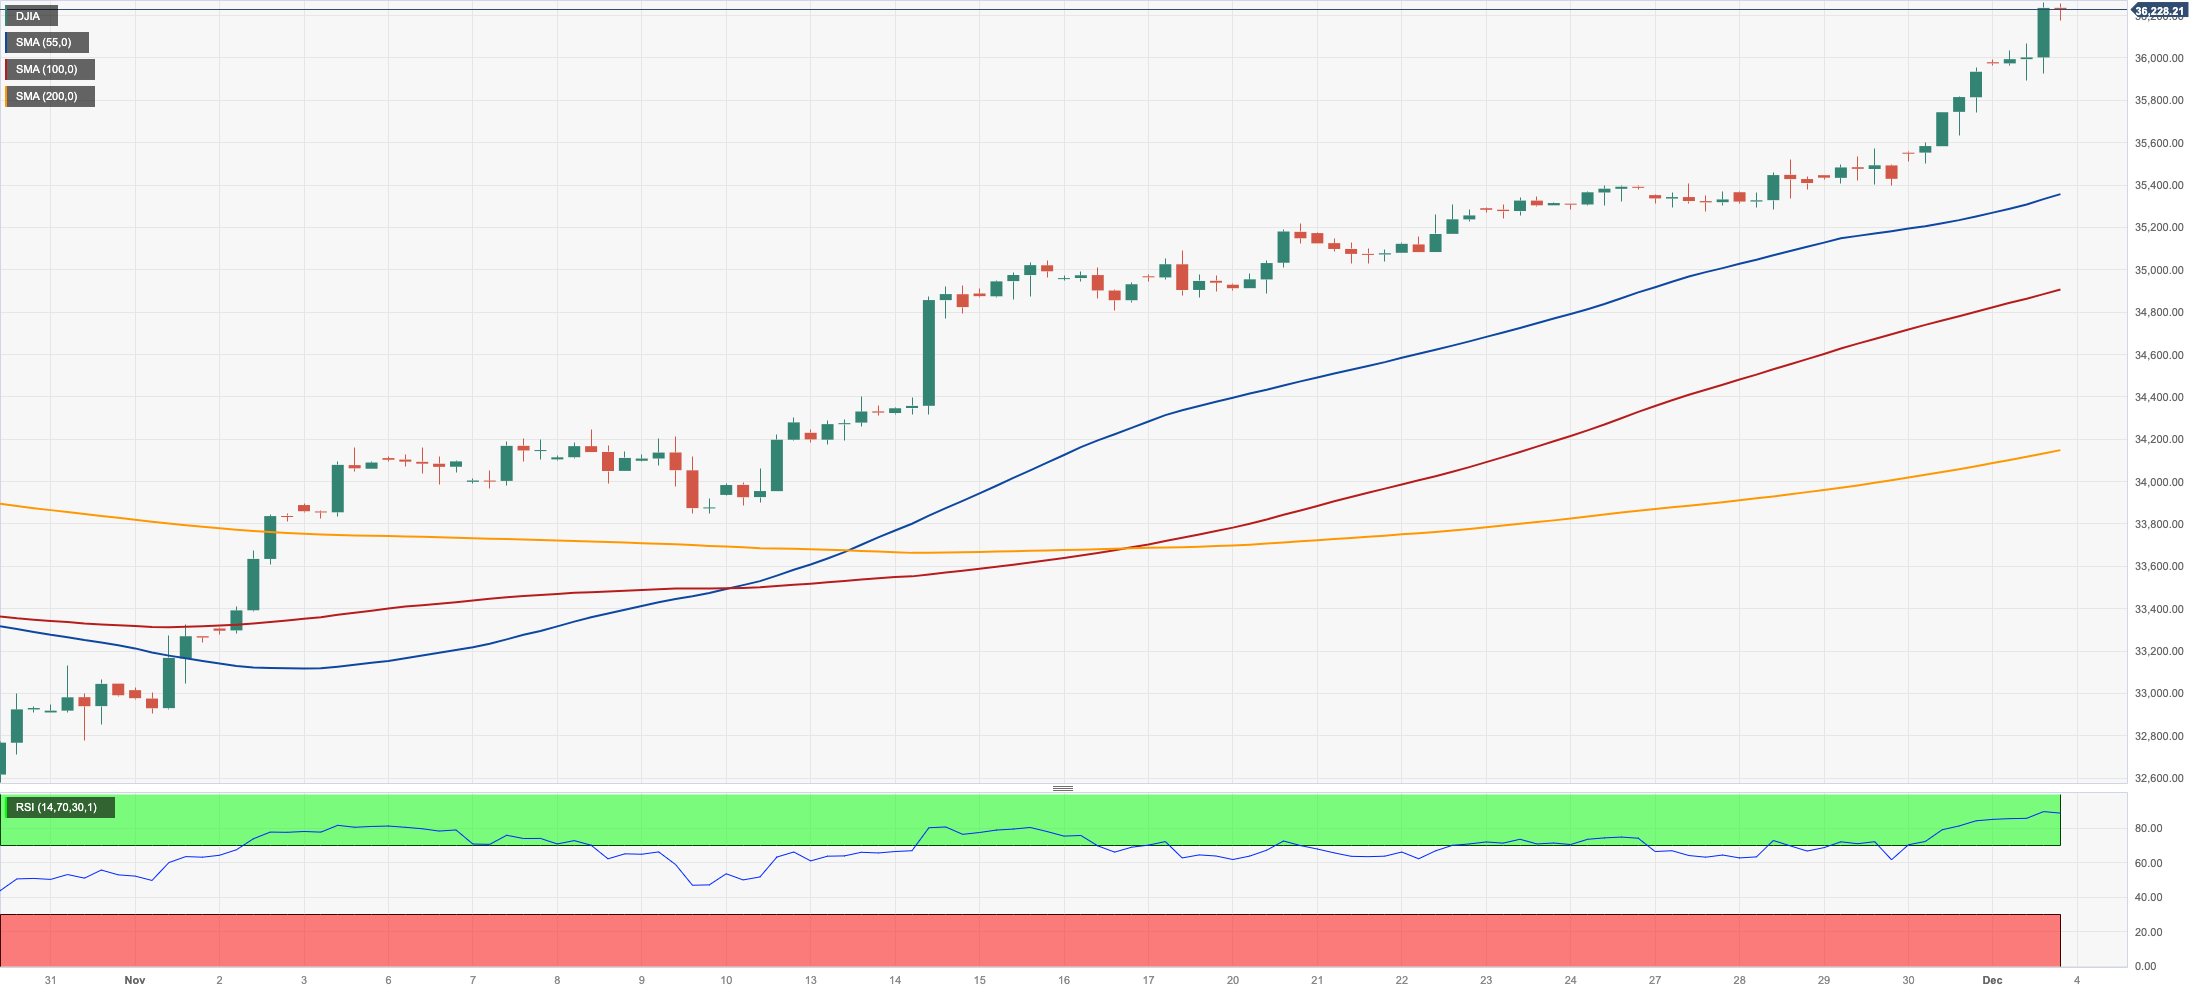
Another positive session lifted the US stock benchmark Dow Jones to new yearly highs near the 36300 region on Friday.
Further gains in the index were propped up by firmer market chatter that the Federal Reserve might cut its interest rate by March 2024, while the marked retracement in US yields also reinforced this view despite Chair Powell warning against rising bets on the Fed's easing.
At the end of the week, the Dow Jones advanced 0.82% to 36245, the S&P500 gained 0.59% to 4594, and the tech-heavy Nasdaq Composite rose 0.55% to 14305.
If the Dow Jones exceeds the 2023 peak of 36264 (December 1), it may challenge the all-time high of 36952 (January 5, 2022) before reaching the round level of 37000. On the contrary, there is temporary support at the 100-day SMA of 34433, seconded by the 200-day SMA of 33902 and the weekly low of 33859 (November 7). The October low of 32327 (October 27) appears further south, ahead of the March low of 31429 (March 15) and the 2022 low of 28660 (October 13). The daily RSI remained well in the overbought zone past 80.
Top Performers: Walgreen Boots, Nike, Salesforce Inc
Worst Performers: Intel, Microsoft, Walmart
Resistance levels: 36264 36513 36952 (4H chart)
Support levels: 34434 33859 32327 (4H chart)
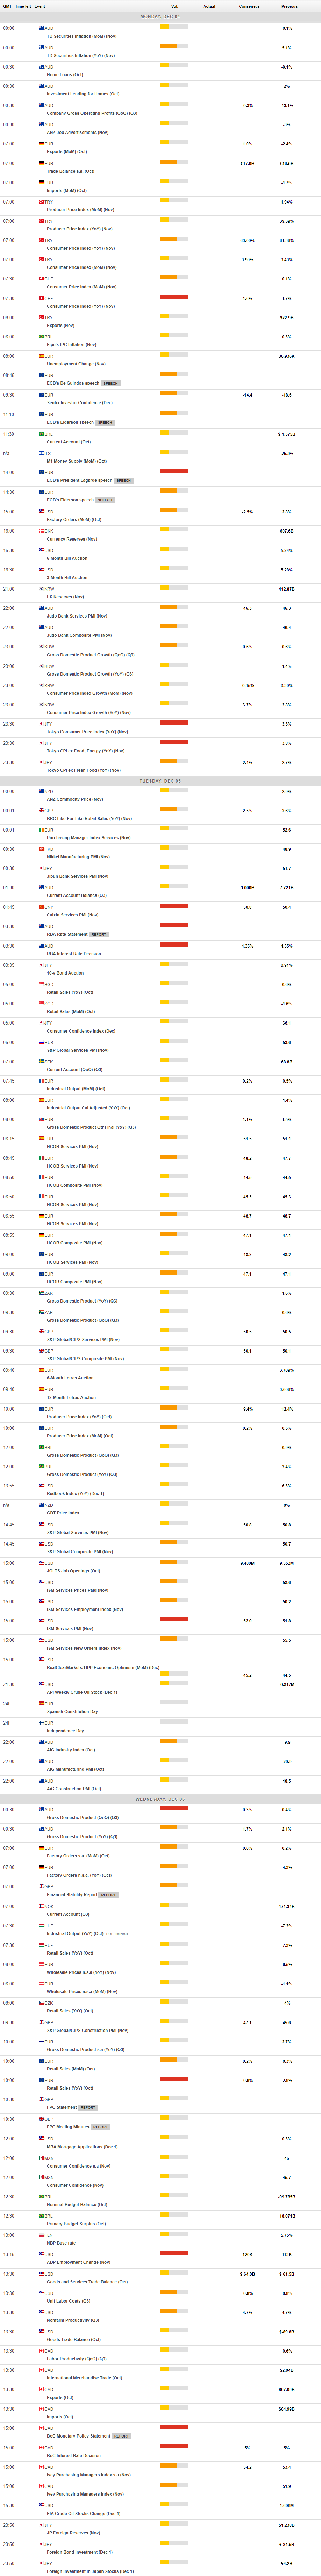
MACROECONOMIC EVENTS
All Information & Updates provided by:

All information relating to the financial markets available on this page has been prepared and issued by FXStreet (Forexstreet SL, Spain, Reg: B62498233) on the basis of publicly available information and all information believed to be reliable and does not conflict with Kuwaiti local laws, and all necessary care has been taken to before the company to ensure that the facts mentioned are correct from the source.
NCM Investment nor any of its directors or employees shall in any way be held responsible for the contents of this news, and the information contained on this page is intended only to provide clients with publicly available information and should not be construed as investment advice, report or analysis and/or constitute an offer or invitation to buy or sell financial instruments of any kind.
RISK WARNING: Forex and CFDs are highly risky leveraged products, as losses can exceed deposits. Please ensure you understand all the risks and take independent advice if necessary. NCM will segregate the clients based on the criteria of the regulator and its bylaws. NCM does not provide any advisory service; the material published does not constitute advice or a recommendation for a transaction in any financial instrument. NCM accepts no responsibility for any use of the content presented and any consequences of that use. Anyone acting on the information provided does so at their own risk.