
- Contact Us:
-

-

-

-


Daily Market Updates
05 Dec 2023
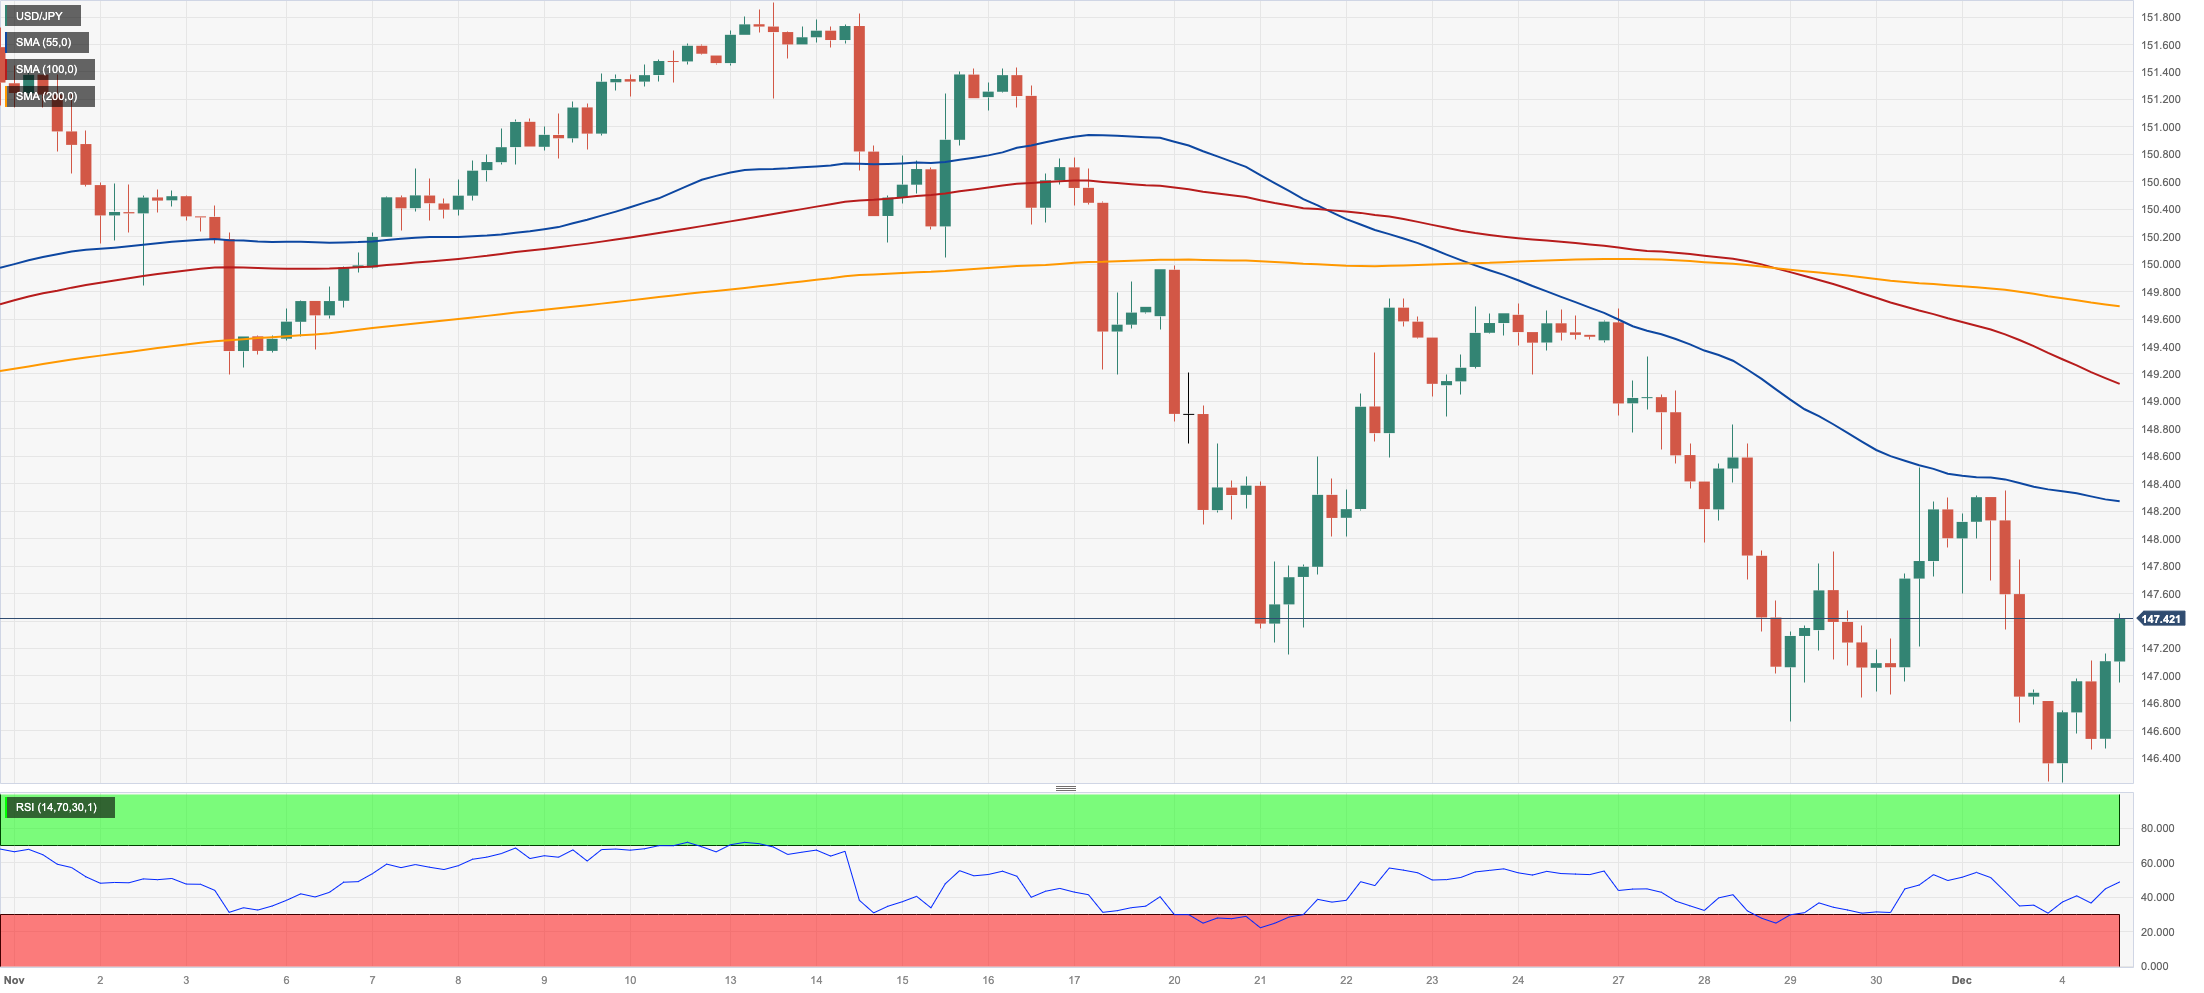
USDJPY
After hitting three-month lows near 146.20, USD/JPY managed to regain some balance and end the session with decent gains past the 147.00 barrier on Monday.
The strong recovery of the pair came in response to the equally robust move higher in the greenback and the resumption of the upside bias in US yields across the curve.
Meanwhile, in Japan, the JGB 10-year yields kicked off the week on the back foot after deflating to two-day lows near 0.65%.
The Japanese docket was empty at the beginning of the week.
If the December low of 146.22 (December 4) is breached, USD/JPY may confront the September low of 144.43 (September 1). There are no clear support levels below the latter until the 200-day SMA at 142.12, which is previous to the August low of 141.50 (August 7) and the July low of 137.23 (July 14). Just the opposite, immediate resistance is found at the 2023 top of 151.90 (November 13), followed by the 2022 peak of 151.94 (October 21) and the round number of 152.00. The RSI rose to the 40 zone.
Resistance levels: 148.52 149.71 151.43 (4H chart)
Support levels: 146.22 145.89 144.43 (4H chart)
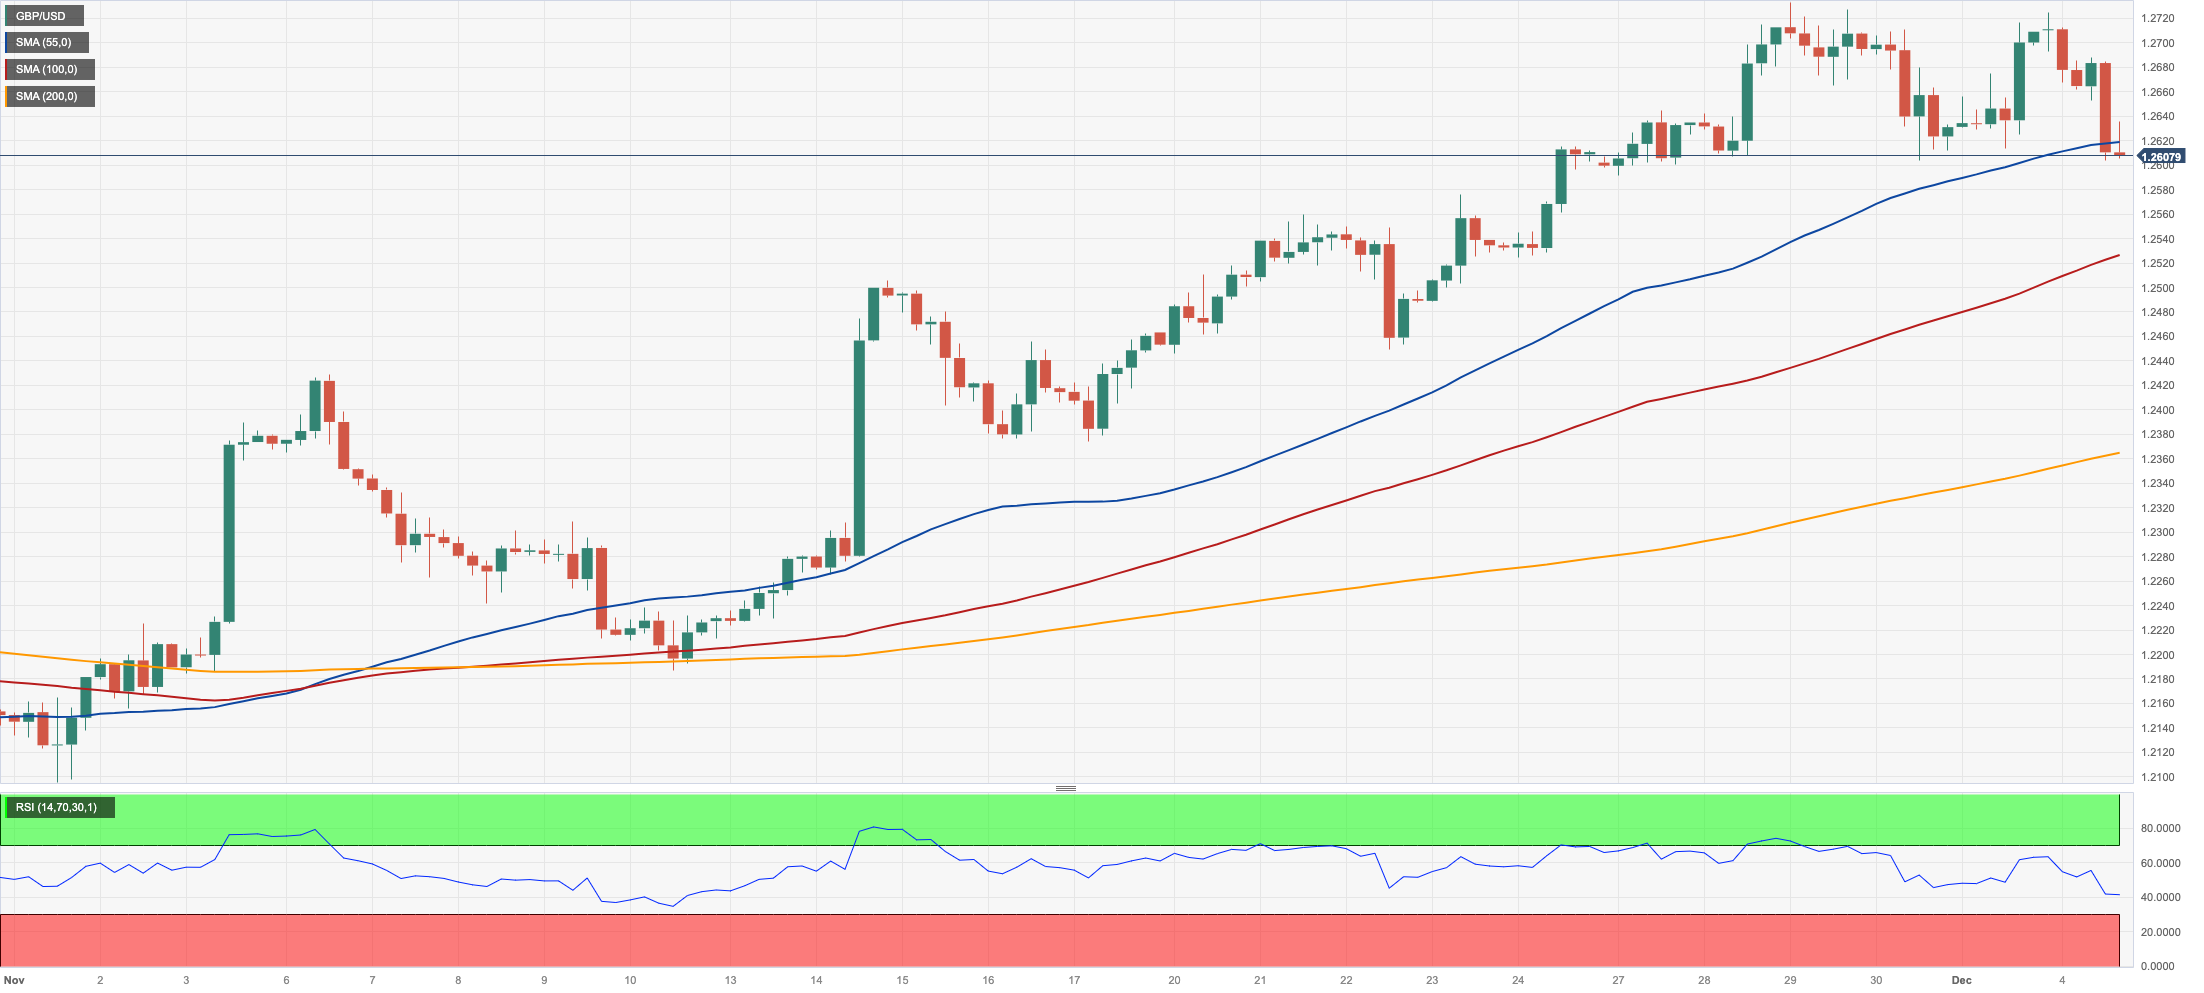
GBPUSD
Further strength in the greenback put the recent upbeat sentiment in the risk complex to the test on Monday.
Against that, GBP/USD faded Friday’s marked advance and resumed the downside, briefly testing the 1.2600 neighbourhood in the context of rising US yields and the resurgence of the selling pressure around the quid.
There were no data releases across the Channel at the beginning of the week, leaving attention to Tuesday’s Retail Sales Monitor tracked by BRC and the final Services PMI for the month of November.
The next upward hurdle for GBP/USD is the November high of 1.2733 (November 29). If this level is trespassed, the door might be opened to weekly tops of 1.2746 (August 30), 1.2818 (August 10), and 1.2995 (July 27), all of which happen before the crucial 1.3000 yardstick. The pivotal 200-day SMA at 1.2472, on the other hand, is expected to provide early contention ahead of the transitory 55-day SMA at 1.2304. The weekly low of 1.2187 (November 10) follows, seconded by weekly lows of 1.2069 (October 26) and 1.2037 (October 3), all before the critical 1.2000 level and the 2023 low of 1.1802 (March 8). The day-to-day RSI tumbled to the 61 area.
Resistance levels: 1.2715 1.2733 1.2746 (4H chart)
Support levels: 1.2603 1.2448 1.2373 (4H chart)
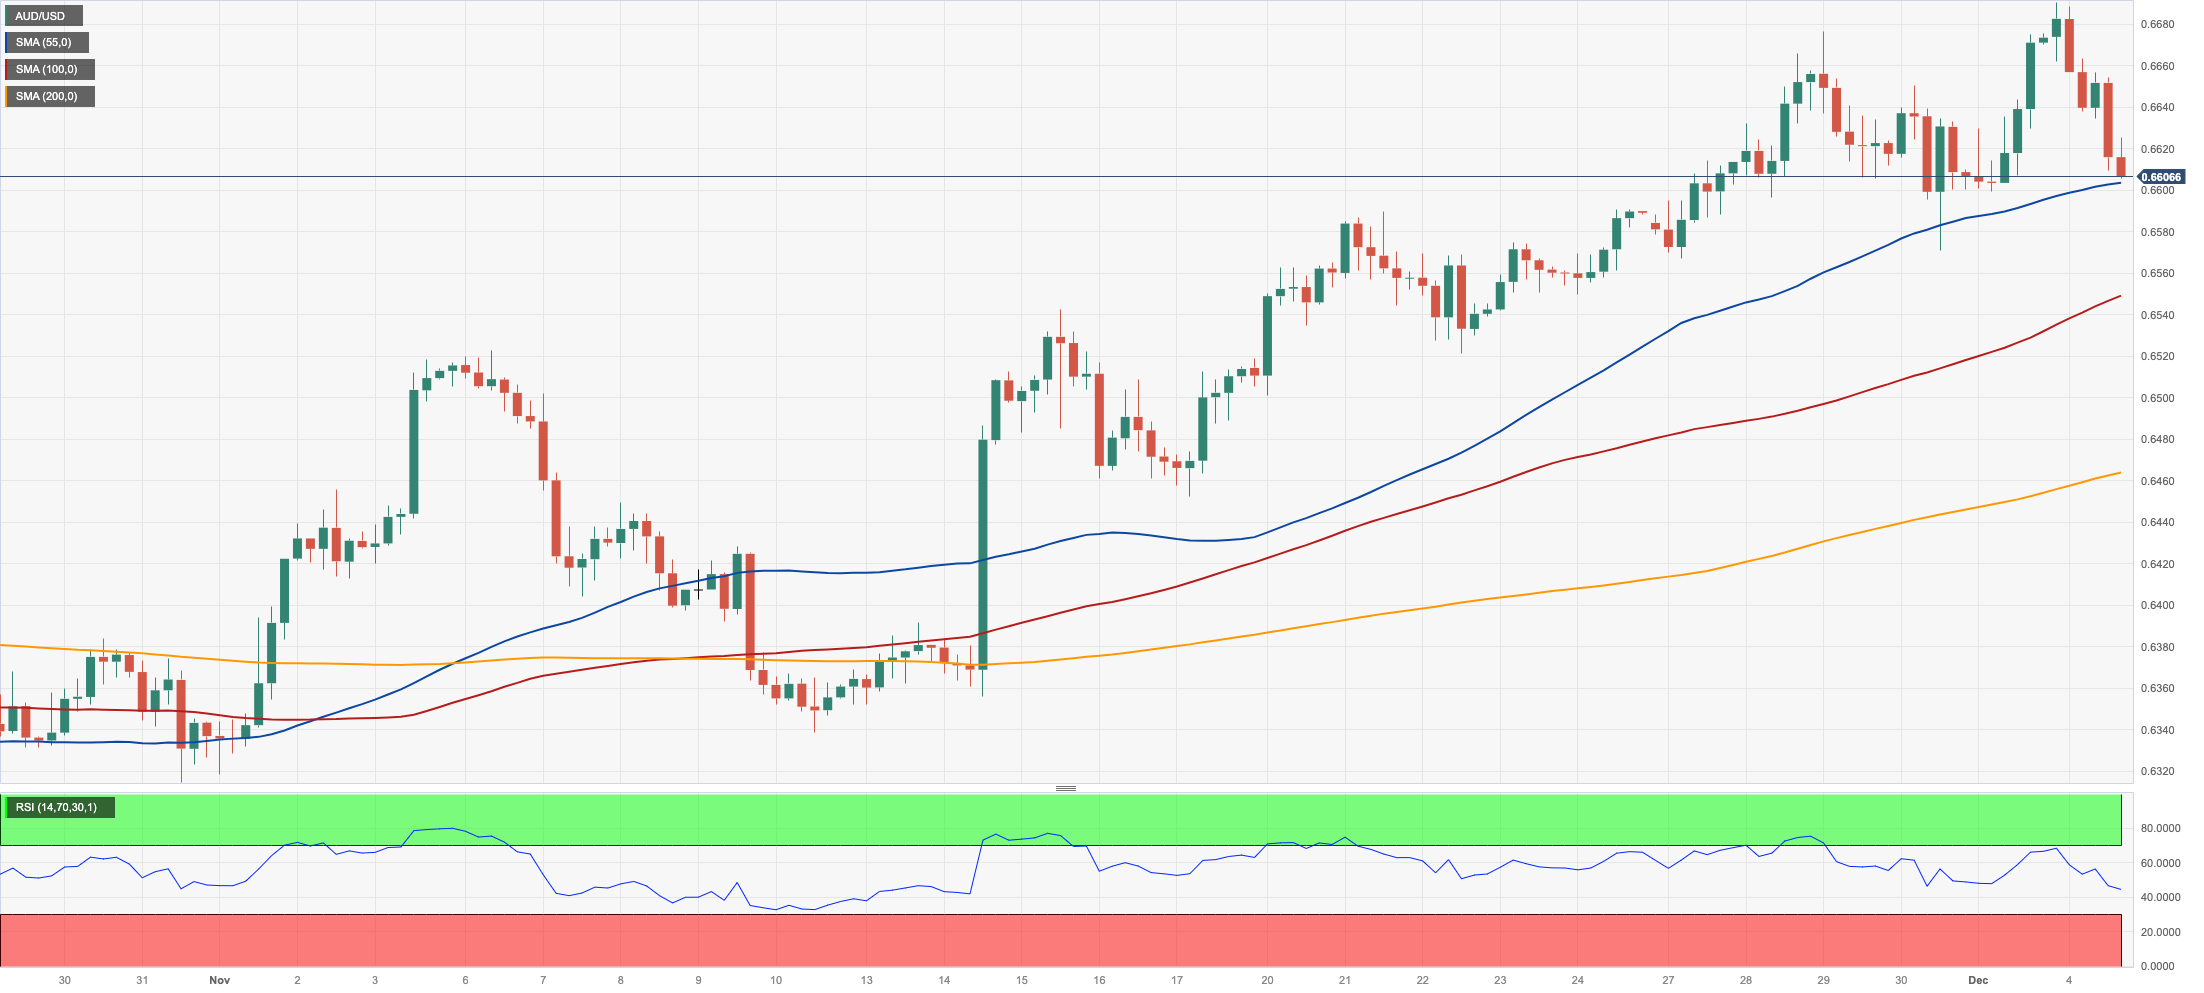
AUDUSD
It was all the way down for AUD/USD after hitting fresh four-month tops around 0.6690 early on Monday.
Indeed, the pronounced rebound in the greenback motivated spot to give away most of Friday’s intense advance, dragging it to the proximity of 0.6600 the figure.
Also contributing to the weakness around the Aussie dollar, copper prices and iron ore both started the week on the defensive, trimming part of the strong recovery seen in November.
In Oz, Home Loans expanded at a monthly 5.6% in October, while Investment Lending for Homes increased by 5% in the same period.
For AUD/USD, the December peak of 0.6690 (December 4) is immediately on the upside. A break above this level might rekindle a challenge to the July high of 0.6894 (July 14), which is slightly ahead of the June top of 0.6899 (June 16) and the key 0.7000 level. Nonetheless, the crucial 200-day SMA at 0.6578 looms as a key contention zone ahead of the temporary 55-day SMA at 0.6431. The loss of the latter could ignite a move to the 2023 bottom of 0.6270 (October 26) before the round level of 0.6200 and the 2022 low of 0.6169 (October 13). The daily RSI deflated to the 61 region.
Resistance levels: 0.6690 0.6739 0.6821 (4H chart)
Support levels: 0.6609 0.6570 0.6521 (4H chart)
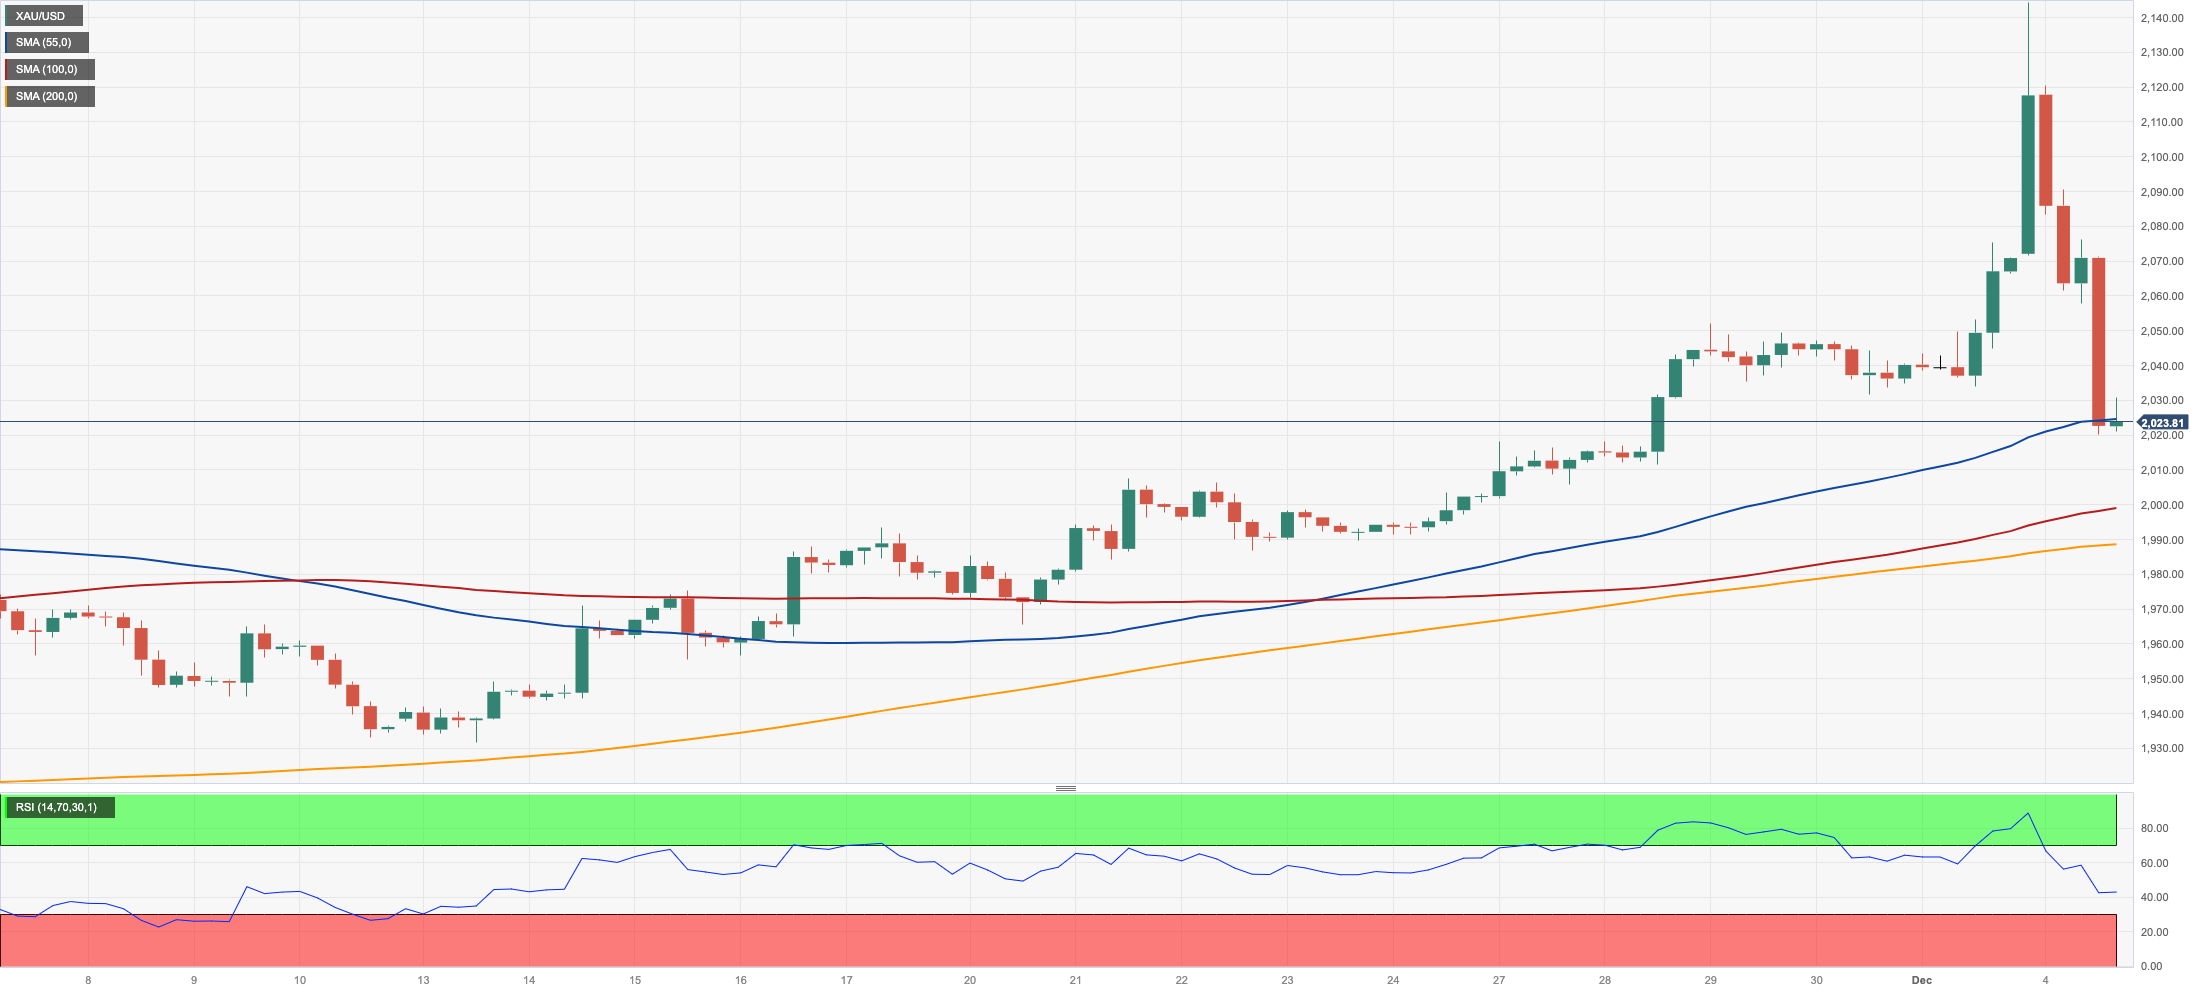
GOLD
Following an early uptick to a new all-time high around $2150 per troy ounce, gold prices reversed that move and ended the session with marked losses around the $2020 area on Monday.
The sharp bounce in the greenback, in combination with the firm performance of US yields across the board, put the precious metal under scrutiny and sponsored the corrective knee-jerk at the beginning of the week.
In the meantime, it will be an interesting week for bullion ahead of the release of key US fundamentals, particularly in the labour market, while expectations of the Fed’s easing as soon as in the spring of 2024 should provide a floor in case of bouts of weakness.
The next milestone for gold is the all-time high of $2149 (December 4). Instead, bearish attempts may possibly bring gold down to the 200-day SMA at $1946 before the November low of $1931 (November 13). Once this level is breached, the October low of $1810 (October 6) might be in play, followed by the 2023 bottom of $1804 (February 28) and the critical $1800 contention zone.
Resistance levels: $2149 (4H chart)
Support levels: $2020 $1987 $1965 (4H chart)
CRUDE WTI
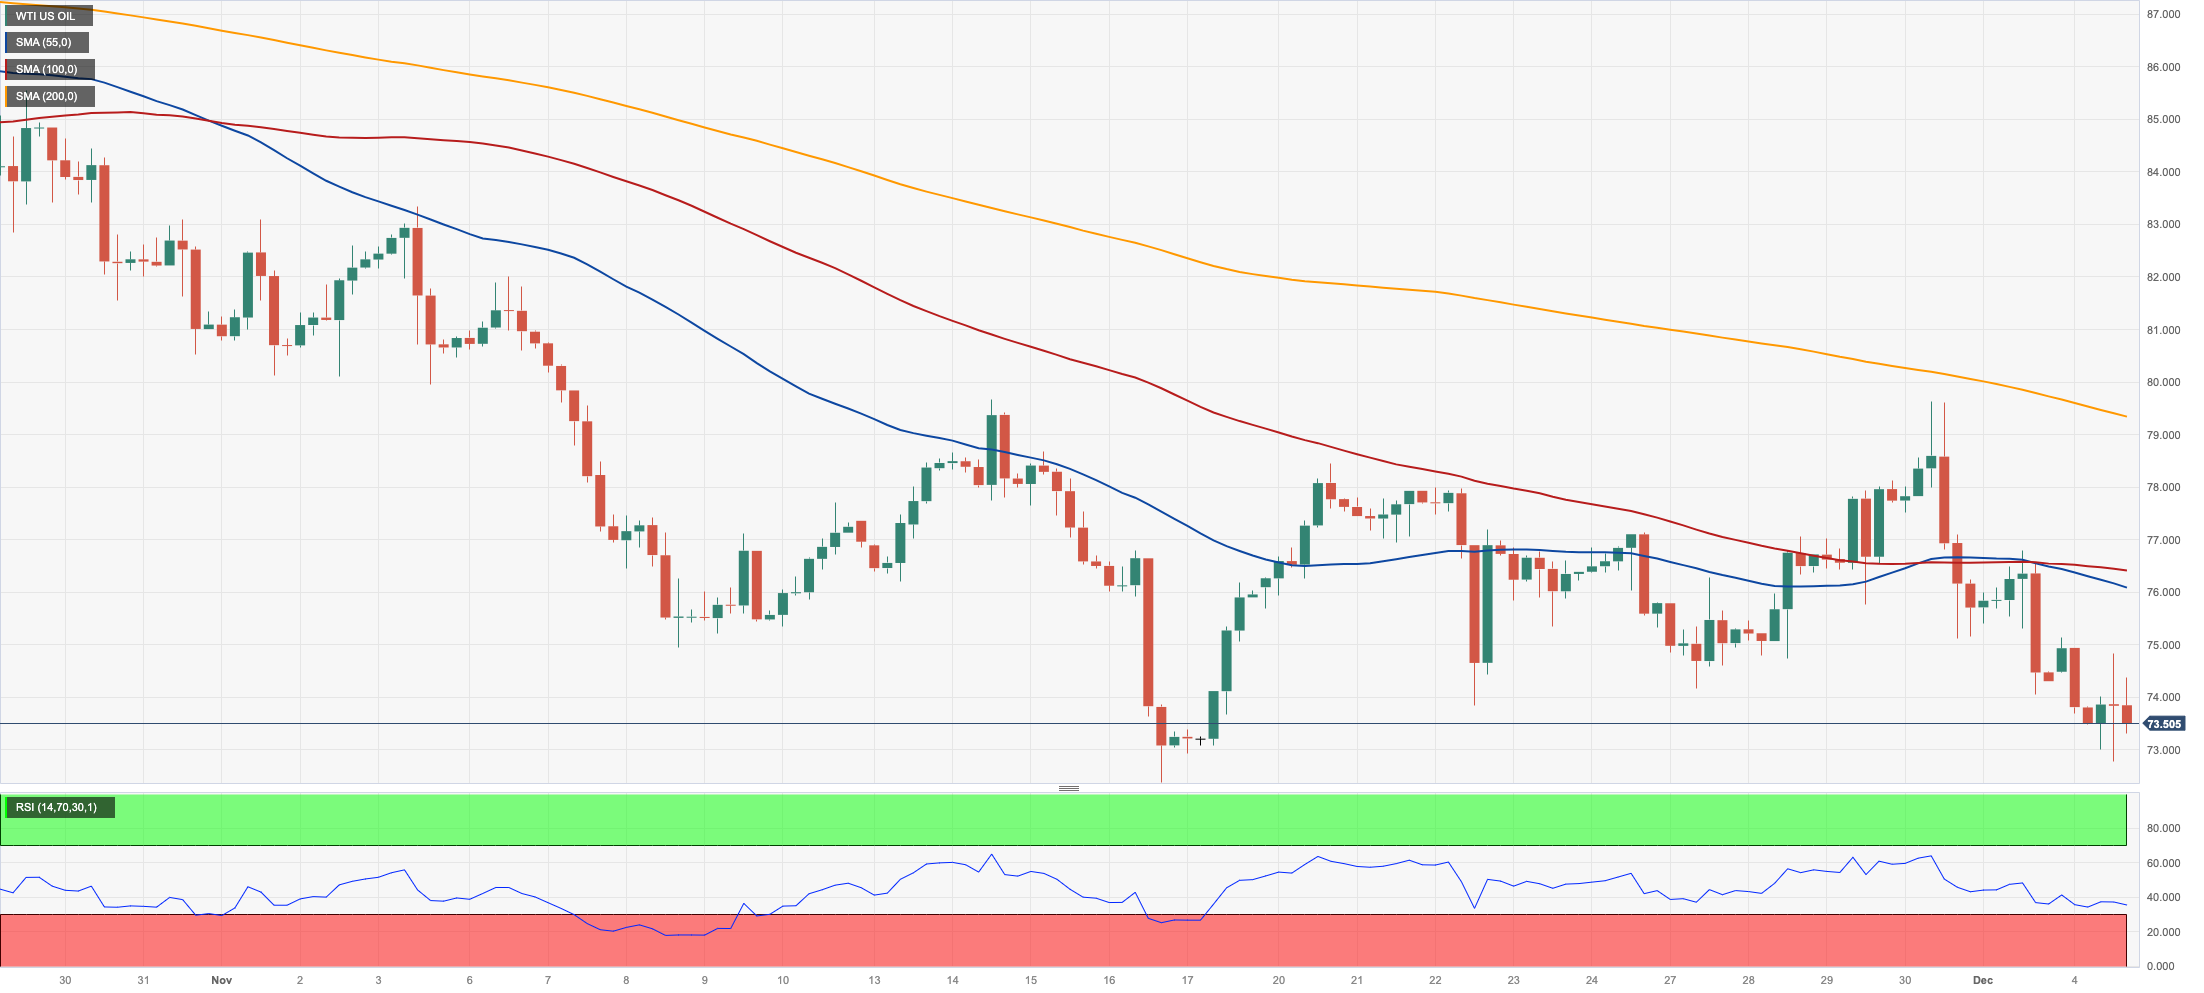
Prices of WTI retreated for the third consecutive session, breaking below the $73.00 mark per barrel to print three-week lows on Monday.
The extra retracement in the commodity came on the back of persistent scepticism among traders regarding the recent decision by the OPEC+ to voluntarily reduce oil output, while omnipresent demand concerns also added to the bearish tone at the beginning of the week.
In the meantime, geopolitical jitters associated with potential supply disruptions should maintain occasional selling pressure somewhat contained.
WTI's immediate downward targets include the November low of $72.22 (November 16), ahead of the 2023 bottom of $63.61 (May 4), and the key $60.00 yardstick. Having said that, a break above the critical 200-day SMA at $78.05 might reintroduce a challenge of the significant $80.00 level, closely followed by the November high of $80.15 (November 3). Weekly tops of $89.83 (October 18), $94.99 (September 28), and $97.65 (August 30, 2022) follow, all anticipating the psychological $100.00 mark.
Resistance levels: $79.56 $83.56 $85.85 (4H chart)
Support levels: $72.60 $72.13 $70.18 (4H chart)
GER40
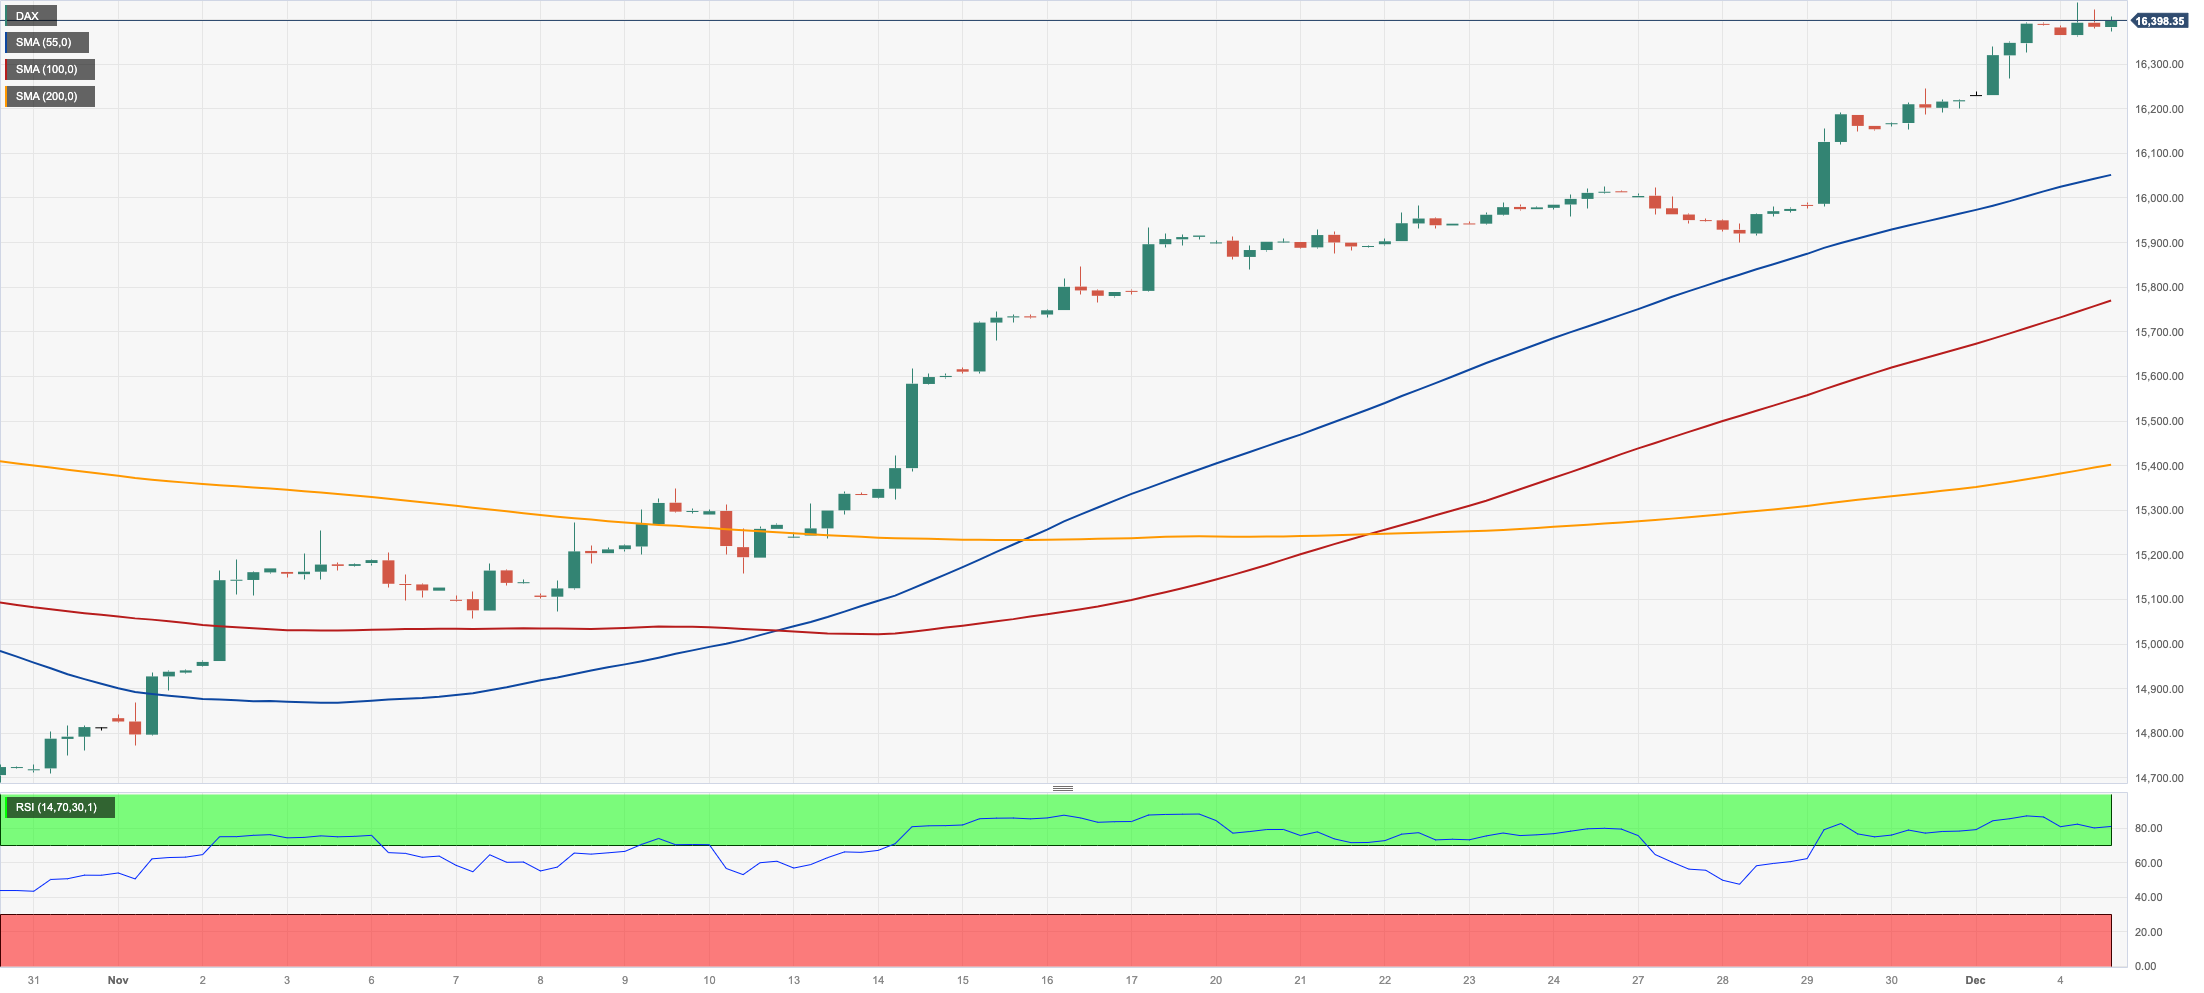
After hitting a new five-month top past the 16400 zone early on Monday, Germany’s stock benchmark DAX40 ended the session with marginal gains against the backdrop of a generalized corrective decline in most of its peers.
Extra gains in German equities remained well propped-up by the broad-based perception that the ECB (and the Fed) might start cutting rates in Q2 2024, while there was no news from ECB’s Lagarde, De Guindos and Elderson at their speeches on Monday.
The positive start of the week in the index came in contrast to the decline in. 10-year bund yields to the vicinity of 2.30% for the first time since mid-July.
Further increases might push the DAX40 to an all-time high of 16528 (July 31). Early support, on the other hand, may be found at the key 200-day SMA of 15687 prior to the intermediate 55-day SMA of 15403. If this zone is broken, the October low of 14630 (October 23) might be retested before the March low of 14458 is hit (March 20). The daily RSI stayed near 80, indicating that it was overbought.
Best Performers: Merck, Qiagen, Hannover Rueck SE
Worst Performers: MTU Aero, Siemens Healthineers, Covestro
Resistance levels: 16455 16528 (4H chart)
Support levels: 15915 15466 15171 (4H chart)
NASDAQ
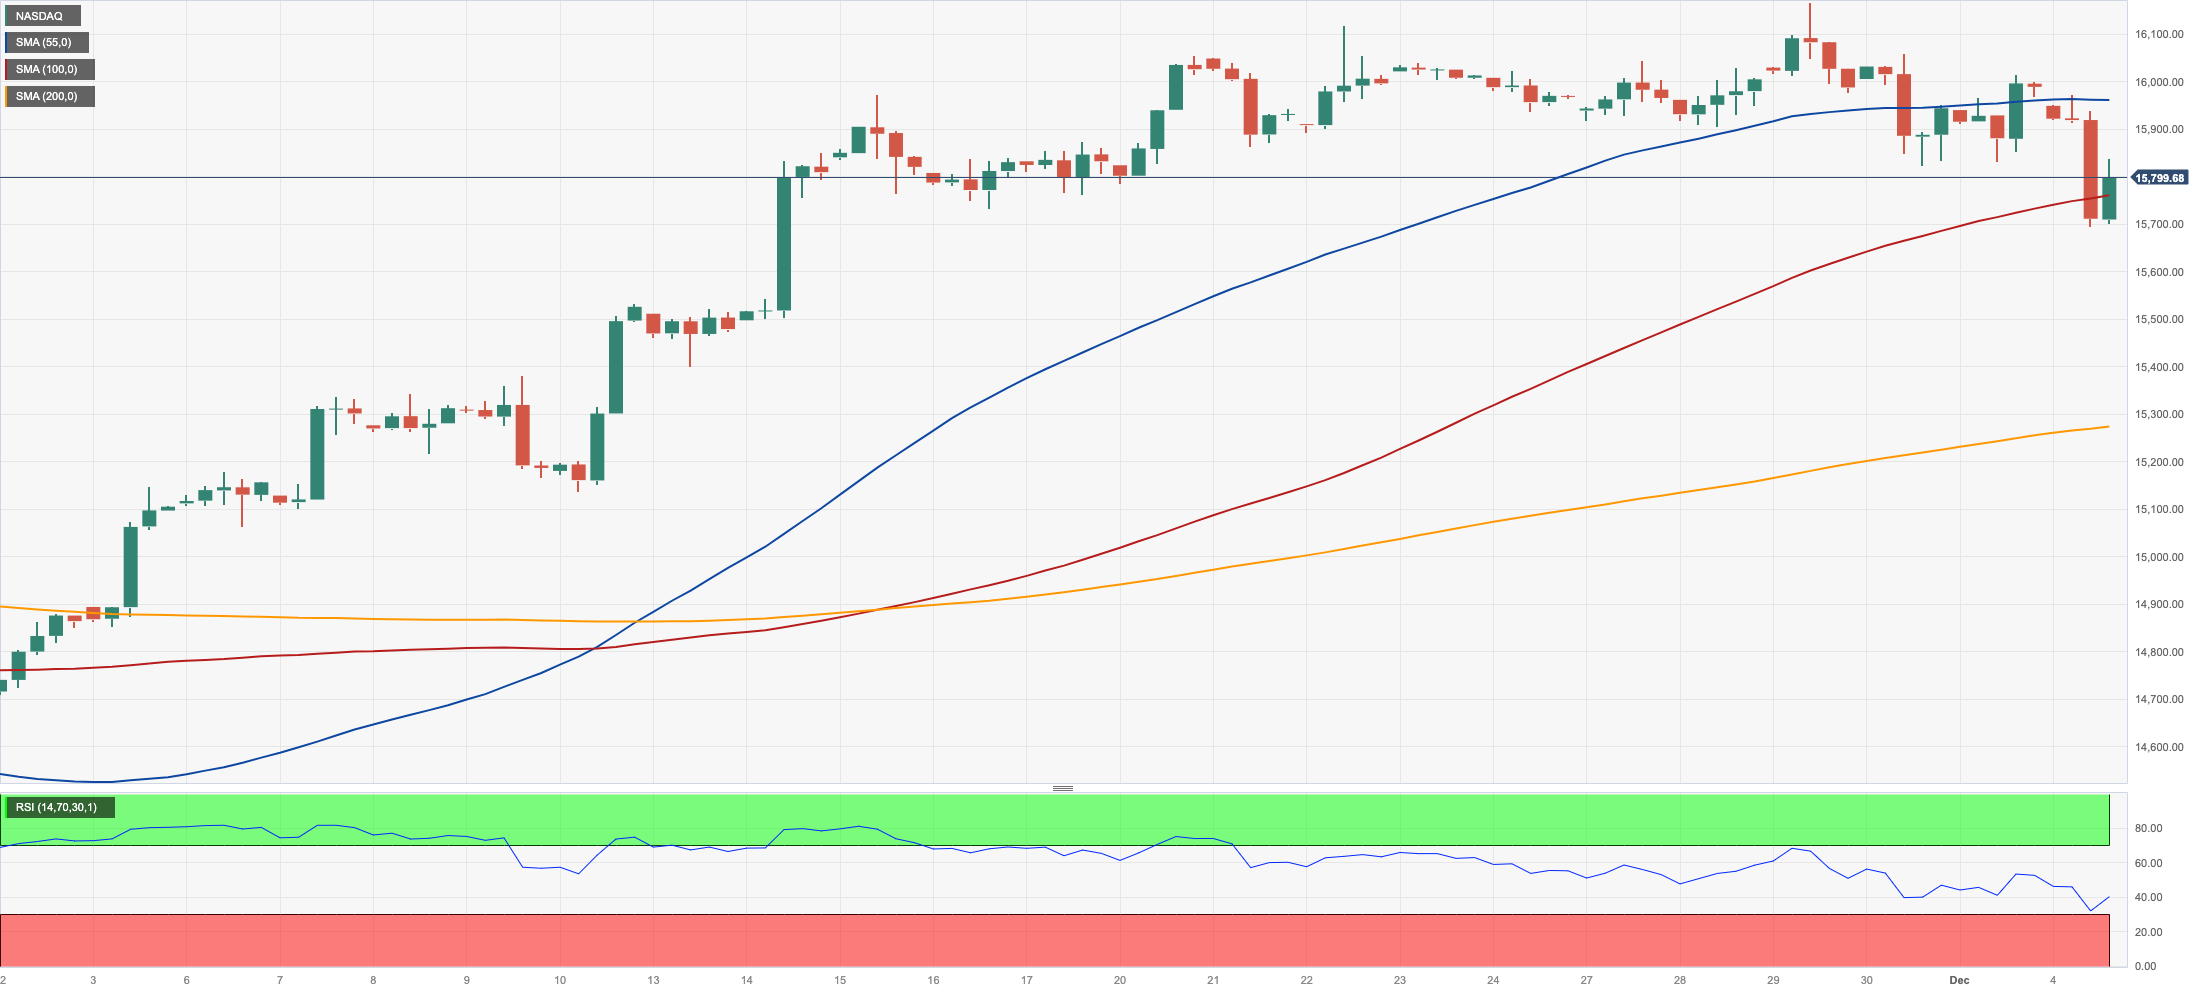
The tech reference Nasdaq 100 briefly dipped to three-week lows near 15700, where it met some decent contention on Monday.
The knee-jerk in the tech sector reversed gains recorded at the end of last week and followed the rejection from YTD peaks near 16200 recorded on November 29.
The corrective pullback in the Nasdaq 100 was also underpinned by the sharp bounce in the US dollar coupled with the strong move higher in yields, all amidst the prevailing risk-off mood.
Immediately to the upside for the Nasdaq 100 comes the 2023 top of 16166 (November 29) ahead of the December 2021 peak of 16607 (December 28) and the all-time high of 16764 (November 22 2021). In the opposite direction, the 55-day SMA of 15136 should give temporary support before the crucial 200-day SMA of 14353 and the October low of 14058 (October 26). Further losses might put the April bottom of 12724 (April 25) as well as the March low of 11695 (March 13) and the 2023 low of 10696 to the test (January 3). On the daily chart, the RSI dropped to the sub-58 area.
Top Gainers: IDEXX Labs, Illumina, Enphase
Top Losers: Sirius XM, Zoom Video, The Trade Desk
Resistance levels: 16166 16607 16764 (4H chart)
Support levels: 15695 15217 14058 (4H chart)
DOW JONES
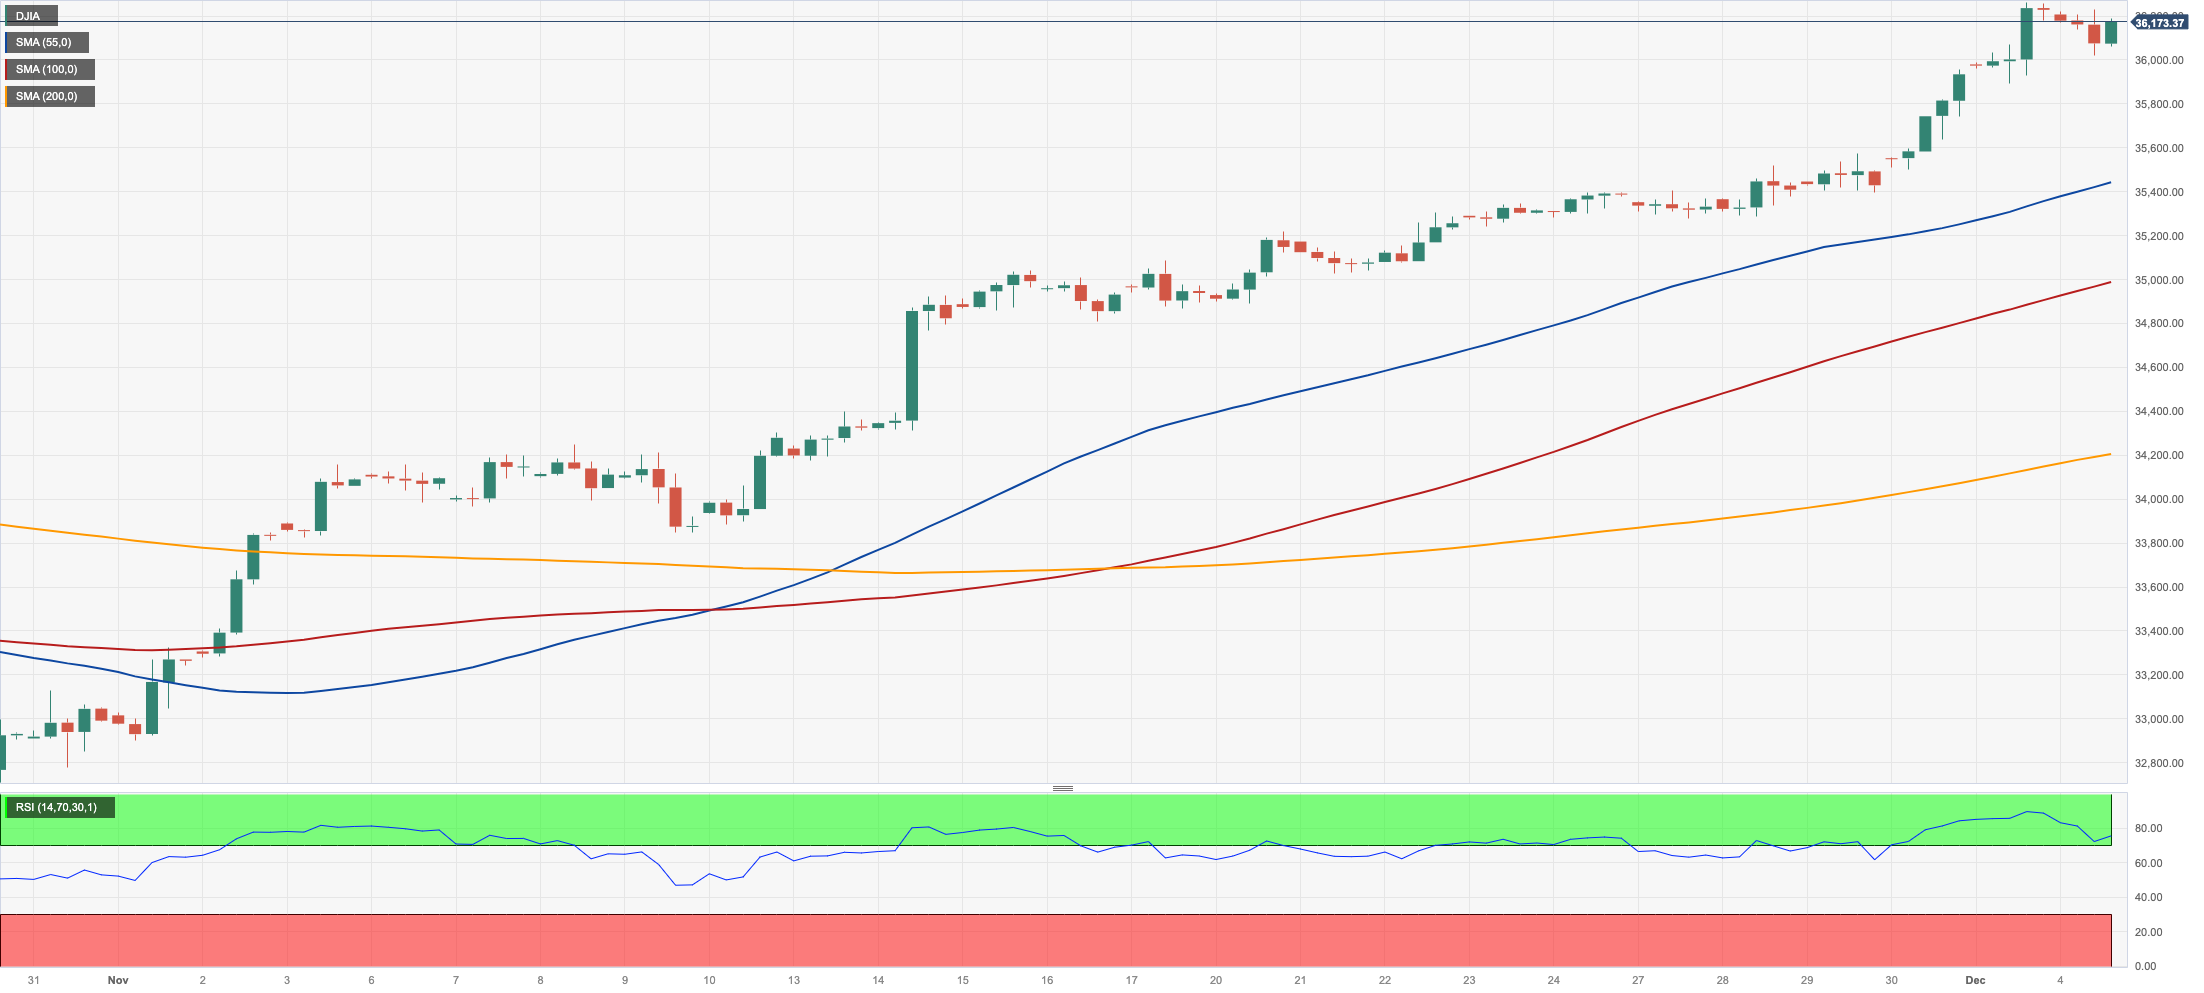
US equities tracked by the Dow Jones saw their needle-like rally face some renewed downside pressure at the beginning of the week.
Indeed, investors remained prudent ahead of key US data releases due later in the week, while they continued to digest Friday’s cautious tone from Chief Powell.
It is worth noting that market participants appear quite convinced that the Federal Reserve could start trimming the FFTR at some point in Q2 2024.
All in all, the Dow Jones retreated 0.24% to 36159, the S&P500 dropped 0.67% to 4563, and the tech-focused Nasdaq Composite lost 1.10% to 14147.
If the Dow Jones reaches the 2023 top of 36264 (December 1), it may confront the all-time peak of 36952 (January 5, 2022) before hitting the round level of 37000. On the contrary, the 100-day SMA of 34451 provides brief support, seconded by the 200-day SMA of 33914 and the weekly low of 33859 (November 7). The October low (32327) appears further south, prior to the March low (31429) and the 2022 low of 28660 (October 13). The daily RSI eased a tad to 78, remaining well in the overbought zone.
Top Performers: 3M, Merck&Co, Home Depot
Worst Performers: Salesforce Inc, Intel, Microsoft
Resistance levels: 36264 36513 36952 (4H chart)
Support levels: 34443 33859 32327 (4H chart)
MACROECONOMIC EVENTS

All Information & Updates provided by:

All information relating to the financial markets available on this page has been prepared and issued by FXStreet (Forexstreet SL, Spain, Reg: B62498233) on the basis of publicly available information and all information believed to be reliable and does not conflict with Kuwaiti local laws, and all necessary care has been taken to before the company to ensure that the facts mentioned are correct from the source.
NCM Investment nor any of its directors or employees shall in any way be held responsible for the contents of this news, and the information contained on this page is intended only to provide clients with publicly available information and should not be construed as investment advice, report or analysis and/or constitute an offer or invitation to buy or sell financial instruments of any kind.
RISK WARNING: Forex and CFDs are highly risky leveraged products, as losses can exceed deposits. Please ensure you understand all the risks and take independent advice if necessary. NCM will segregate the clients based on the criteria of the regulator and its bylaws. NCM does not provide any advisory service; the material published does not constitute advice or a recommendation for a transaction in any financial instrument. NCM accepts no responsibility for any use of the content presented and any consequences of that use. Anyone acting on the information provided does so at their own risk.