
- Contact Us:
-

-

-

-


Daily Market Updates
06 Dec 2023
USDJPY
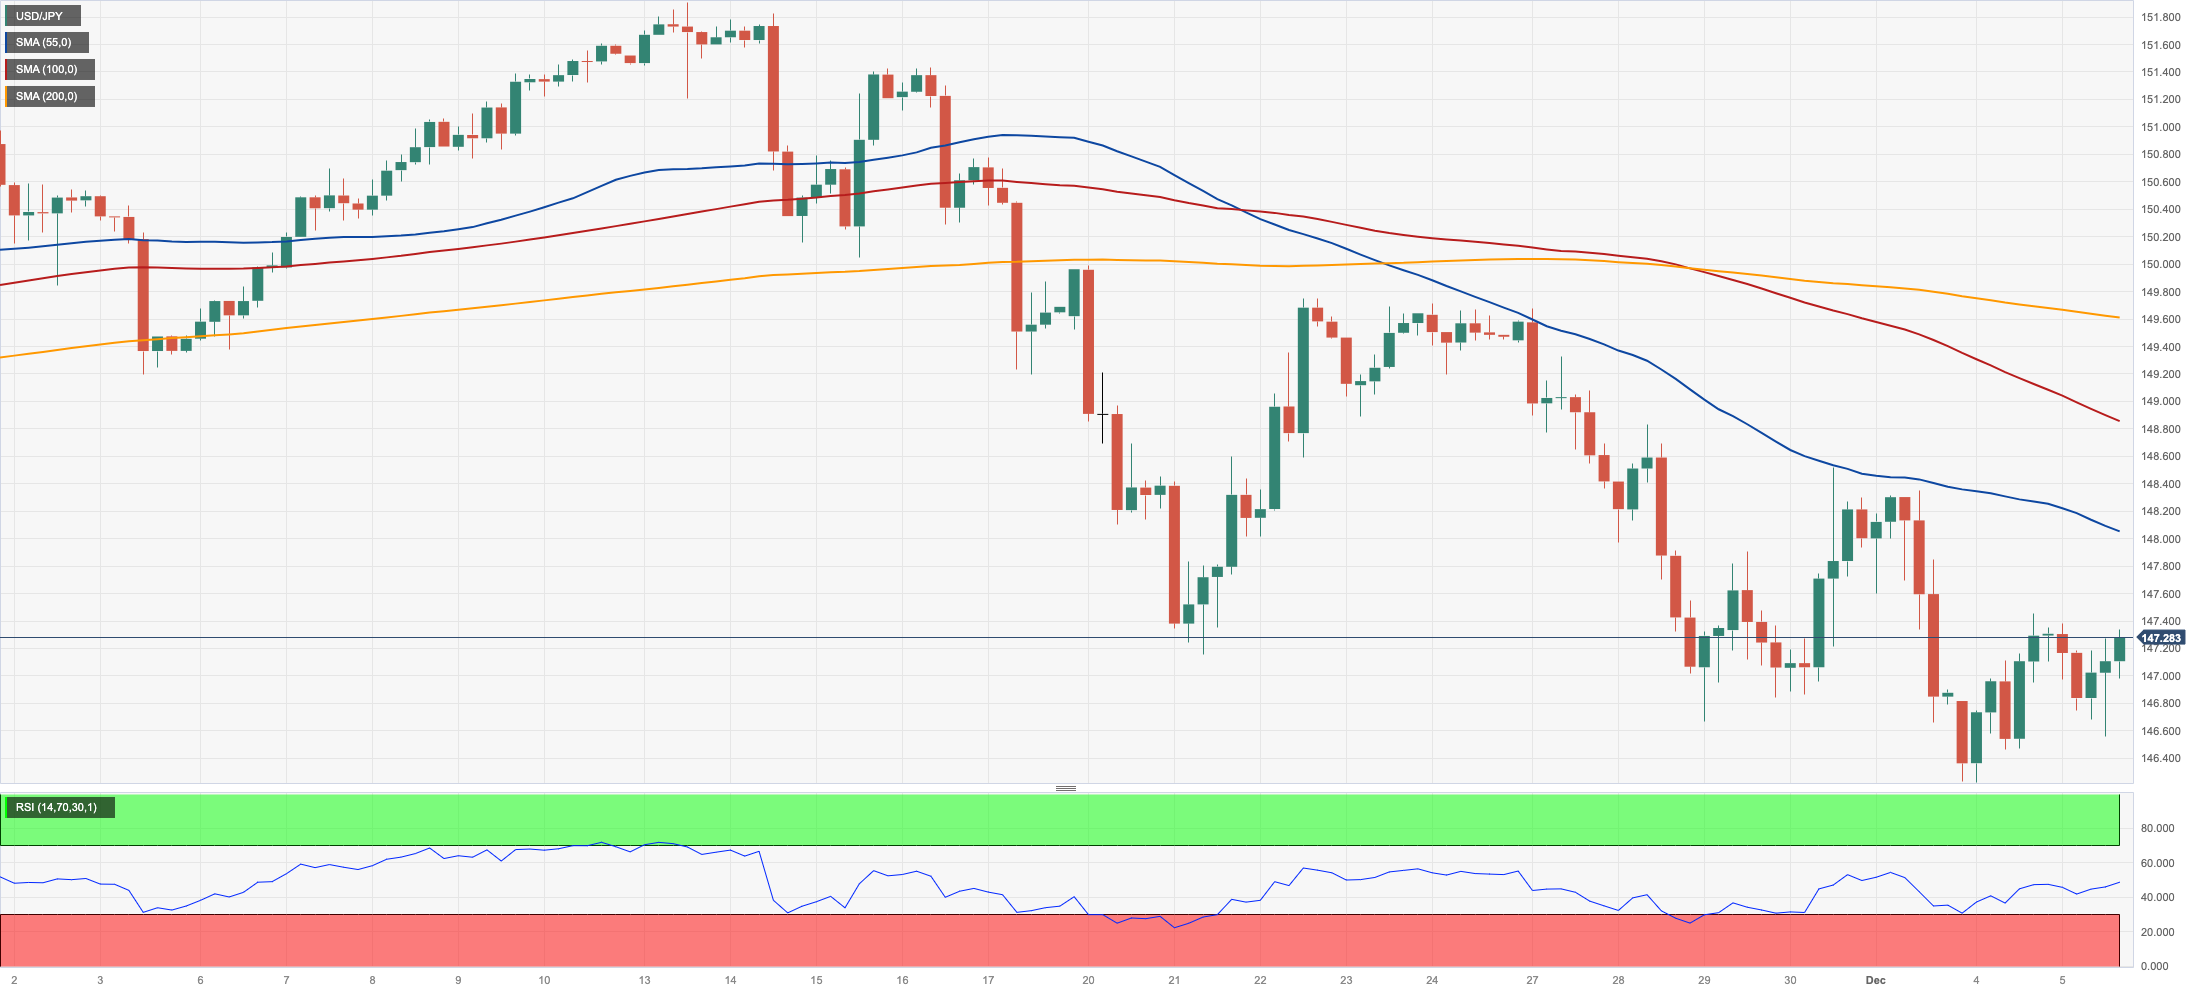
USD/JPY charted an inconclusive session on Tuesday, ending the session around the previous day’s closing levels in the 147.20/30 band.
The pair’s vacillating price action came on the back of the pronounced rebound in the greenback, which propelled the USD Index (DXY) back above the 104.00 hurdle, although the marked decline in US yields across the curve and further weakness in the JGB 10-year yields seem to have undermined the upside potential.
In Japan, final Jibun Bank Services PMI eased a tad to 50.8 in November (from 51.6).
If the December low of 146.22 (December 4) is breached, USD/JPY may confront the September low of 144.43 (September 1). There are no clear support levels below the latter until the 200-day SMA at 142.18, which is previous to the August low of 141.50 (August 7) and the July low of 137.23 (July 14). Just the opposite, immediate resistance is found at temporary 55-day SMA at 149.41 prior to the 2023 top of 151.90 (November 13). Up from here aligns the 2022 peak of 151.94 (October 21) closely followed by the round number of 152.00. The RSI rose past the 40 yardstick.
Resistance levels: 148.52 149.62 151.43 (4H chart)
Support levels: 146.22 145.89 144.43 (4H chart)
GBPUSD
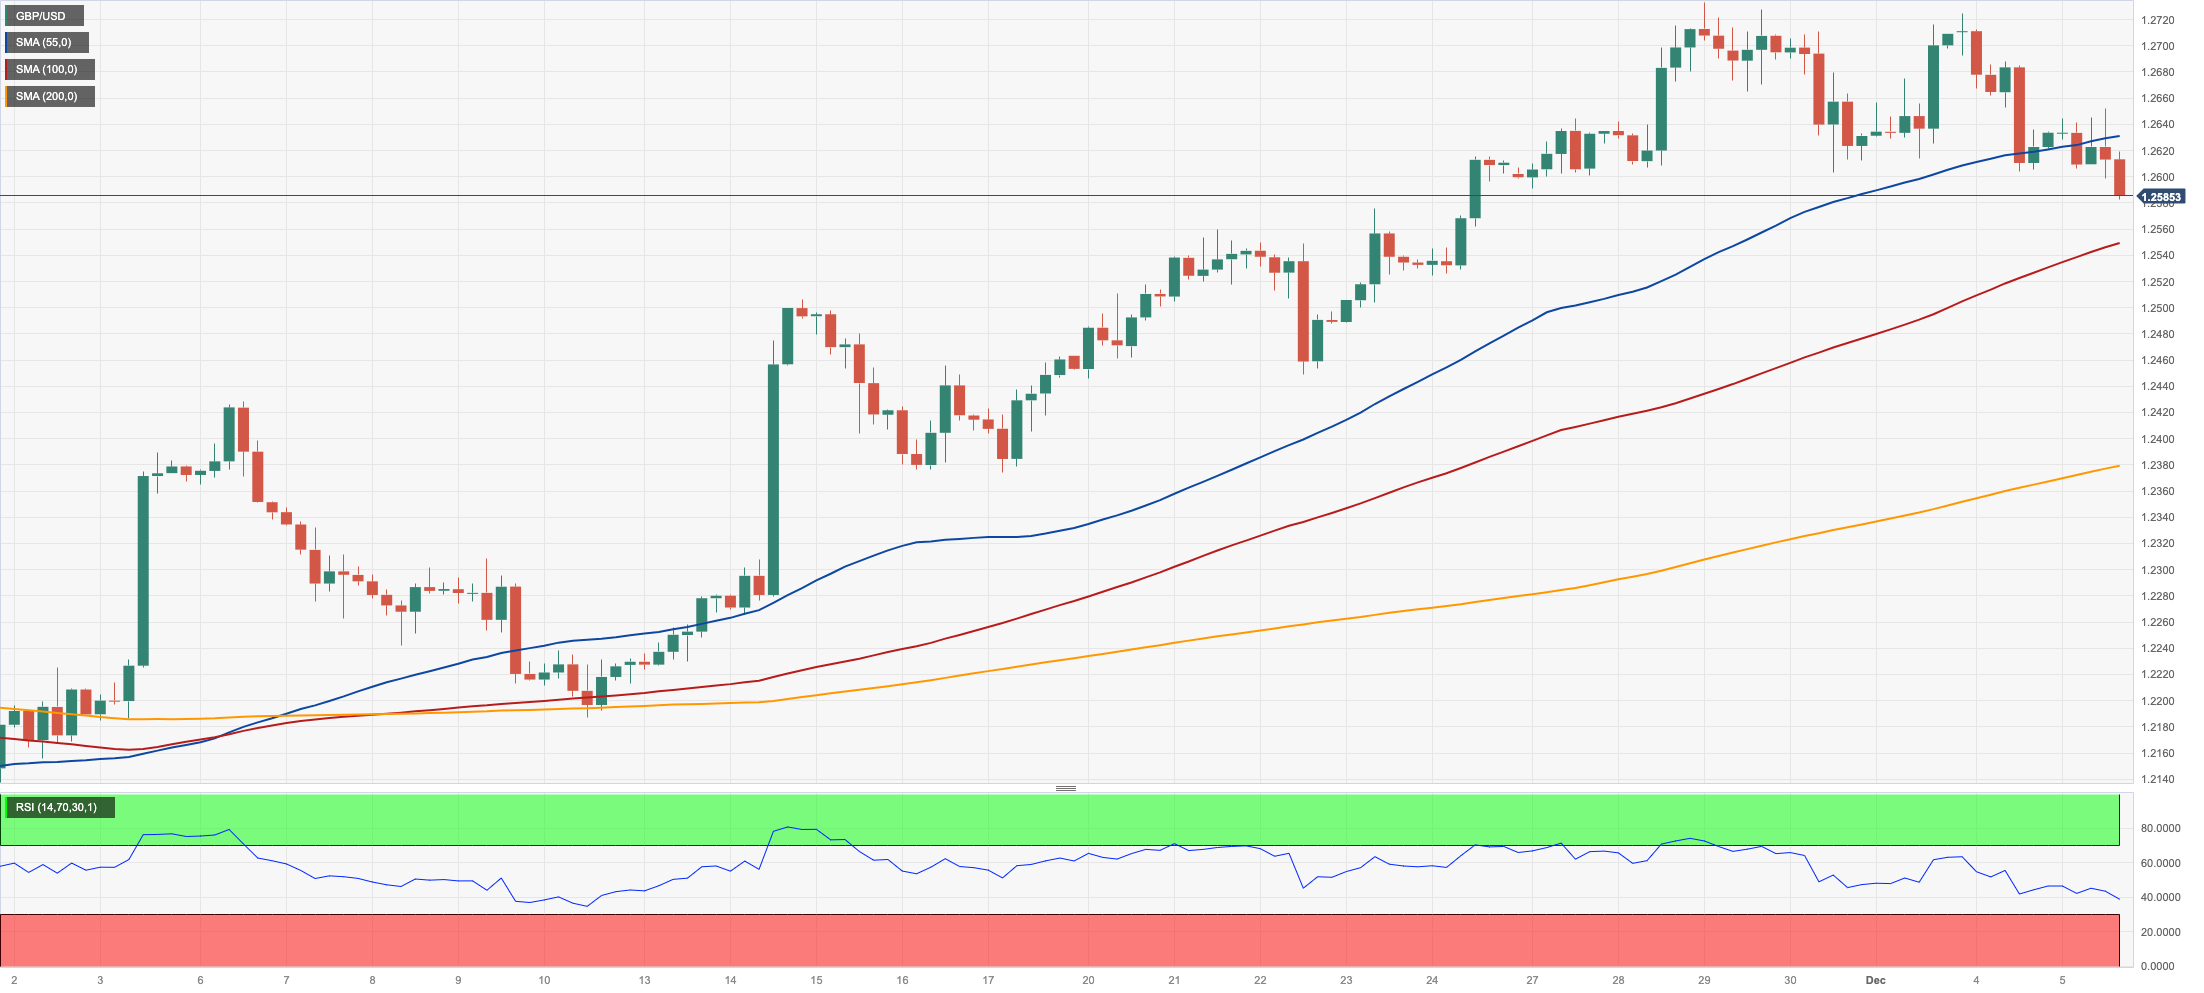
The pessimism around the risk-associated universe remained well and sound on Tuesday, this time forcing GBP/USD to revisit the sub-1.2600 region, or multi-day lows.
The second daily pullback in a row in Cable came in tandem with further strength in the greenback and the generalized resurgence of the demand for bonds, which in turn kept yields depressed across the board.
In the UK, BRC Retail Sales Monitor expanded by 2.6% in the year to November, and the final Services PMI ticked higher to 50.9 for the month of November.
The November high of 1.2733 represents the next upward barrier for GBP/USD (November 29). If this level is surpassed, the door might be opened to weekly tops of 1.2746 (August 30), 1.2818 (August 10), and 1.2995 (July 27), all of which occur prior to the critical 1.3000 threshold. In contrast, the crucial 200-day SMA at 1.2475 is projected to give early contention ahead of the transitory 55-day SMA at 1.2309. The weekly low of 1.2187 (November 10) is followed by 1.2069 (October 26) and 1.2037 (October 3), all before the key 1.2000 level and the 2023 low of 1.1802 (March 8). The daily RSI retreated to the area below 58.
Resistance levels: 1.2715 1.2733 1.2746 (4H chart)
Support levels: 1.2581 1.2448 1.2373 (4H chart)
AUDUSD
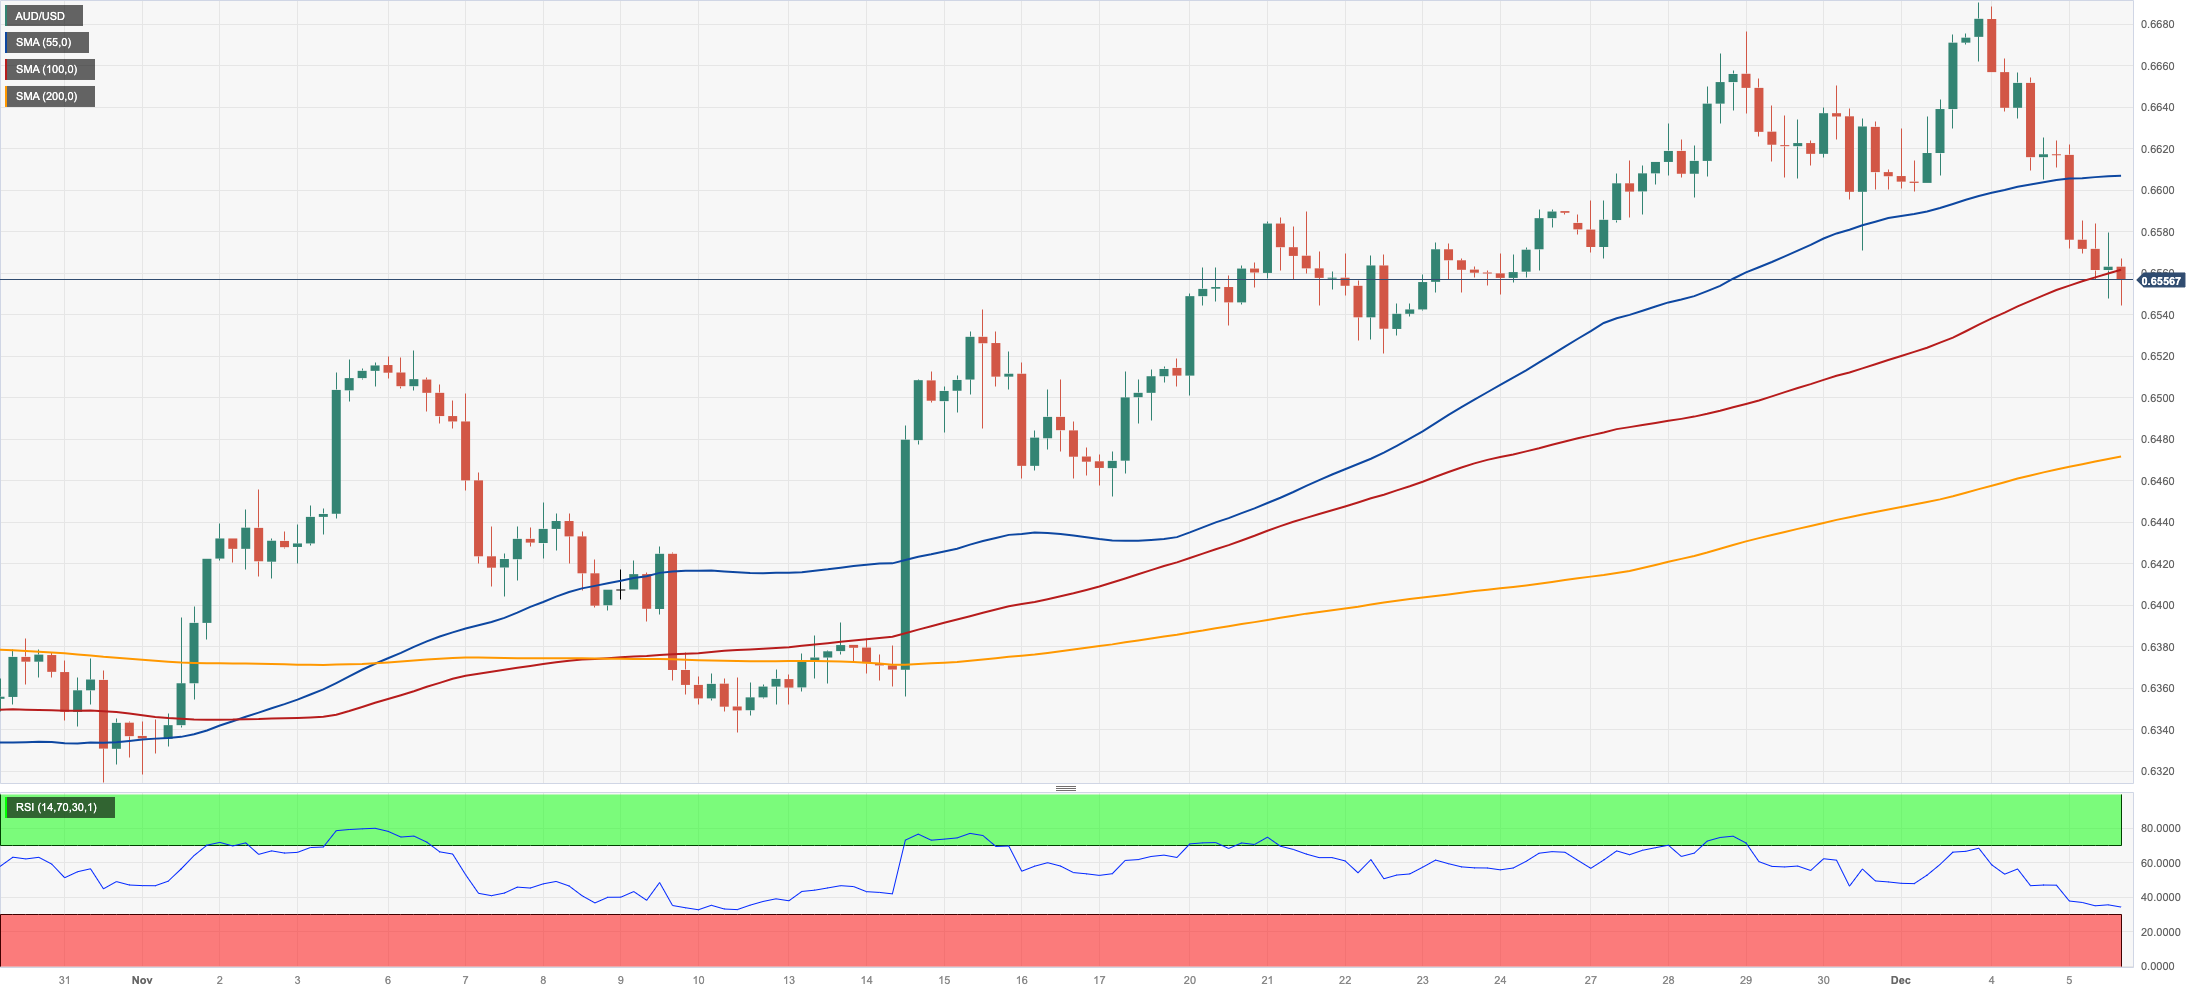
The intense rally in the greenback provoked the second daily pullback in the high-beta currency, this time dragging AUD/USD more than 1% lower to the mid-0.6500s, or multi-day lows.
The pair, therefore, extended further its rejection from Monday’s four-month tops around 0.6620.
Furthermore, firm prints from China’s Caixin Services PMI did nothing to help the Aussie dollar, while the broad-based negative performance of the commodity complex and the perceived dovish tone from the RBA event also added to the weakness surrounding the currency.
In what was the salient event in Oz on Tuesday, the RBA left its OCR unchanged at 4.35%, as widely expected. At her subsequent press conference, Governor M. Bullock said that higher interest rates are helping to establish a more durable balance between total supply and demand. Maintaining the cash rate unchanged at this meeting will permit time to evaluate the effects of the increases in interest rates on demand, inflation, and the job market. She additionally noted that the restricted data received on the domestic economy since the November meeting has generally been in line with expectations.
Further losses could drag AUD/USD to the temporary 100-day and 55-day SMAs at 0.6470 and 0.6433, respectively. If the latter is lost, a move to the 2023 bottom of 0.6270 (October 26) could emerge on the horizon before the round level of 0.6200 and the 2022 low of 0.6169 (October 13). Just the opposite, the next hurdle comes at the December top of 0.6690 (December 4). A break above this level might spark a challenge to the July high of 0.6894 (July 14), which is just ahead of the June peak of 0.6899 (June 16) and the critical 0.7000 barrier. The daily RSI plummeted to the 53 zone.
Resistance levels: 0.6690 0.6739 0.6821 (4H chart)
Support levels: 0.6544 0.6521 0.6452 (4H chart)
GOLD
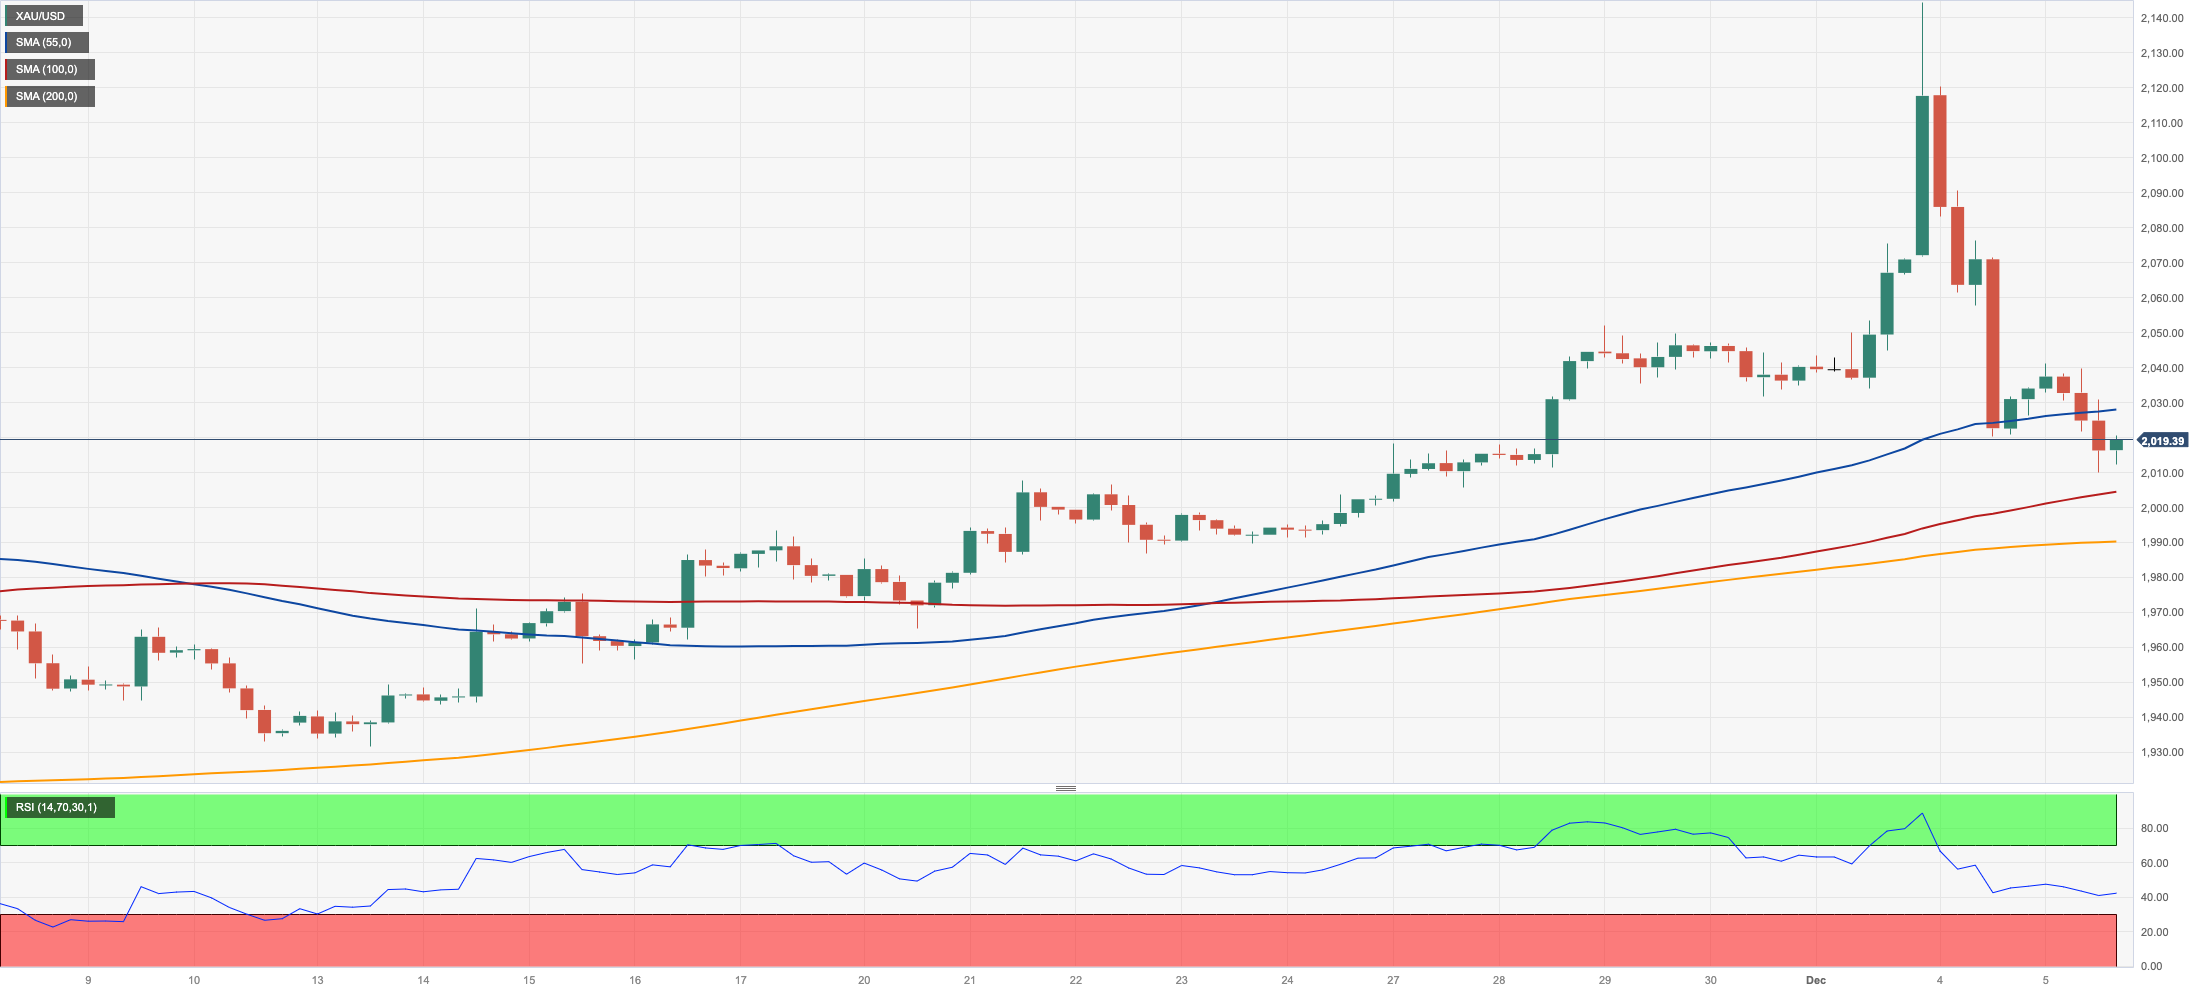
Gold prices extended their corrective move after hitting a new all-time high around $2150 per troy ounce at the beginning of the week, retreating to the vicinity of the key $2000 mark on turnaround Tuesday.
The continuation of the strong bounce in the greenback kept the price action around the yellow metal depressed, although the marked decline in US yields across the board also seems to have limited its downside pressure.
Meanwhile, the ongoing week holds significant interest for the precious metal as it anticipates the unveiling of crucial US economic indicators, especially in the labour market. Additionally, the prospect of the Fed potentially easing as early as the spring of 2024 is expected to offer support in the event of intermittent downturns.
In case bulls regain the upper hand, the next gold milestone is the all-time high of $2149 (December 4). Instead, bearish attempts might push gold down below the 200-day SMA of $1948 before the November low of $1931 (November 13). If this level is broken, the October low of $1810 (October 6) might be in play, followed by the 2023 bottom of $1804 (February 28) and the important $1800 contention zone.
Resistance levels: $2041 $2149 (4H chart)
Support levels: $2009 $1989 $1965 (4H chart)
CRUDE WTI
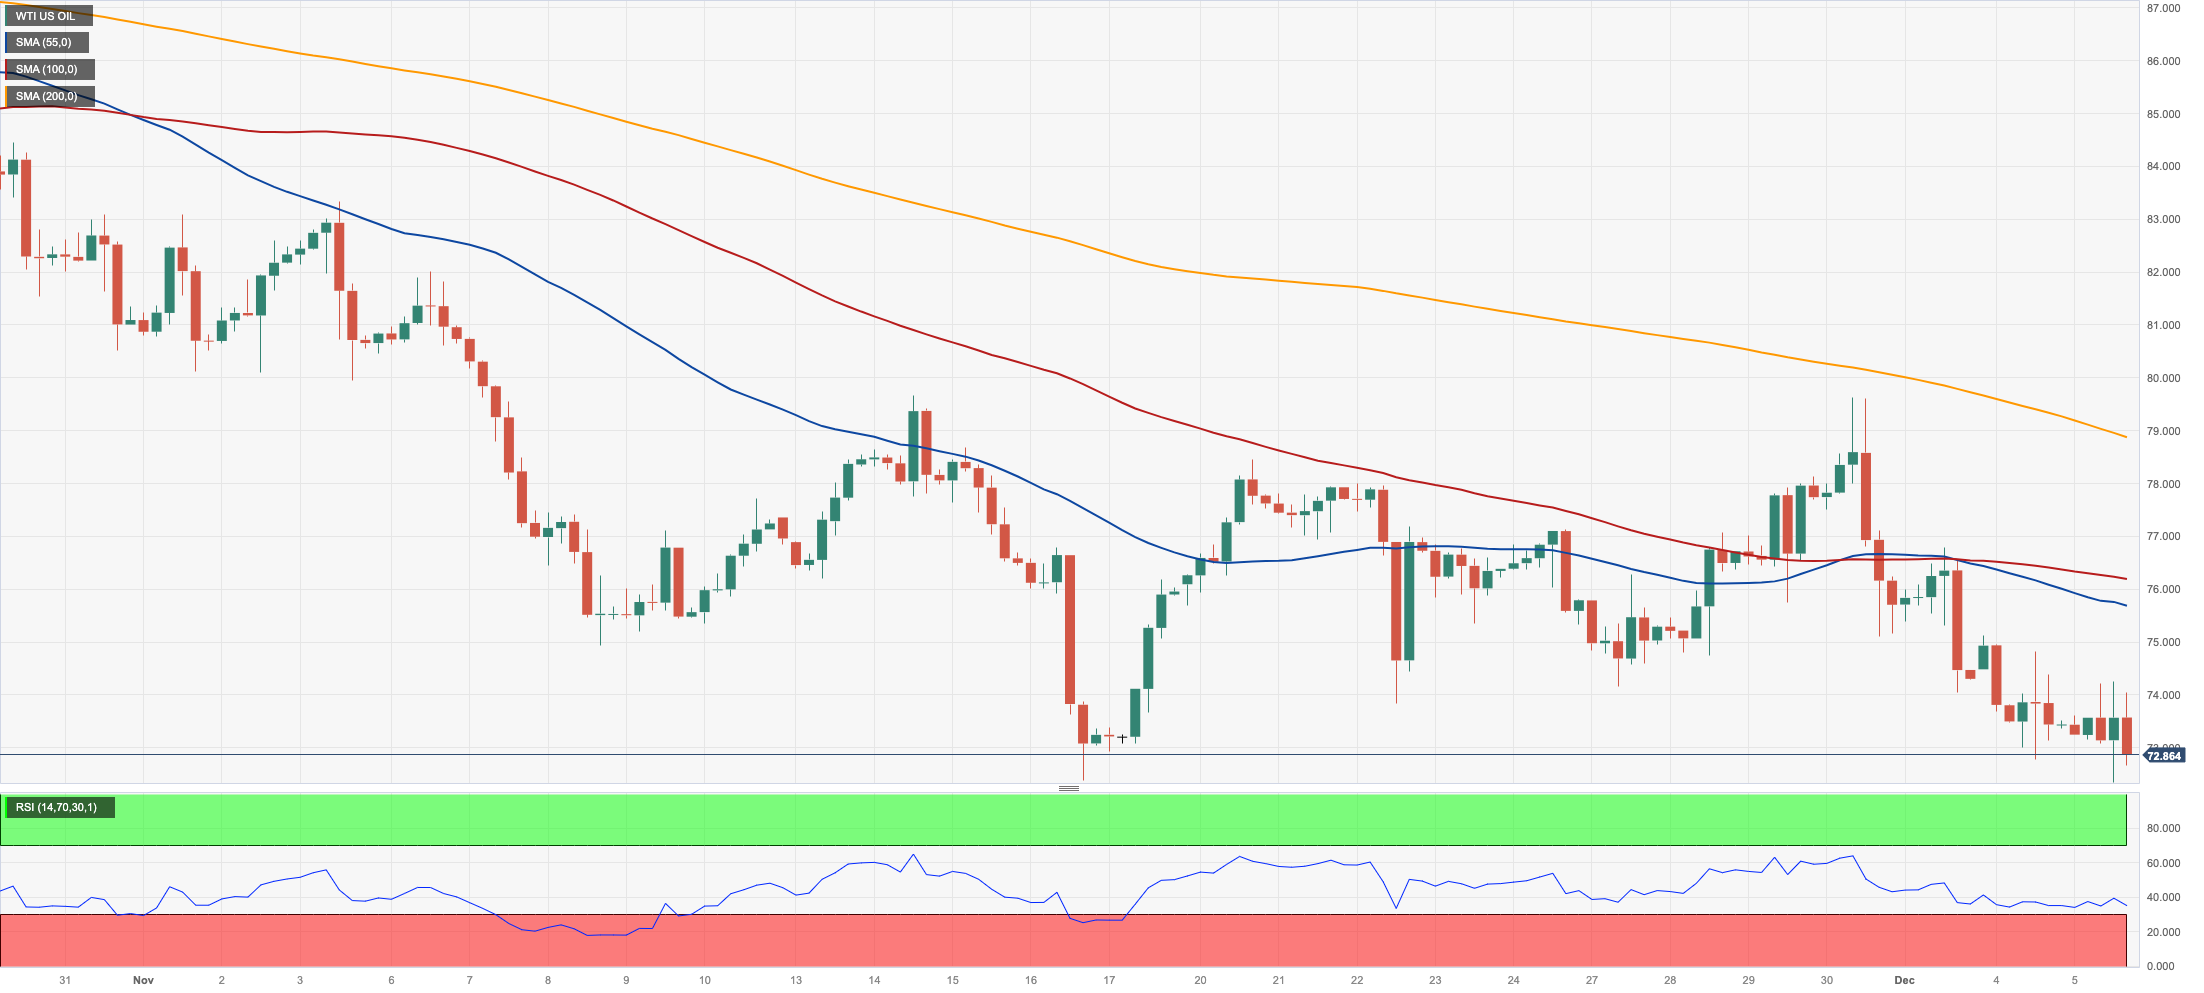
Further weakness dragged prices of the American benchmark for sweet light crude oil to new five-month lows near the $72.00 mark per barrel on Tuesday.
The fourth consecutive decline in the commodity occurred amidst ongoing wariness within trading circles concerning the recent choice by OPEC+ to voluntarily decrease oil output, while perennial concerns over demand also contributed to the downbeat sentiment on Tuesday.
Somewhat limiting the downside bias, however, remained geopolitical concerns stemming from the Israel-Hamas conflict and the recent attack to US vessels by Houthi forces.
Immediate downside targets for WTI include the December low of $72.20 (December 5), the 2023 low of $63.61 (May 4), and the critical $60.00 yardstick. On the other way around, a break above the important 200-day SMA at $78.03 might reintroduce a challenge to the significant $80.00 level, which would be quickly followed by the November high of $80.15 (November 3). Weekly highs of $89.83 (October 18), $94.99 (September 28), and $97.65 (August 30, 2022) are set to follow, all with an eye on the psychological $100.00 mark.
Resistance levels: $76.72 $79.56 $83.56 (4H chart)
Support levels: $72.14 $70.18 $67.01 (4H chart)
GER40
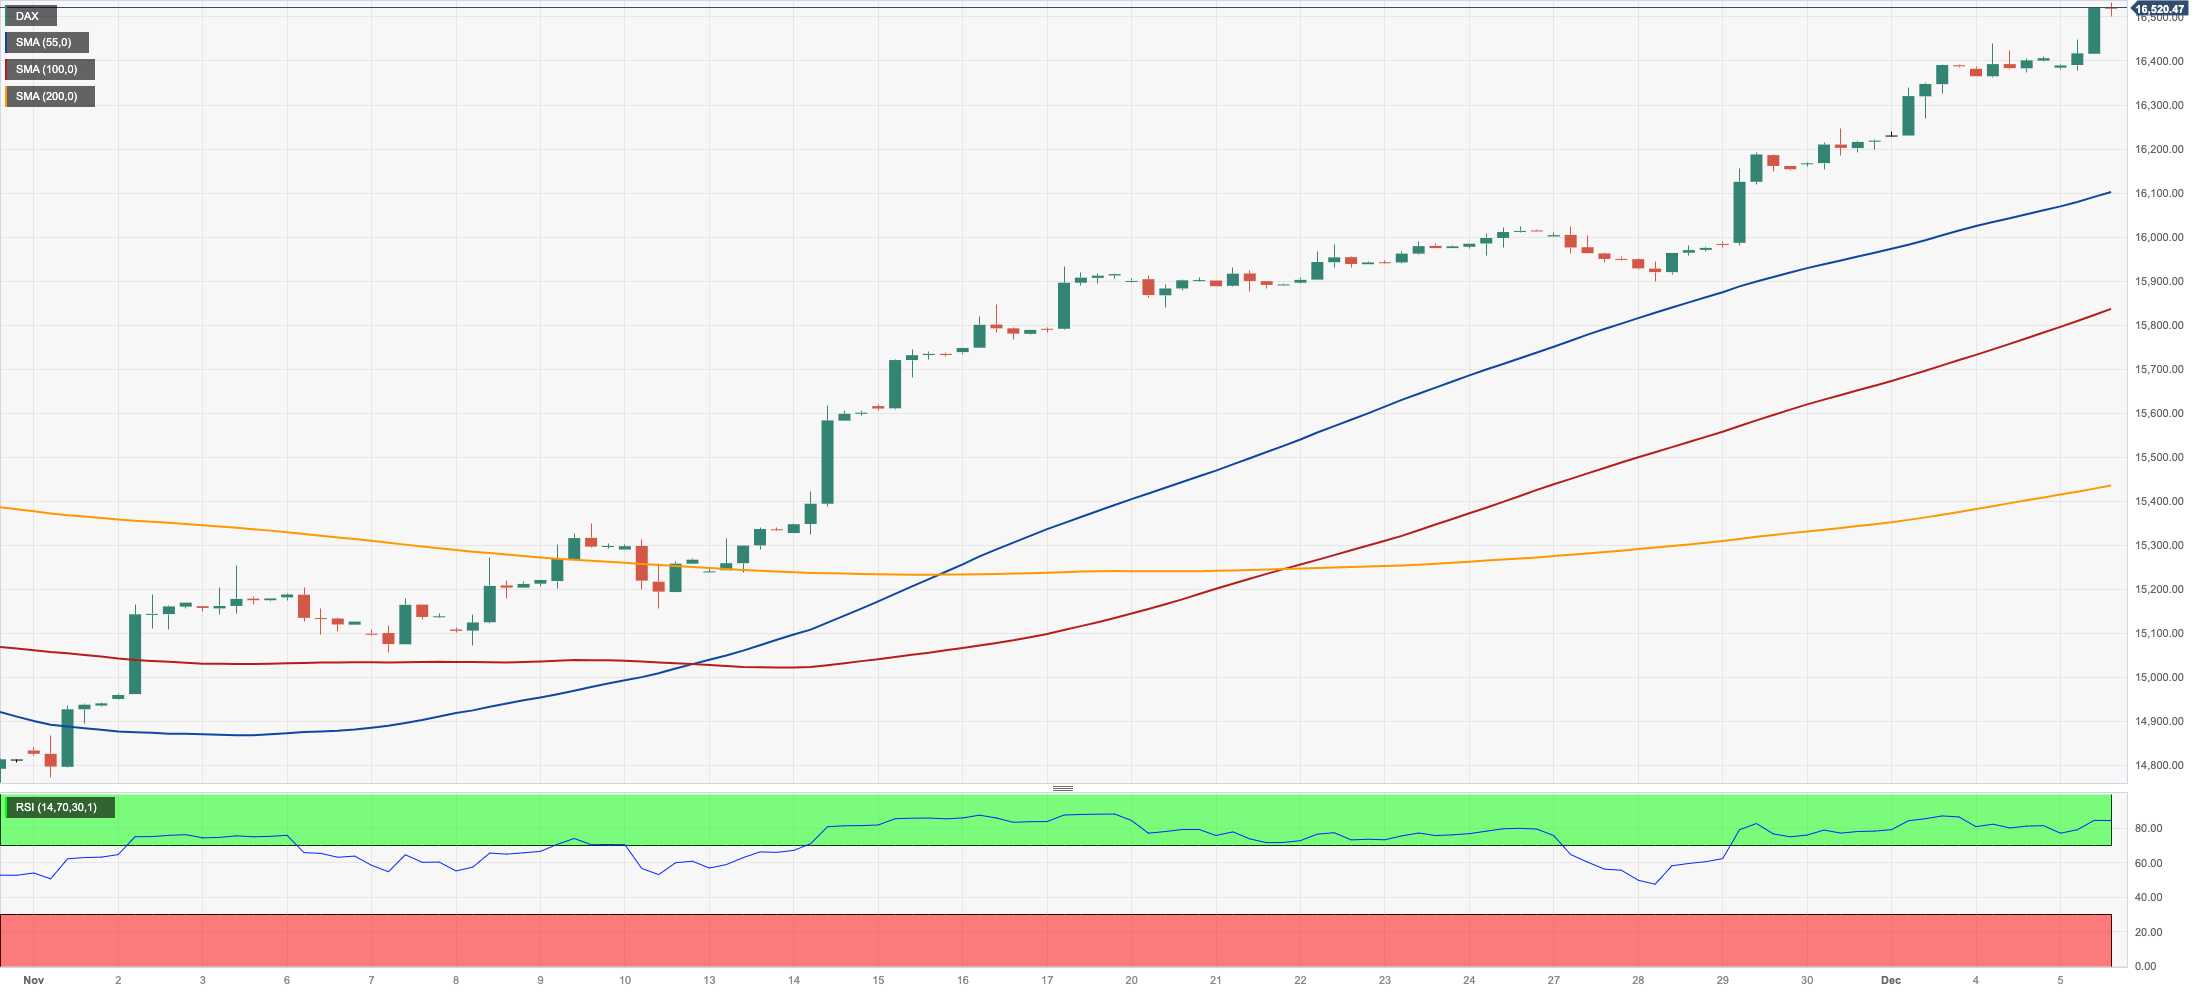
The German index DAX40 edged further up and clinched a new all-time high around 16550 on Tuesday.
Additional increases in the index were underpinned by the widespread belief that the ECB could initiate rate reductions at some point in the spring of 2024. This view was bolstered further by comments from Board members Schnabel and Vujcic, who reinforced the idea that the central bank should now keep rates on hold.
The opposite happened in the German bond markets, where 10-year bund yields grinded lower to levels last seen in June below 2.25%.
Further gains might propel the DAX40 to its all-time high of 16551 (December 5). Early support, on the other hand, may be found at the weekly low of 15915 (November 28) ahead of the key 200-day SMA of 15692 and the intermediate 55-day SMA of 15418. If this zone is broken, the October low of 14630 (October 23) may be tried again before the March low of 14458 is reached (March 20). The daily RSI approached 82, suggesting that the market remained extremely overbought.
Best Performers: Daimler Truck Holding, Siemens Energy AG, Bayer
Worst Performers: Fresenius SE, Sartorius AG VZO, Henkel VZO
Resistance levels: 16551 (4H chart)
Support levels: 15915 15475 15171 (4H chart)
NASDAQ
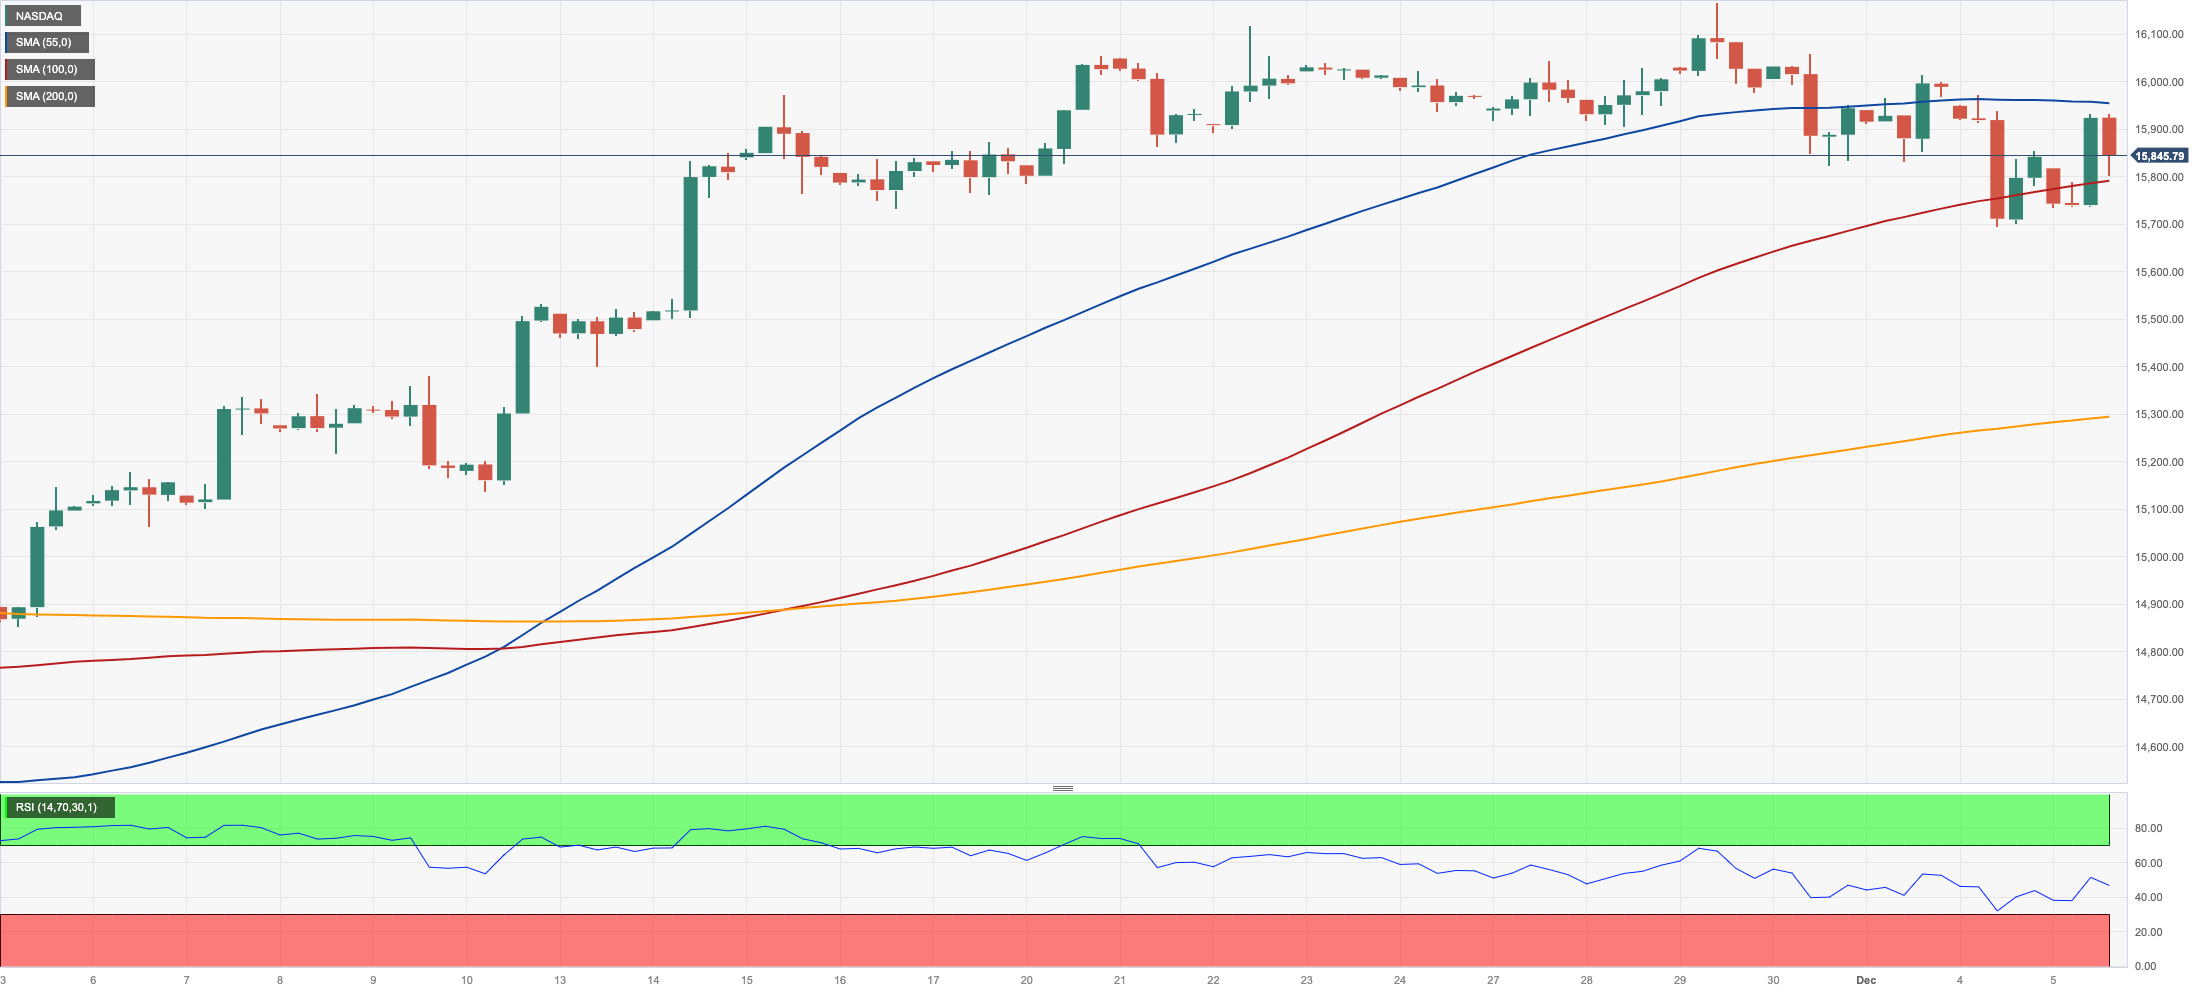
US tech equities traded in an inconclusive fashion on Tuesday, prompting the reference Nasdaq 100 to alternate gains with losses around the 15800 zone.
The vacillating price action in the index came against the backdrop of the steep march north in the greenback and the dominating risk-off sentiment, all amidst further weakness in US yields across different timeframes and rising prudence prior to key US data releases.
Next on the upside for the Nasdaq 100 aligns the 2023 peak of 16166 (November 29), seconded by the December 2021 high of 16607 (December 28) and the all-time top of 16764 (November 22 2021). In the opposite direction, the 55-day SMA of 15148 should provide transitory contention before the 200-day SMA of 14371 and the October low of 14058 (October 26). Further losses might challenge the April bottom of 12724 (April 25), the March low of 11695 (March 13), and the 2023 low of 10696 (January 3). On the daily chart, the RSI looked stable near 60.
Top Gainers: Apple, Tesla, Palo Alto Networks
Top Losers: Charter Communications, Warner Bros Discovery, PayPal Holdings Inc
Resistance levels: 16166 16607 16764 (4H chart)
Support levels: 15695 15220 14058 (4H chart)
DOW JONES
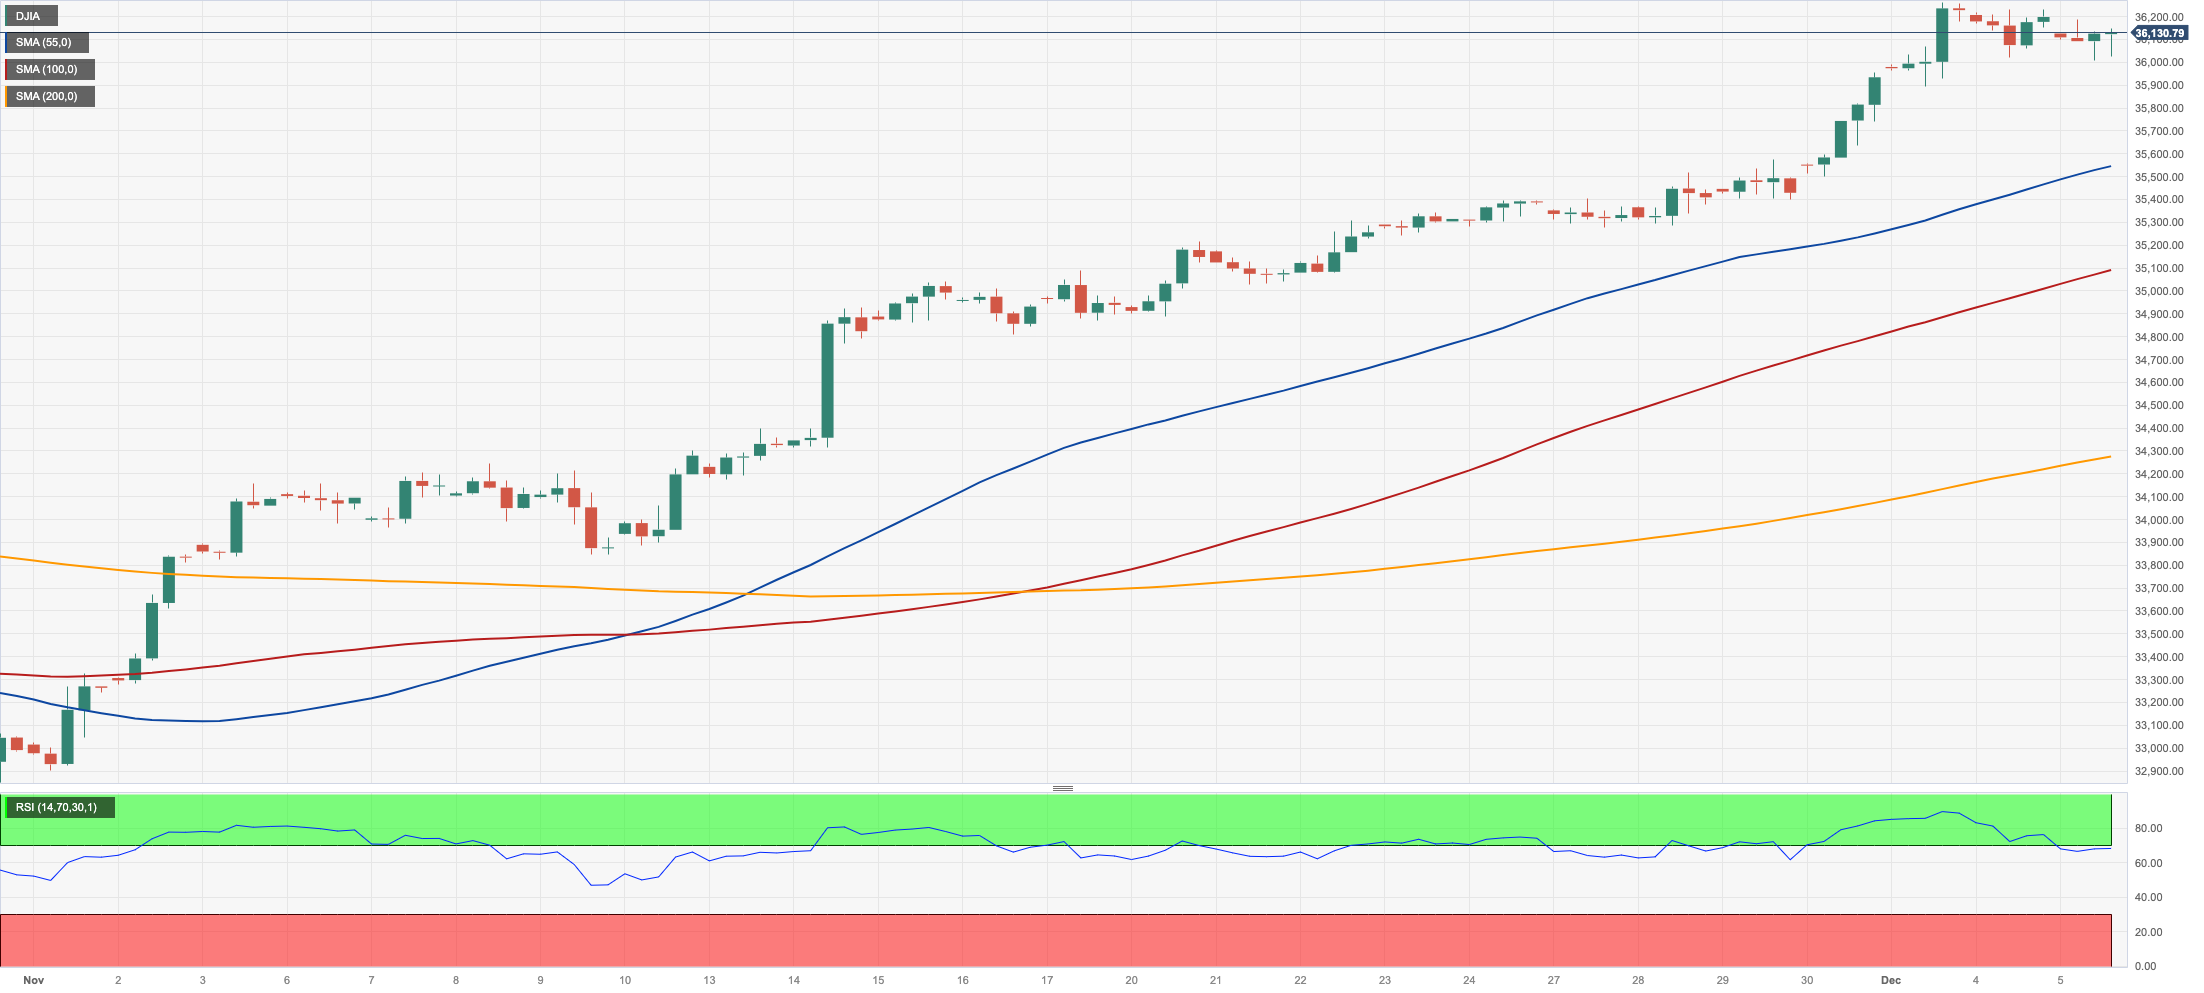
A pessimistic start of the week for US stocks measured by the Dow Jones extended to Tuesday when the index printed modest losses near the key 36000 support.
Further losses in the Dow came in response to the cautious mood among market participants ahead of key US data releases, as well as the prevailing risk-off tone and the pronounced rebound in the greenback.
All in all, the Dow Jones lost 0.28% to 36103, the S&P500 deflated 0.12% to 4564, and the tech-benchmark Nasdaq Composite gained 0.12% to 14202.
If the Dow Jones index revisits the 2023 high of 36264 (December 1), it may face the all-time top of 36952 (January 5, 2022) before reaching the round level of 37000. On the contrary, the 100-day SMA of 34467 offers temporary support, which is backed up by the 200-day SMA of 33926 and the weekly low of 33859 (November 7). Down from here comes the October low of 32327 (October 27) ahead of the 2023 low of 31429 (March 15) and the 2022 low of 28660 (October 13). The daily RSI fell slightly to the 76 area, still considerably over the overbought level.
Top Performers: Apple, Merck&Co, Walmart
Worst Performers: Procter&Gamble, American Express, Goldman Sachs
Resistance levels: 36264 36513 36952 (4H chart)
Support levels: 34460 33859 32327 (4H chart)
MACROECONOMIC EVENTS

All Information & Updates provided by:

All information relating to the financial markets available on this page has been prepared and issued by FXStreet (Forexstreet SL, Spain, Reg: B62498233) on the basis of publicly available information and all information believed to be reliable and does not conflict with Kuwaiti local laws, and all necessary care has been taken to before the company to ensure that the facts mentioned are correct from the source.
NCM Investment nor any of its directors or employees shall in any way be held responsible for the contents of this news, and the information contained on this page is intended only to provide clients with publicly available information and should not be construed as investment advice, report or analysis and/or constitute an offer or invitation to buy or sell financial instruments of any kind.
RISK WARNING: Forex and CFDs are highly risky leveraged products, as losses can exceed deposits. Please ensure you understand all the risks and take independent advice if necessary. NCM will segregate the clients based on the criteria of the regulator and its bylaws. NCM does not provide any advisory service; the material published does not constitute advice or a recommendation for a transaction in any financial instrument. NCM accepts no responsibility for any use of the content presented and any consequences of that use. Anyone acting on the information provided does so at their own risk.