
- Contact Us:
-

-

-

-


Daily Market Updates
07 Dec 2023
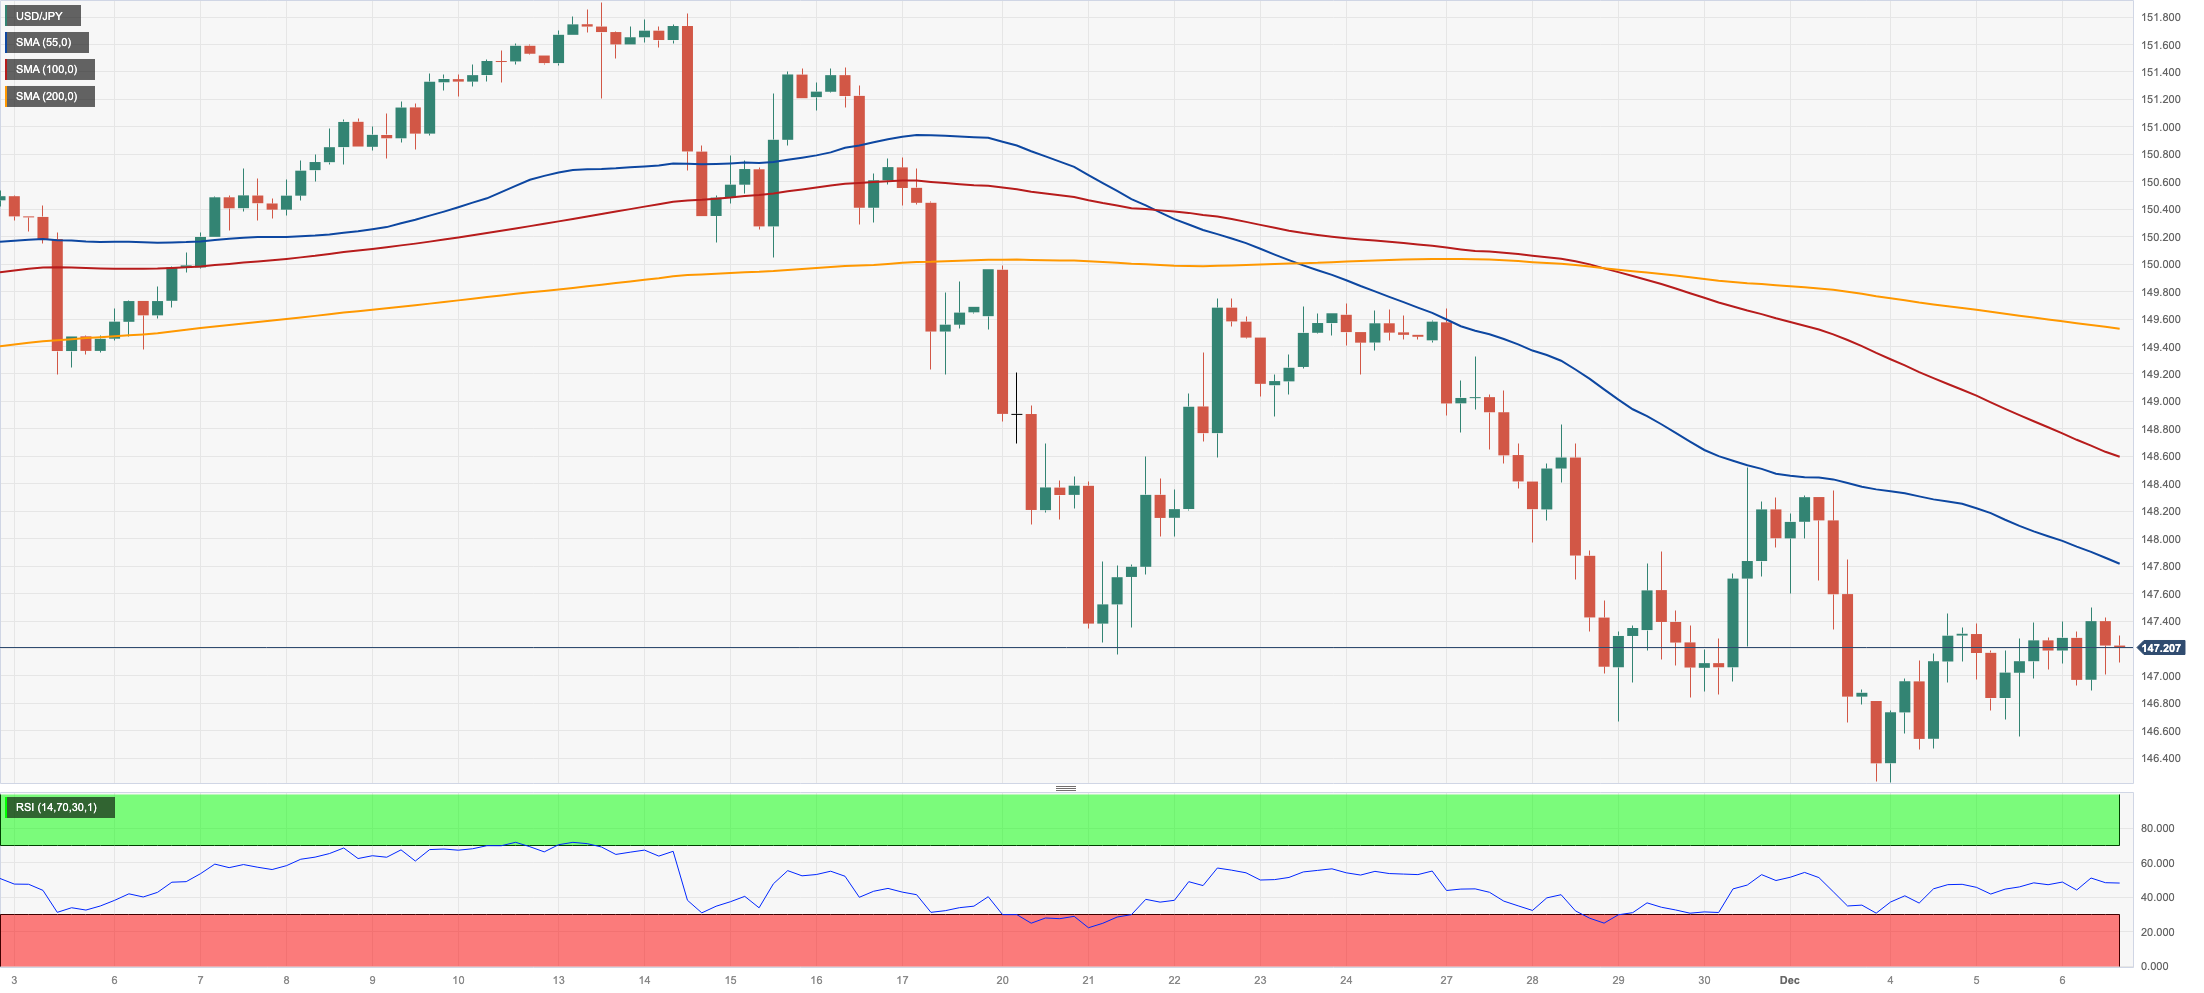
USDJPY
Another inconclusive session placed USD/JPY just above the 147.00 hurdle on Wednesday.
The pair’s price action followed the equally lack of clear direction in the greenback as well as the generalized resumption of the demand for bonds in both the US and Japan, leaving yields on these markets pointing southwards again.
A quick look at the BoJ saw member Himino state that it is expected that households would experience the most significant advantages from increased net income, while the corporate sector would likely see a limited impact. He emphasized that the financial system possesses enough resilience to handle higher rates. He further added that if the process is executed correctly, there is a strong possibility of achieving positive outcomes from the exit strategy. This is because a wide range of households and firms would benefit from the positive relationship between wages and prices.
Data-wise, the Reuters Tankan Index improved to 12 for the month of December.
If the December low of 146.22 (December 4) is cleared, USD/JPY might face the September low of 144.43 (September 1). South from here, there are no apparent support levels until the 200-day SMA at 142.23, which precedes the August low of 141.50 (August 7) and the July bottom of 137.23 (July 14). Just the opposite, immediate resistance is identified at the temporary 55-day SMA at 149.39 before the 2023 top of 151.90 (November 13) and the 2022 peak of 151.94 (October 21), which anticipates the round number of 152.00. The RSI looked stable around 40.
Resistance levels: 147.49 148.52 149.56 (4H chart)
Support levels: 146.22 145.89 144.43 (4H chart)
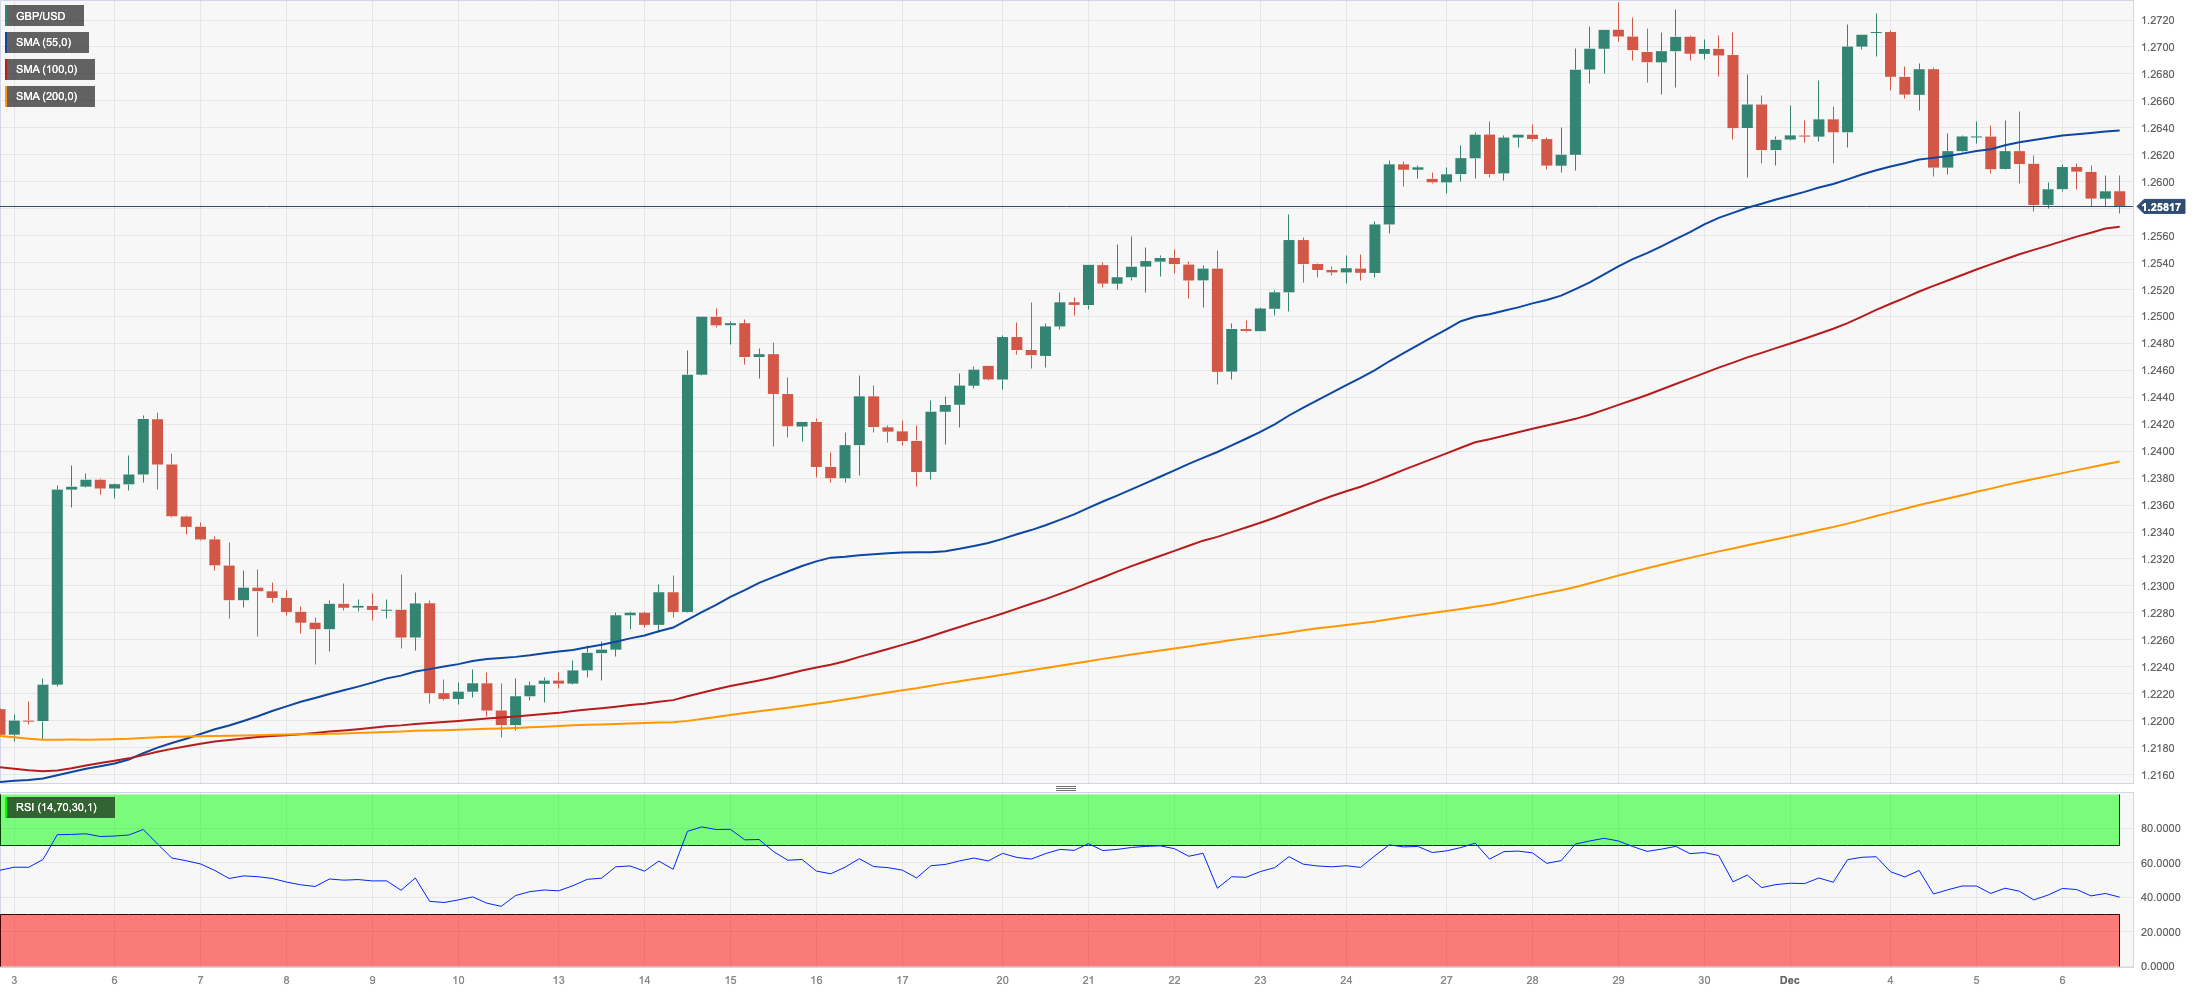
GBPUSD
Following its weekly bearish momentum, GBP/USD could not sustain an earlier move above 1.2600 and ended up retreating to the 1.2580 on Wednesday.
The unsure price action in the greenback sponsored the small decline in Cable at the time when UK 10-year gilt yields broke below 4.00% for the first time since late May.
From the BoE, Governor A. Bailey mentioned that the full impact of higher rates was yet to hit the UK and added that the outlook for inflation was uncertain. He also suggested that rates were likely to need to remain around current levels.
Across the Channel, Construction PMI receded marginally to 45.5 in November.
The next upward hurdle for GBP/USD is the November high of 1.2733 (November 29). If this level is broken, the door might be opened to weekly tops of 1.2746 (August 30), 1.2818 (August 10), and 1.2995 (July 27), all of which occur before the key 1.3000 yardstick. In contrast, the pivotal 200-day SMA at 1.2478 is expected to provide early support ahead of the flimsy 55-day SMA at 1.2313. Down from here aligns the weekly low of 1.2187 (November 10) seconded by the October low of 1.2037 (October 3), both of which are prior to the crucial 1.2000 level and the 2023 low of 1.1802 (March 8). The daily RSI eased to the 57 area.
Resistance levels: 1.2715 1.2733 1.2746 (4H chart)
Support levels: 1.2577 1.2448 1.2373 (4H chart)
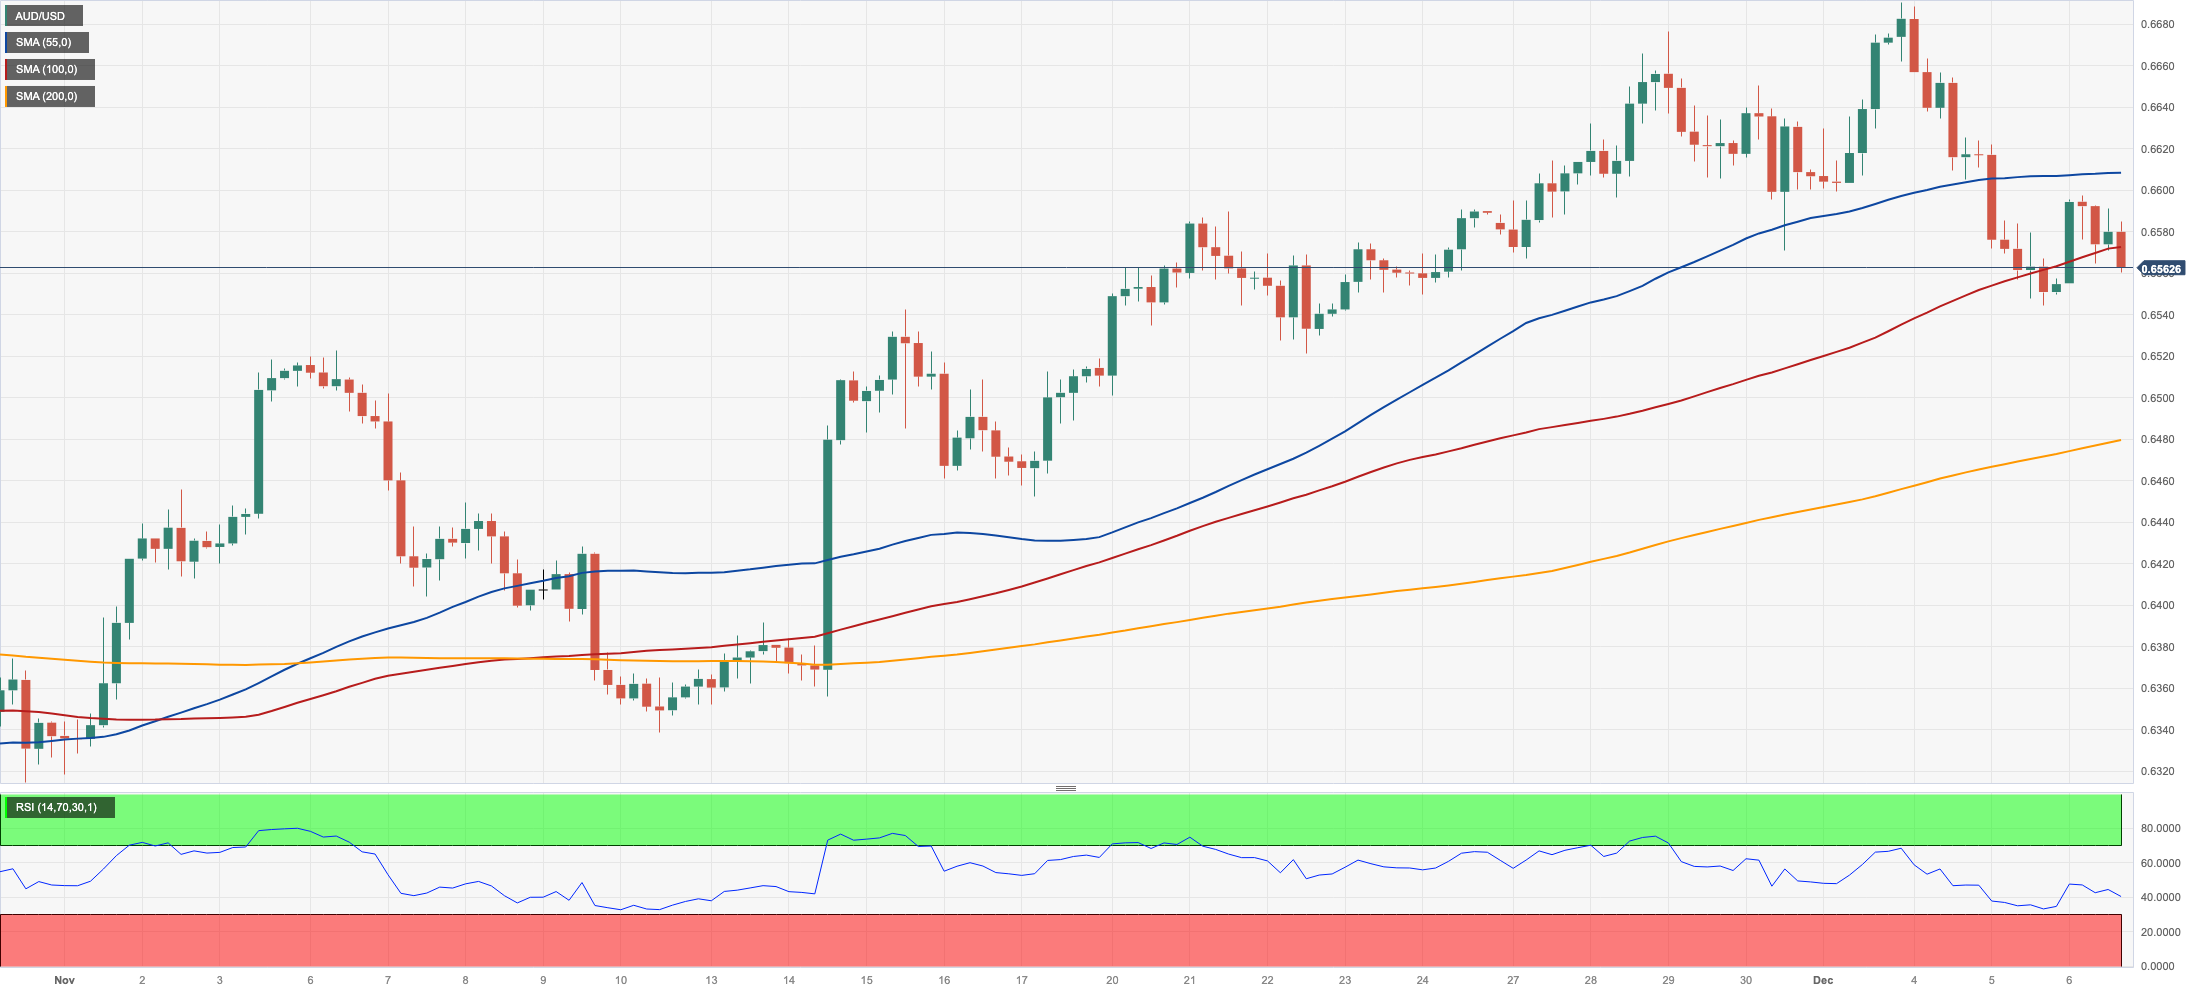
AUDUSD
The vacillating mood in the greenback did not prevent the Aussie dollar from regaining some balance and lifting AUSD/USD back to the boundaries of the key 0.6600 barrier on Wednesday. That move, however, fizzled out and spot revisited the 0.6560 zone as the NA session drew to a close.
Indeed, spot reversed two daily pullbacks in a row on the back of the marked resumption of the bullish tone in the AUD, while positive developments from copper prices and iron ore also contributed to the daily bounce.
Meanwhile, in Oz, GDP figures showed the economy expanded 0.2% QoQ in the July–September period and 2.1% over the last twelve months.
Further losses in AUD/USD should break below the December low of 0.6544 (December 5) to retest the temporary 100-day and 55-day SMAs at 0.6468 and 0.6436, respectively. If the latter is lost, a move to the 2023 bottom of 0.6270 (October 26) could emerge on the horizon before the round level of 0.6200 and the 2022 low of 0.6169 (October 13). On the flip side, the next hurdle comes at the December top of 0.6690 (December 4). A breakout of this level might spark a challenge to the July peak of 0.6894 (July 14), which is just ahead of the June high of 0.6899 (June 16) and the critical 0.7000 barrier. The daily RSI climbed to the vicinity of the 54 yardstick.
Resistance levels: 0.6690 0.6739 0.6821 (4H chart)
Support levels: 0.6544 0.6521 0.6452 (4H chart)
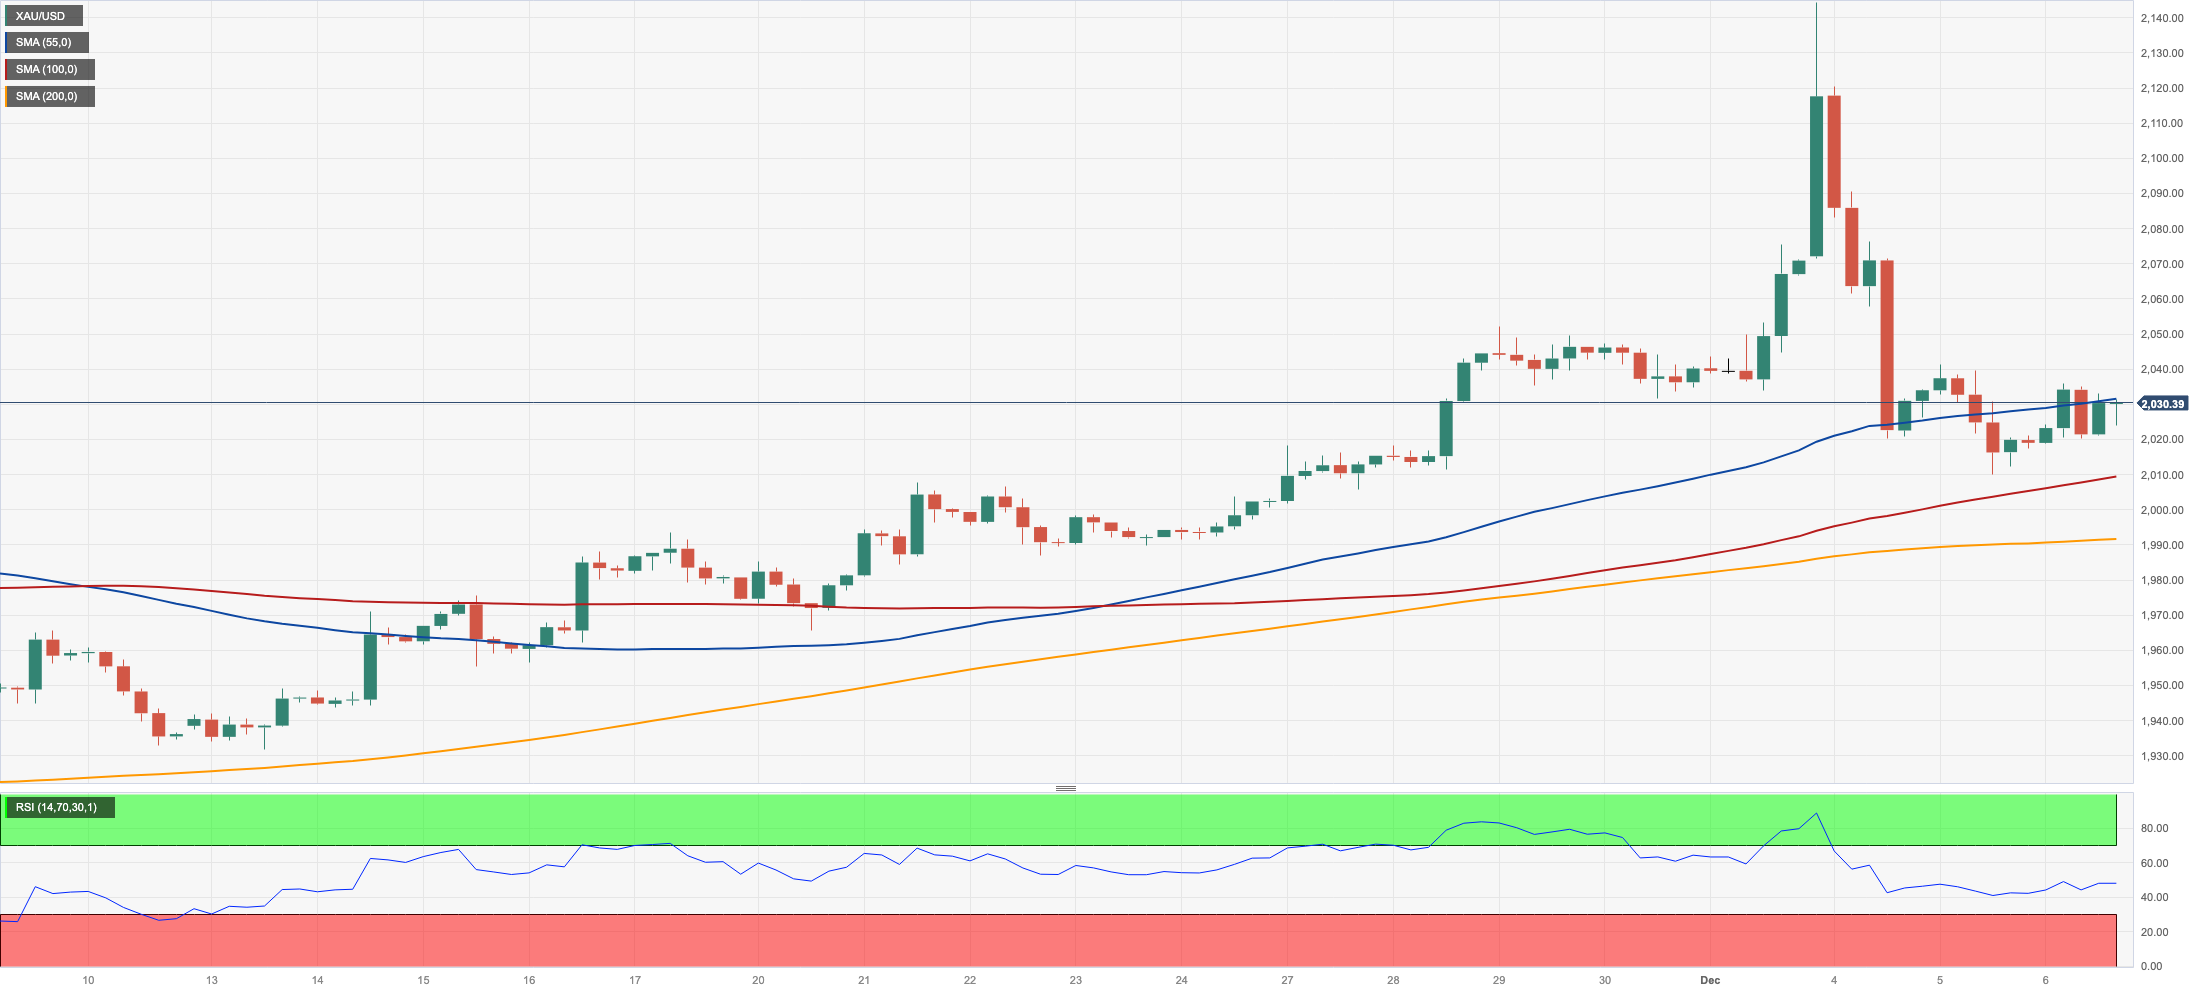
GOLD
Prices of the troy ounce of the precious metal regained some shine and advanced past the $2030 level after two consecutive daily drops on Wednesday.
Ups and downs around the greenback in combination with the mixed tone in US yields across the board seem to have underpinned the rebound in the yellow metal, which has so far managed well to keep business above the critical $2000 mark.
In the meantime, this week is of notable importance for the commodity as it awaits the release of vital US economic indicators, particularly regarding the labour market. Furthermore, the expectation of the Fed potentially easing by the spring of 2024 is seen as a factor that could provide support during occasional downturns.
If the bulls retake control, the next gold milestone is the all-time high of $2149 (December 4). Instead, bearish attempts might send the yellow metal below the 200-day SMA of $1949 before the November low of $1931 (November 13). If this level is broken, the October low of $1810 (October 6) may be in play, followed by the 2023 bottom of $1804 (February 28) and the crucial $1800 contention zone.
Resistance levels: $2041 $2149 (4H chart)
Support levels: $2009 $1991 $1965 (4H chart)
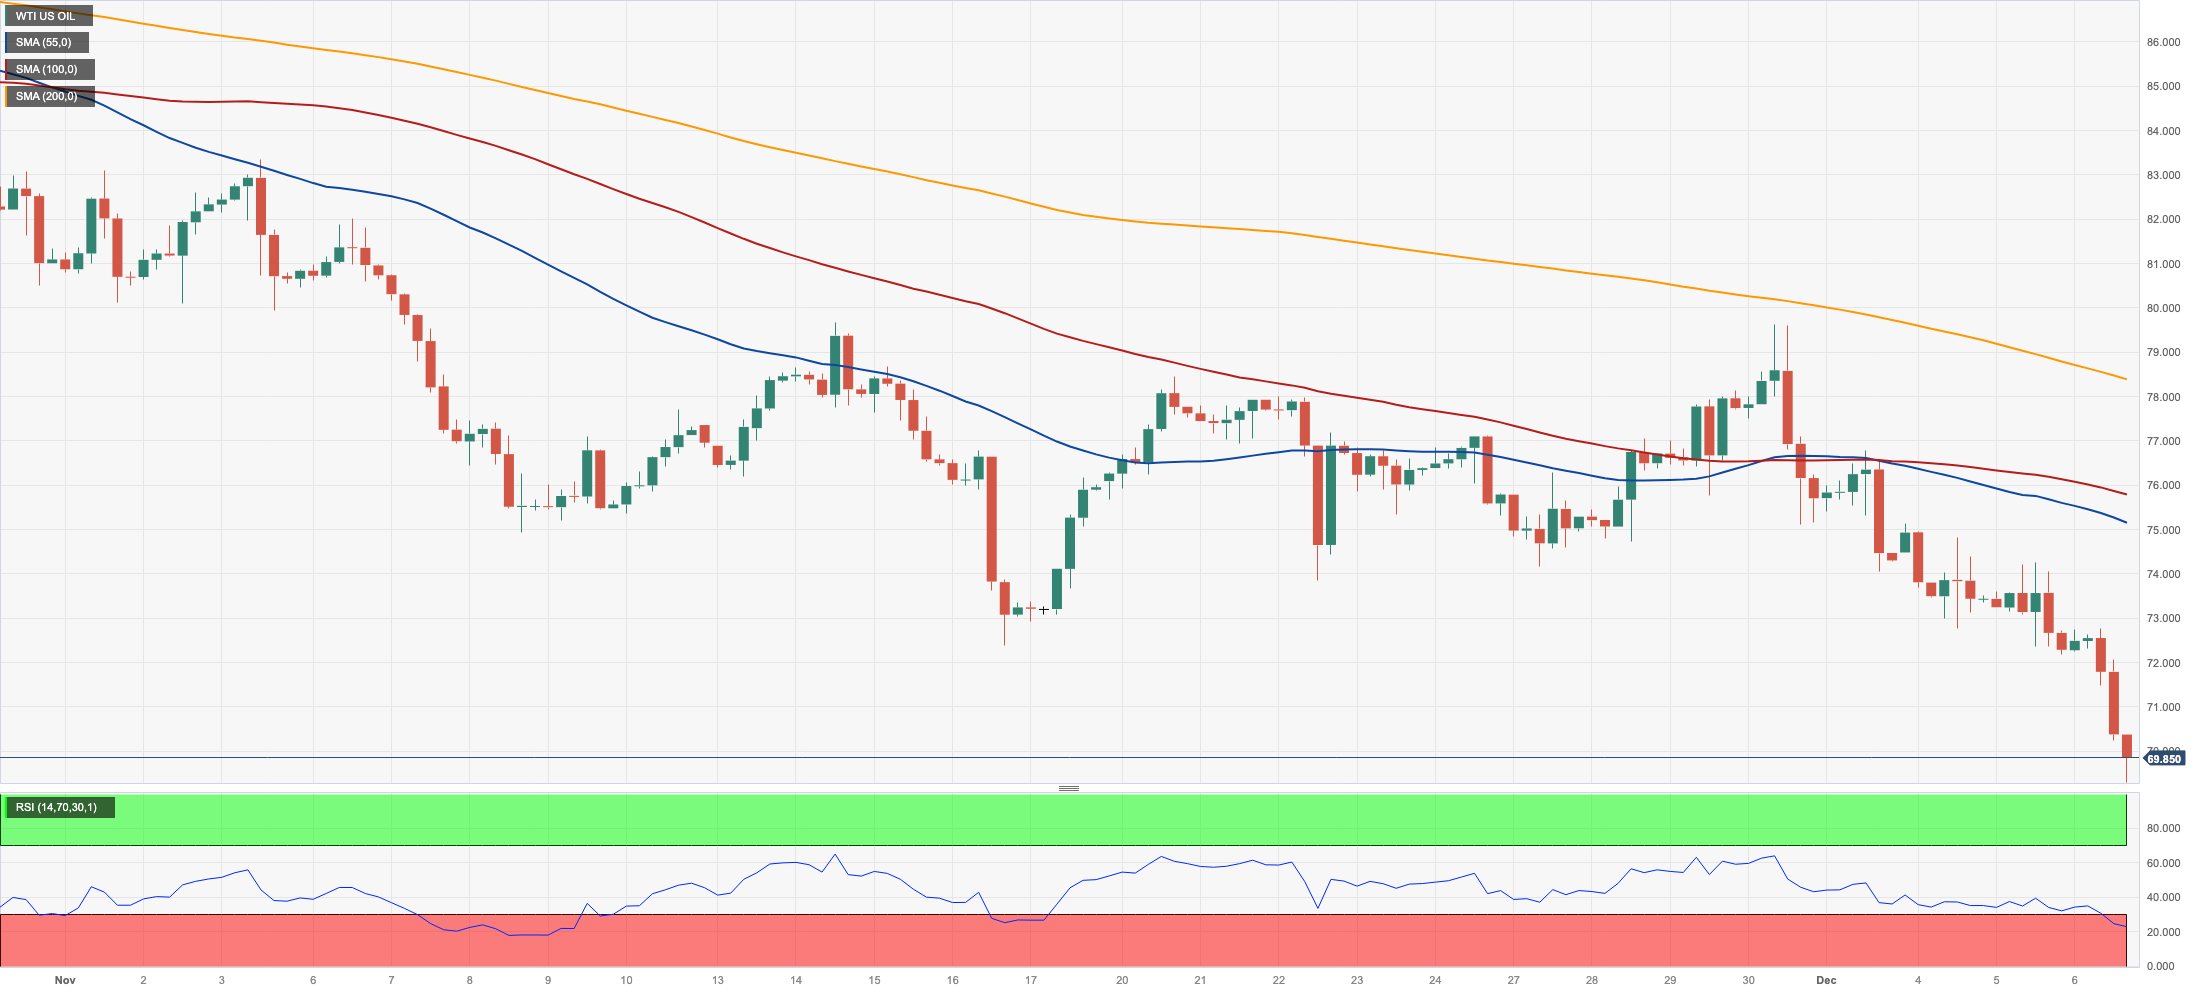
CRUDE WTI
The weakness around crude oil prices picked up pace and dragged the barrel of WTI below the key $70.00 mark per barrel for the first time since late June on Wednesday.
Extra losses in crude oil prices came on the back of persistent traders’ doubts surrounding the recently announced oil output reduction by the OPEC+, while demand worries swelled after US gasoline stockpiles increased more than expected during last week, according to the EIA.
On the latter, the agency reported that US crude oil inventories shrank by 4.632M barrels in the week to December 1, while supplies at Cushing increased by 1.829M barrels, Weekly Distillate Stocks rose by 1.267M barrels, and gasoline stockpiles went up by 5.421M barrels.
Adding to ongoing demand concerns emerged the omnipresent jitters hovering around the still-absent recovery of the Chinese economy, exacerbated after agency Moody’s downgraded China’s credit outlook to negative from stable on Tuesday.
Next on the downside for WTI emerges the 2023 bottom of $63.61 (May 4), ahead of the key $60.00 yardstick. In the other direction, a break over the critical 200-day SMA at $78.00 might reintroduce a challenge to the major $80.00 mark, which would be swiftly followed by the November top of $80.15 (November 3). Weekly peaks of $89.83 (October 18), $94.99 (September 28), and $97.65 (August 30, 2022) are all expected north from here before the psychological $100.00 level.
Resistance levels: $76.72 $79.56 $83.56 (4H chart)
Support levels: $69.13 $67.01 $63.61 (4H chart)
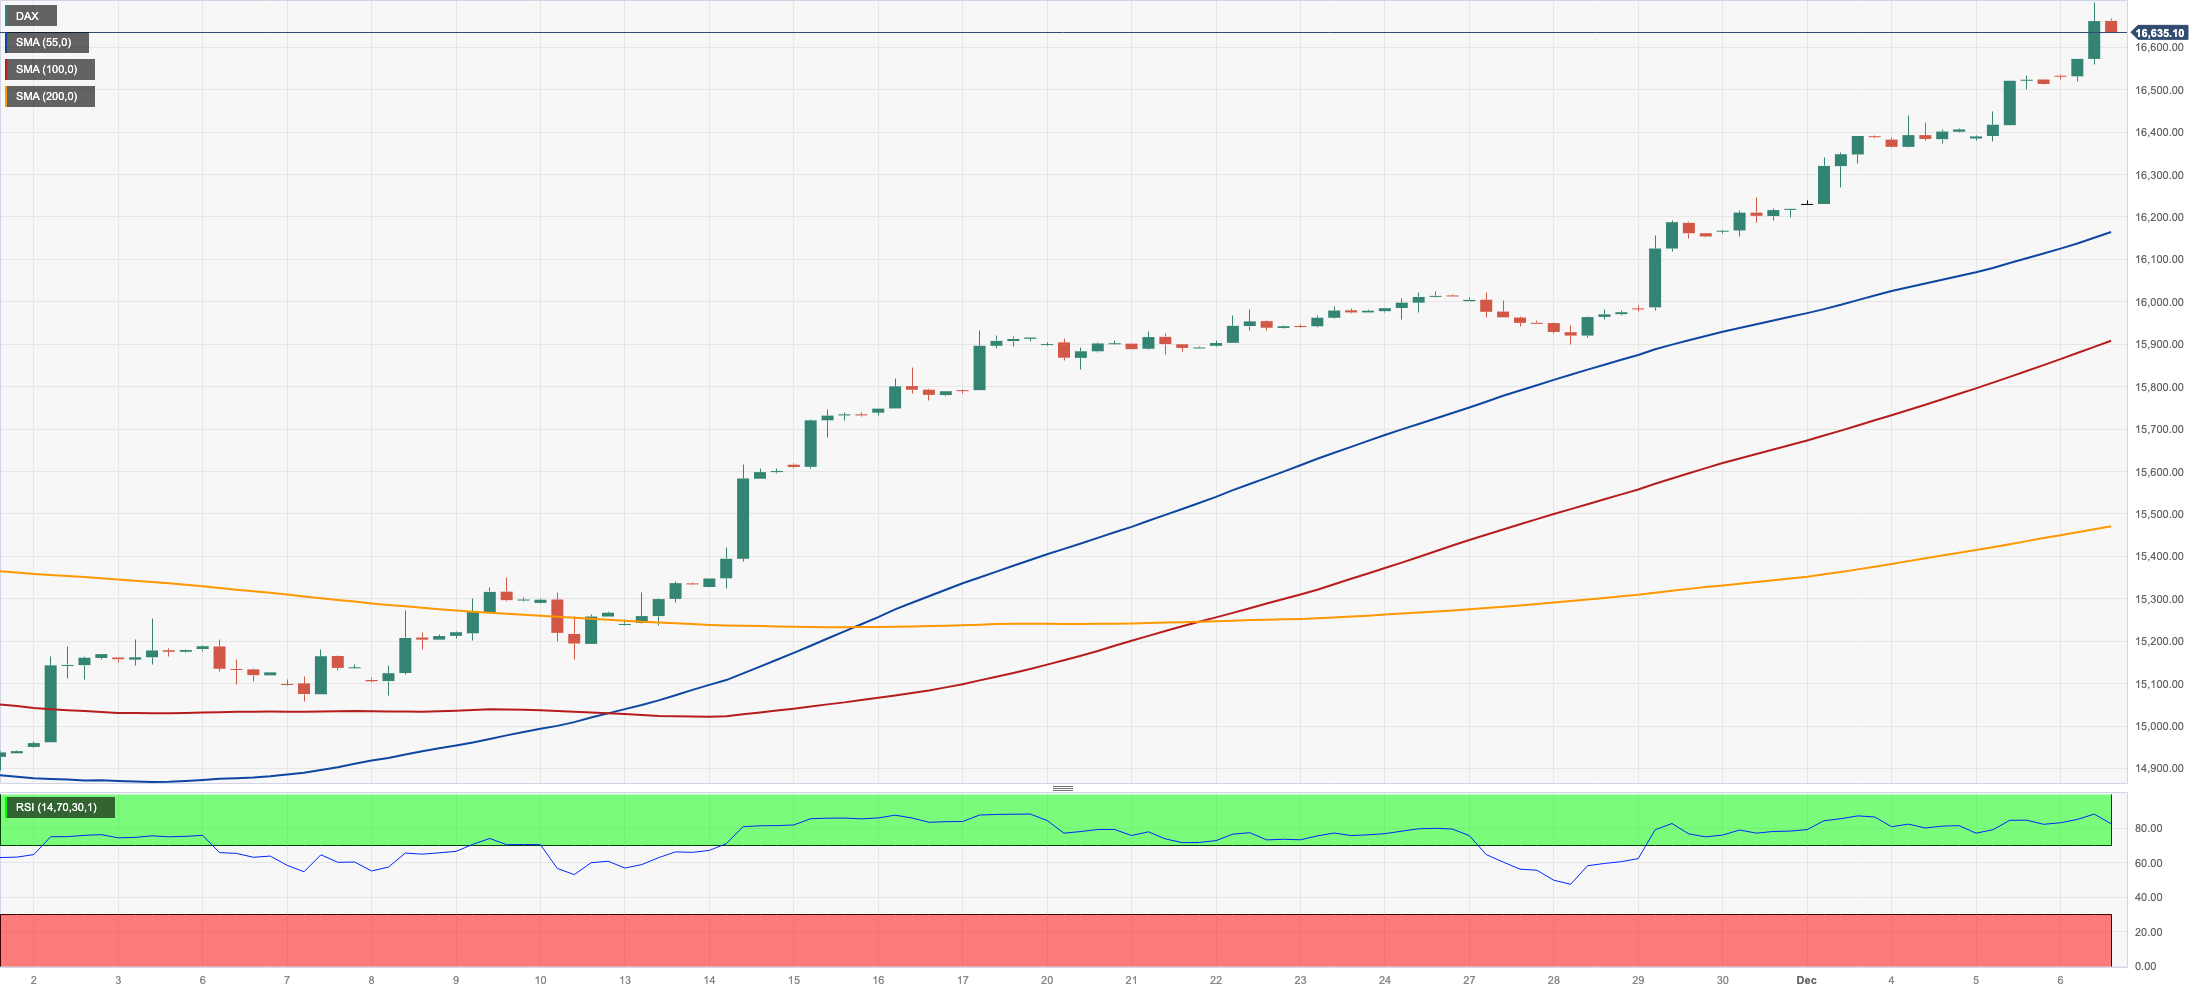
GER40
There seems to be no respite for the uptrend in Germany’s blue-chip DAX40.
In fact, the index printed a new all-time peak past the 16700 level on Wednesday, always against the backdrop of the widespread belief that the ECB could initiate rate reductions at some point in the spring of 2024, a scenario that remains propped up by many of the ECB’s rate-setters.
The same view seems to hover around the Federal Reserve, which does nothing but bolster the upbeat sentiment among investors.
In the German bond market, the 10-year bund yields dropped further and reached multi-month lows around 2.20%.
Further increases might push the DAX40 to an all-time high of 16727 (December 6). Having said that, early support might be found around the weekly low of 15915 (November 28), which is located ahead of the important 200-day SMA of 15700 and the intermediate 55-day SMA of 15434. If this zone is breached, the October bottom of 14630 (October 23) may be confronted again before the March low of 14458 (March 20). The daily RSI trespassed 83, indicating that the market was still severely overbought.
Best Performers: Volkswagen VZO, Sartorius AG VZO, Porsche
Worst Performers: Merck, Hannover Rueck SE, Munich Re Group
Resistance levels: 16727 (4H chart)
Support levels: 15915 15475 15171 (4H chart)
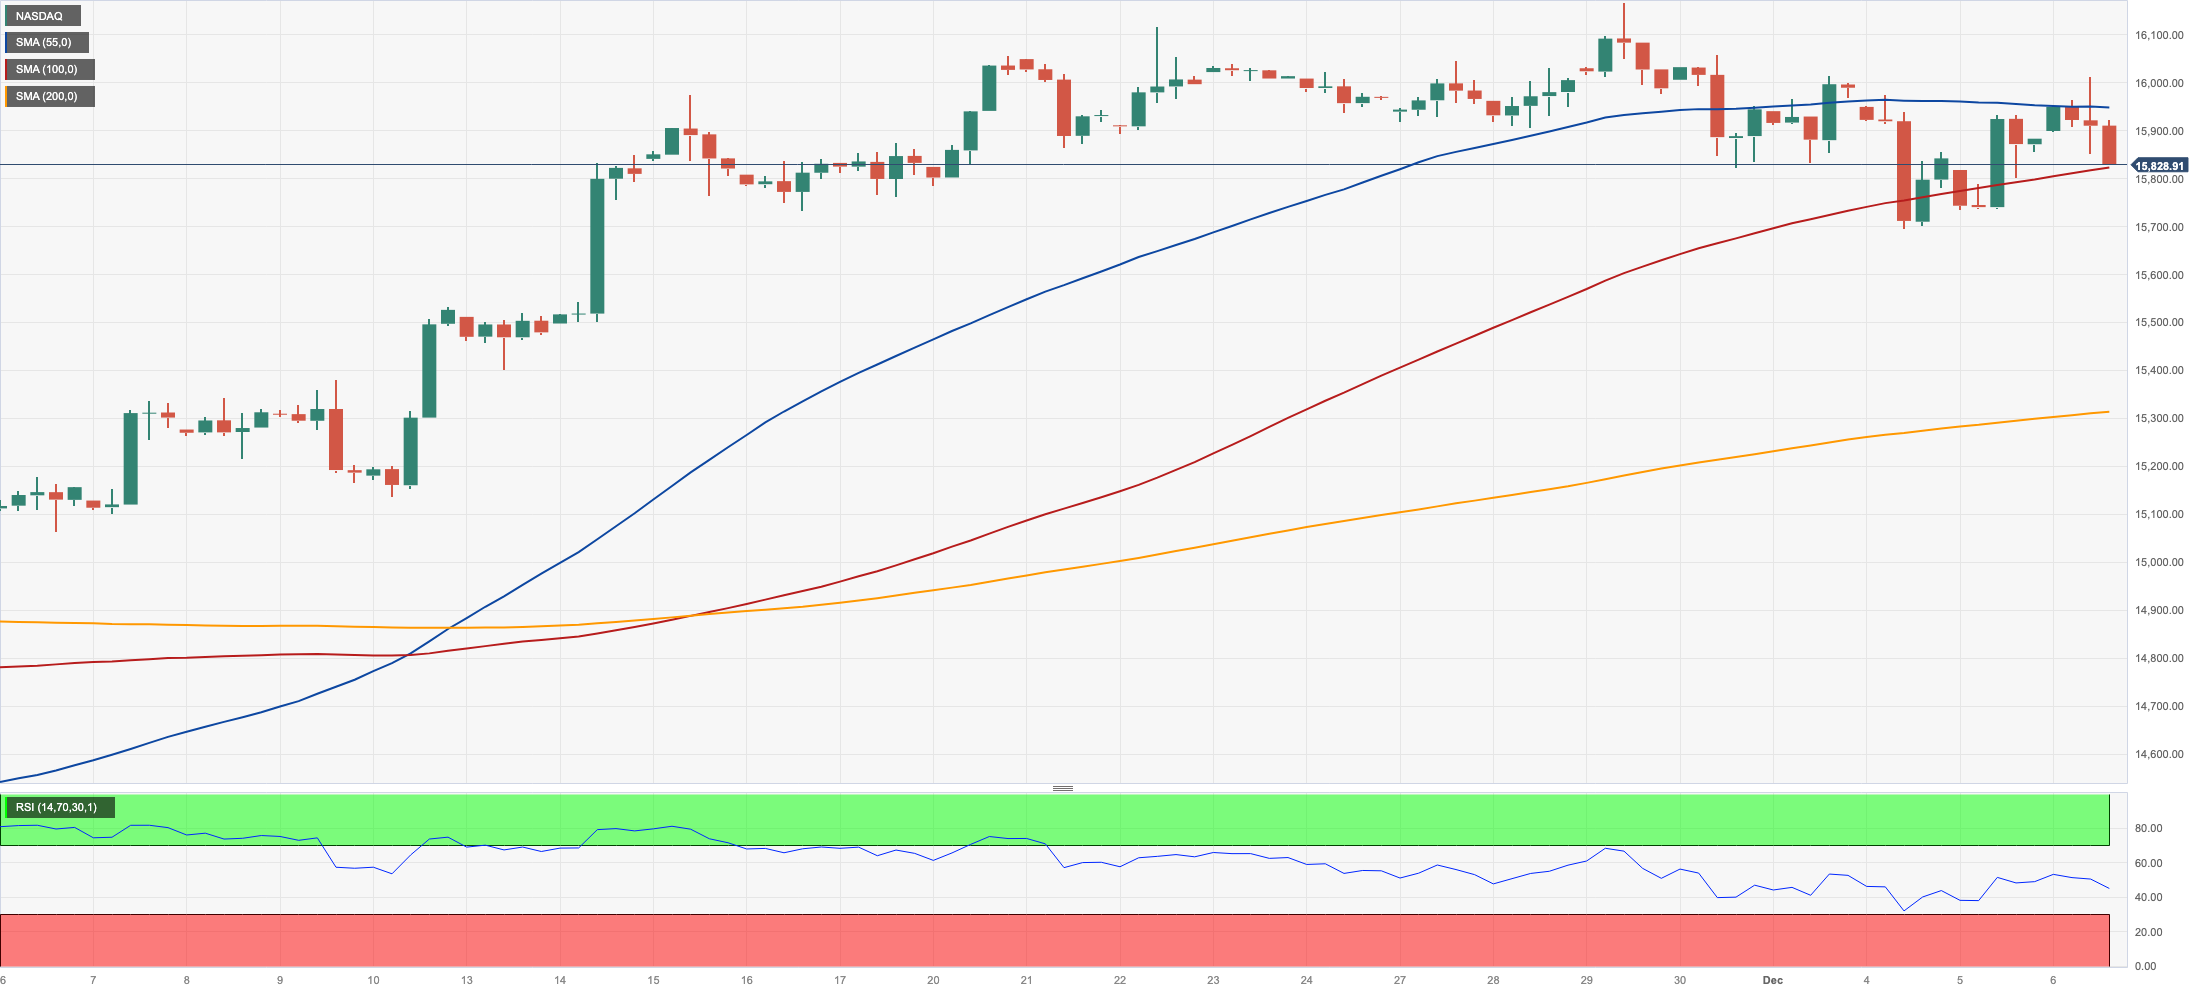
NASDAQ
In line with the vacillating mood in the rest of its US peers, the tech reference Nasdaq 100 alternated gains with losses around the 15800/16000 band on Wednesday.
Indeed, price action in the US tech sector followed developments in the bond markets, where yields advanced modestly on the short end of the curve vs. the extra downside on the belly and the long end.
Also weighing on the sentiment seems to have appeared the equally indecisive performance of the dollar and steady prudence prior to key US releases in the latter part of the week.
Immediately to the upside for the Nasdaq 100 is the 2023 peak of 16166 (November 29), prior to the December 2021 high of 16607 (December 28) and the all-time top of 16764 (November 22 2021). In the opposite direction, the 55-day SMA of 15160 should provide temporary support before the 200-day SMA of 14390 and the October low of 14058 (October 26). Further losses might put the April bottom of 12724 (April 25) under jeopardy, as well as the March low of 11695 (March 13) and the 2023 low of 10696 (January 3). On the daily chart, the RSI appeared to be consistent near 60.
Top Gainers: Lucid Group, Moderna, Walgreen Boots
Top Losers: Old Dominion Freight Line, Constellation Energy, Baker Hughes
Resistance levels: 16166 16607 16764 (4H chart)
Support levels: 15695 15223 14058 (4H chart)
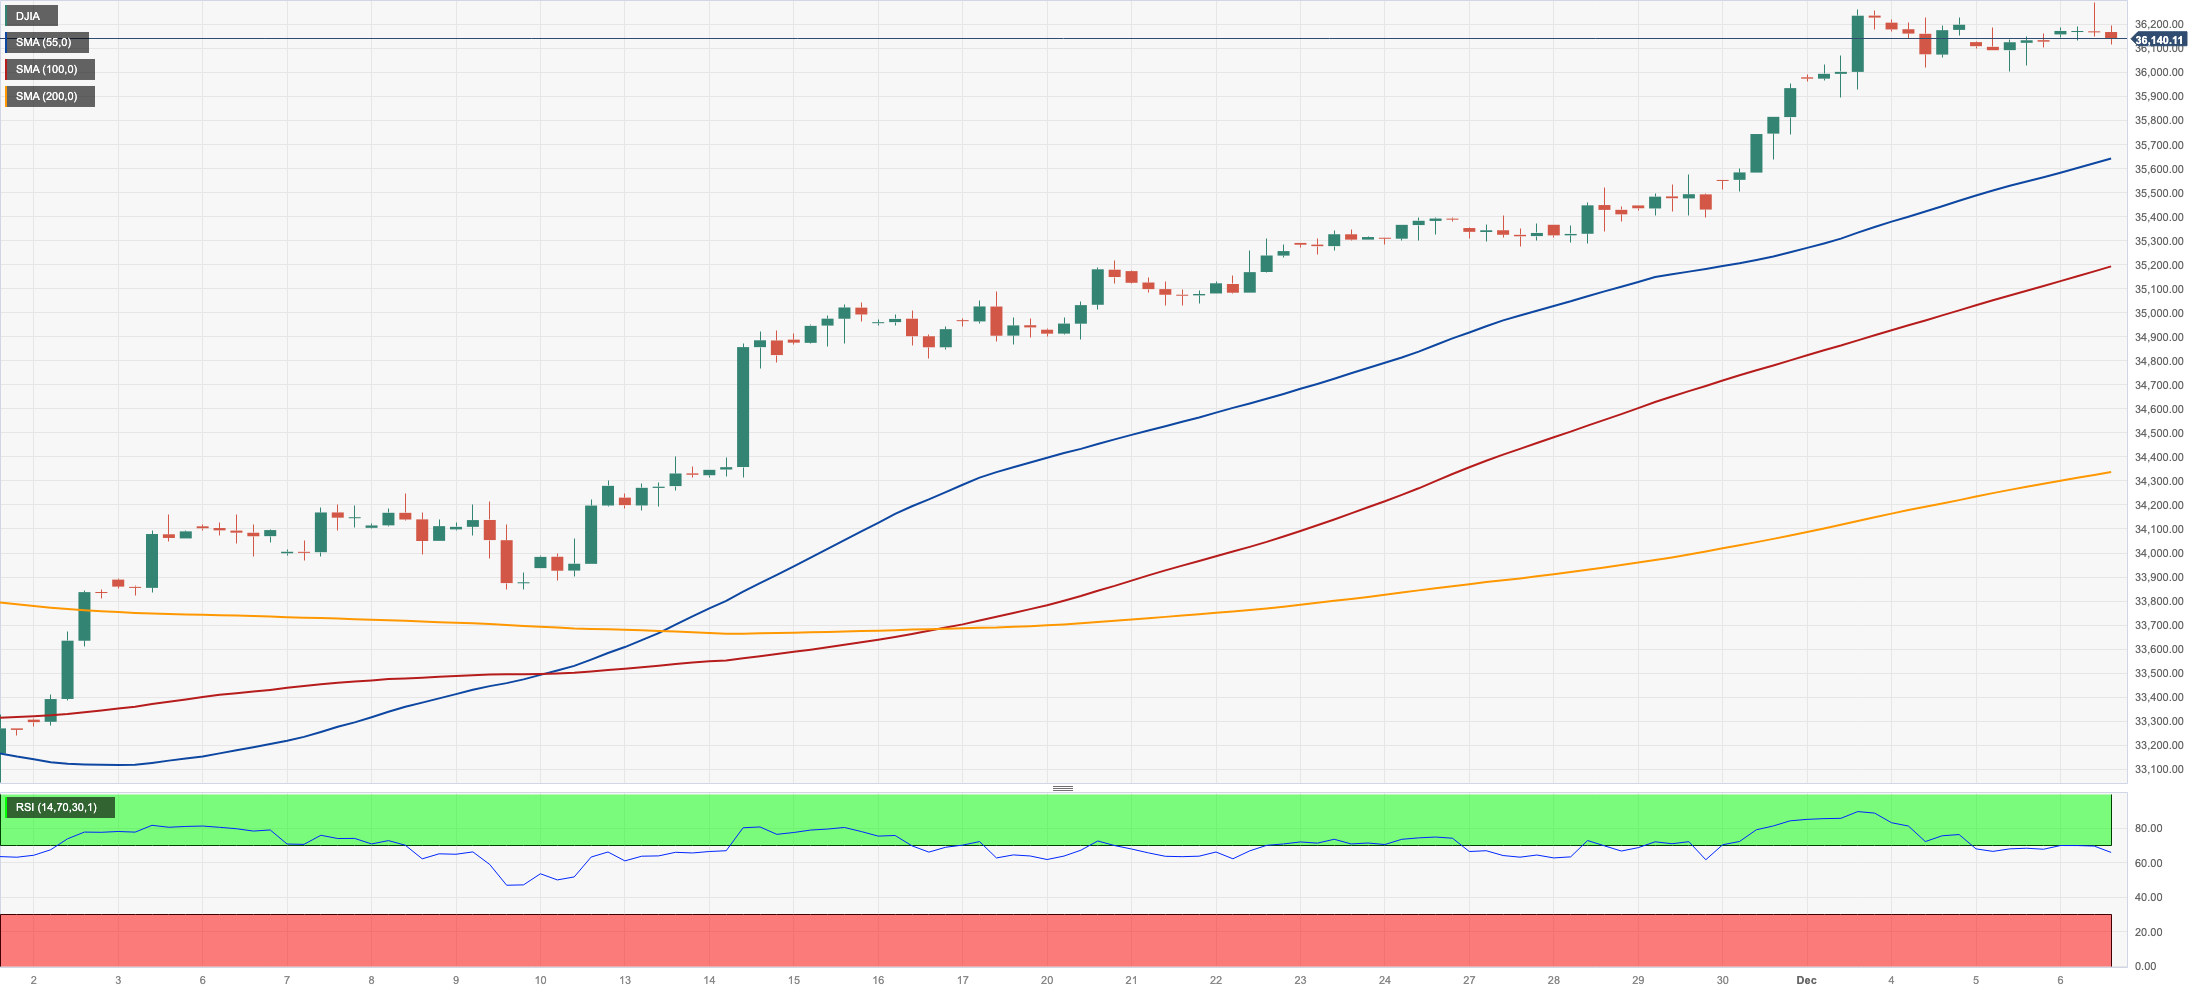
DOW JONES
US equities traded within a tight range, leaving the benchmark Dow Jones slightly up for the day near the 36200 region, all after hitting a new yearly high around 36300 soon after the opening bell on Wall Street on Wednesday.
In fact, price action around the key index remained inconclusive amidst rising cautiousness ahead of the release of the always-relevant Nonfarm Payrolls on Friday, while optimism about a potential rate cut by the Fed in Q2 2024 looked steady among market participants.
On the whole, the Dow Jones gained 0.12% to 36166, the S&P500 advanced 0.05% to 4569, and the tech-oriented Nasdaq Composite rose 0.13% to 14248.
If the Dow Jones breaks above the 2023 high of 36292 (December 6), it may meet the all-time top of 36952 (January 5, 2022) before reaching the round level of 37000. The 100-day SMA of 34483, on the other hand, provides temporary support, which is backed up by the 200-day SMA of 33941 and the weekly low of 33859 (November 7). From here, the October low of 32327 (October 27) is reached, seconded by the 2023 low of 31429 (March 15) and the 2022 low of 28660 (October 13). The daily RSI dipped somewhat to the sub-77 area, but it is still well over the overbought mark.
Top Performers: Walgreen Boots, Boeing, 3M
Worst Performers: American Express, Walmart, J&J
Resistance levels: 36292 36513 36952 (4H chart)
Support levels: 34477 33859 32327 (4H chart)
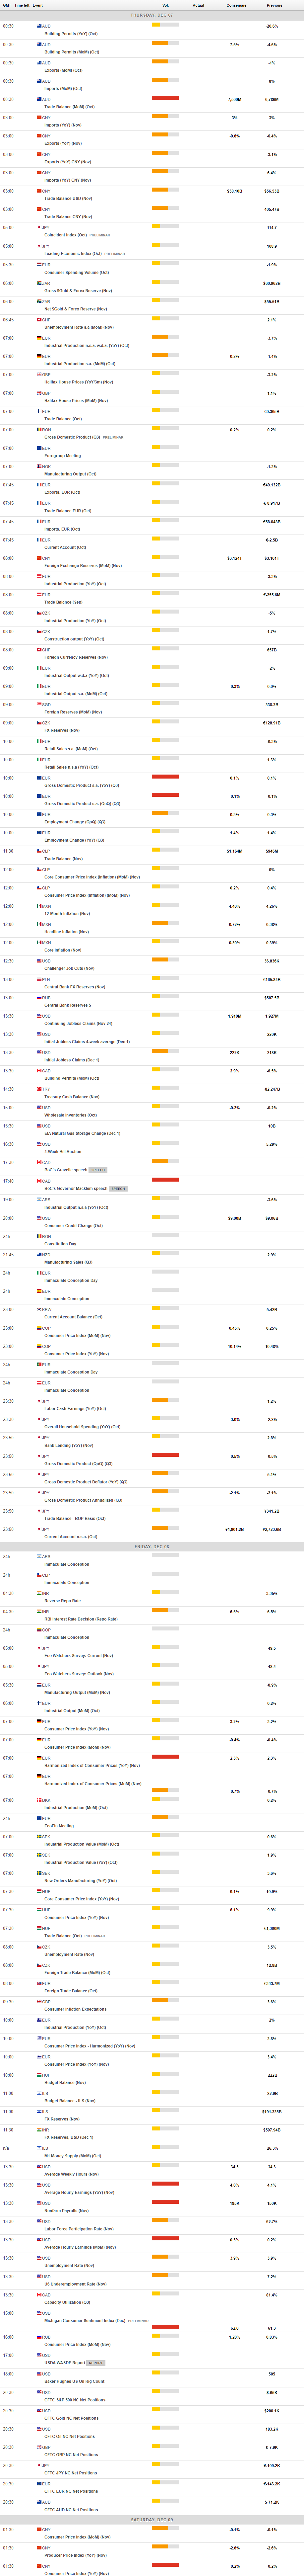
MACROECONOMIC EVENTS
All Information & Updates provided by:

All information relating to the financial markets available on this page has been prepared and issued by FXStreet (Forexstreet SL, Spain, Reg: B62498233) on the basis of publicly available information and all information believed to be reliable and does not conflict with Kuwaiti local laws, and all necessary care has been taken to before the company to ensure that the facts mentioned are correct from the source.
NCM Investment nor any of its directors or employees shall in any way be held responsible for the contents of this news, and the information contained on this page is intended only to provide clients with publicly available information and should not be construed as investment advice, report or analysis and/or constitute an offer or invitation to buy or sell financial instruments of any kind.
RISK WARNING: Forex and CFDs are highly risky leveraged products, as losses can exceed deposits. Please ensure you understand all the risks and take independent advice if necessary. NCM will segregate the clients based on the criteria of the regulator and its bylaws. NCM does not provide any advisory service; the material published does not constitute advice or a recommendation for a transaction in any financial instrument. NCM accepts no responsibility for any use of the content presented and any consequences of that use. Anyone acting on the information provided does so at their own risk.