
- Contact Us:
-

-

-

-


Daily Market Updates
08 Dec 2023
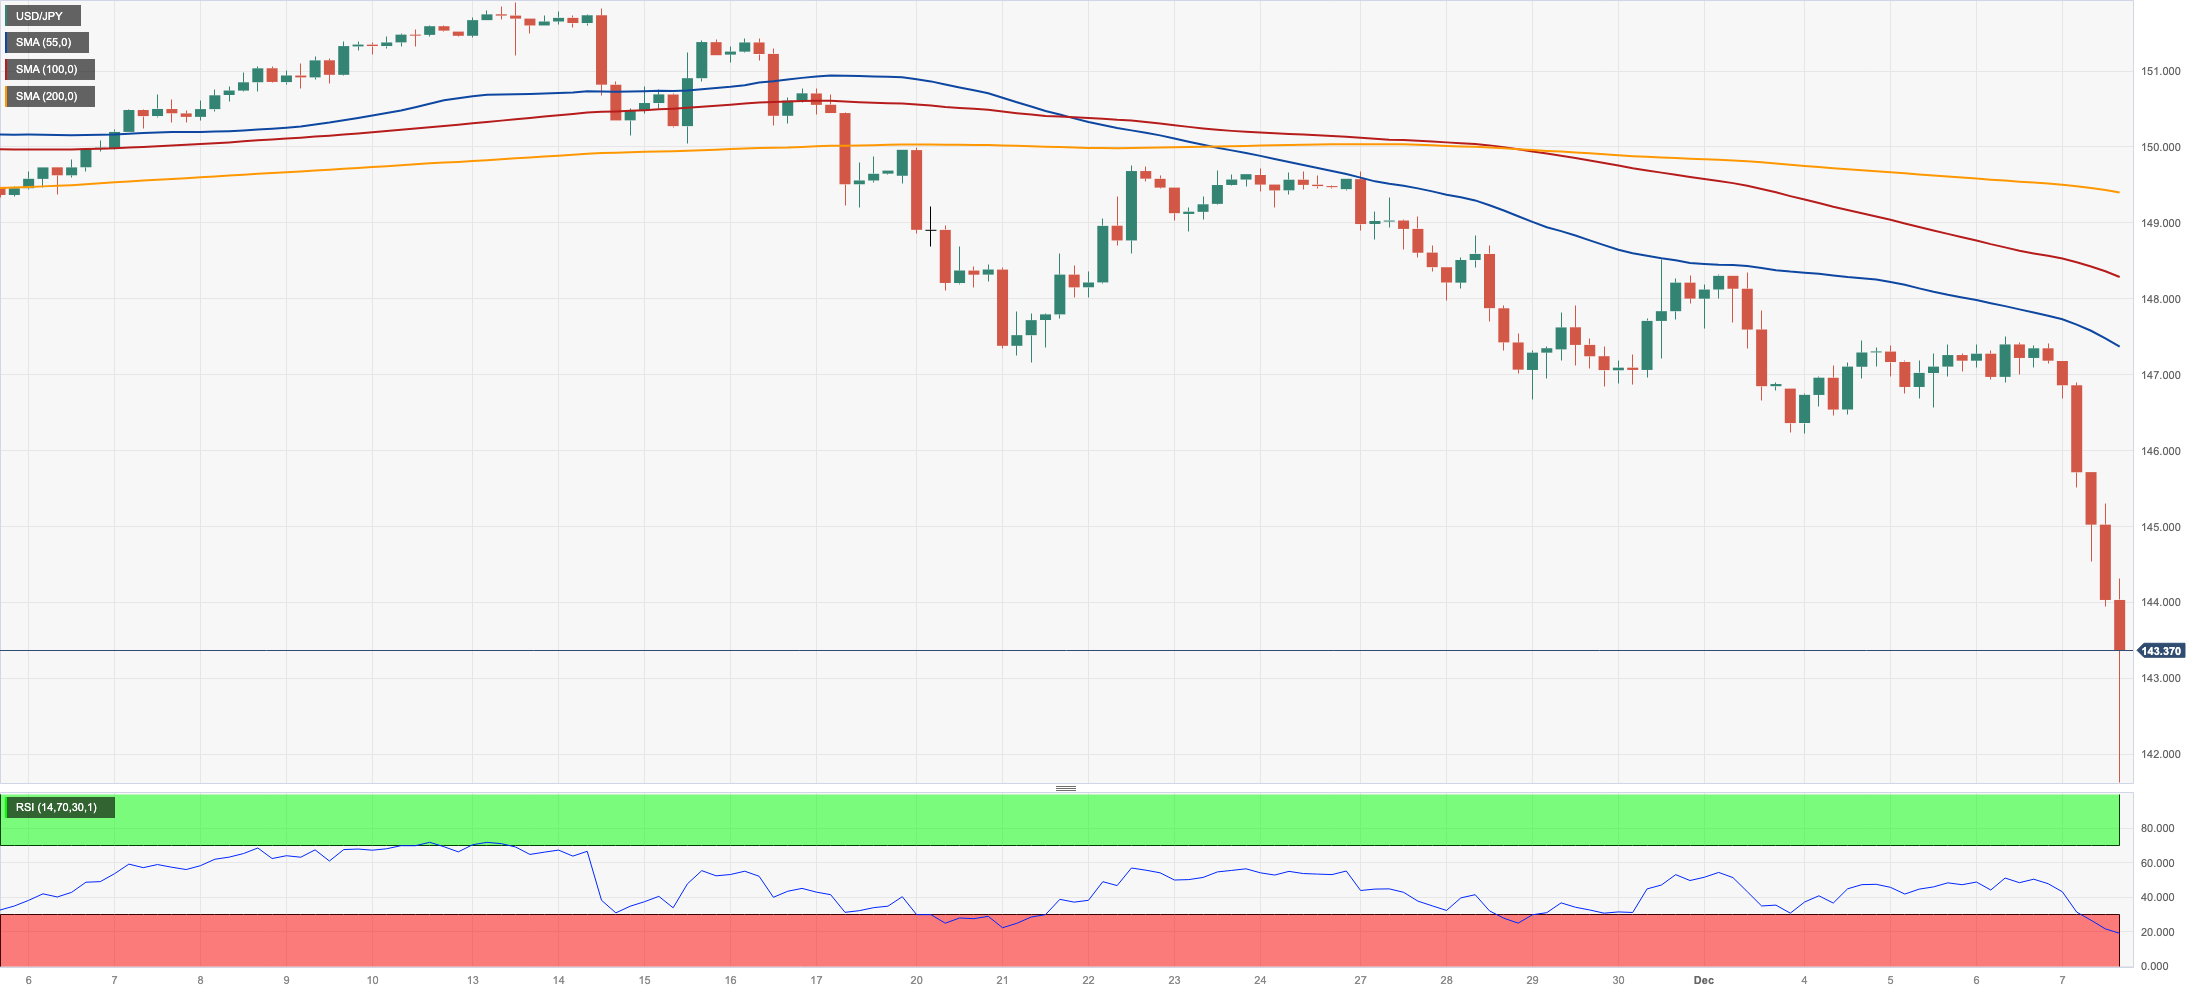
USDJPY
Increased and renewed speculation of a BoJ’s lift-off lent unexpected wings to the Japanese yen, dragging USD/JPY to a level last traded in early August around 141.60 on Thursday.
Indeed, the strong appreciation of the Japanese currency came after BoJ Governor K. Ueda mentioned that there would be diverse options for the policy rate upon the commencement of the tightening cycle, encompassing the overnight lending rate. Additionally, he remarked on the numerous possibilities for implementing a tiered system when the bank initiates rate increases. Despite this, he expressed that it was premature to conduct an exit simulation. He emphasized the necessity for the bank to communicate beforehand to guarantee a seamless exit.
Also collaborating with the robust buying bias of the yen, JGB 10-year yields jumped to the proximity of 0.80%, reversing three consecutive daily pullbacks.
In the docket, Foreign Bond Investment increased by ¥64.5B in the week to December 2. Additionally, preliminary readings saw the Coincident Index at 115.9 in October and the Leading Economic Index at 108.7.
If the December low of 141.60 (December 7) is broken, USD/JPY may fall to the August low of 141.50 (August 7), which comes prior to the July bottom of 137.23 (July 14). Immediately to the upside aligns the temporary 55-day SMA at 149.34 prior to the 2023 peak of 151.90 (November 13) and the 2022 high of 151.94 (October 21), all prior to the round number of 152.00. The RSI flirted with the oversold zone near 30.
Resistance levels: 147.49 148.52 149.45 (4H chart)
Support levels: 141.60 141.50 138.05 (4H chart)
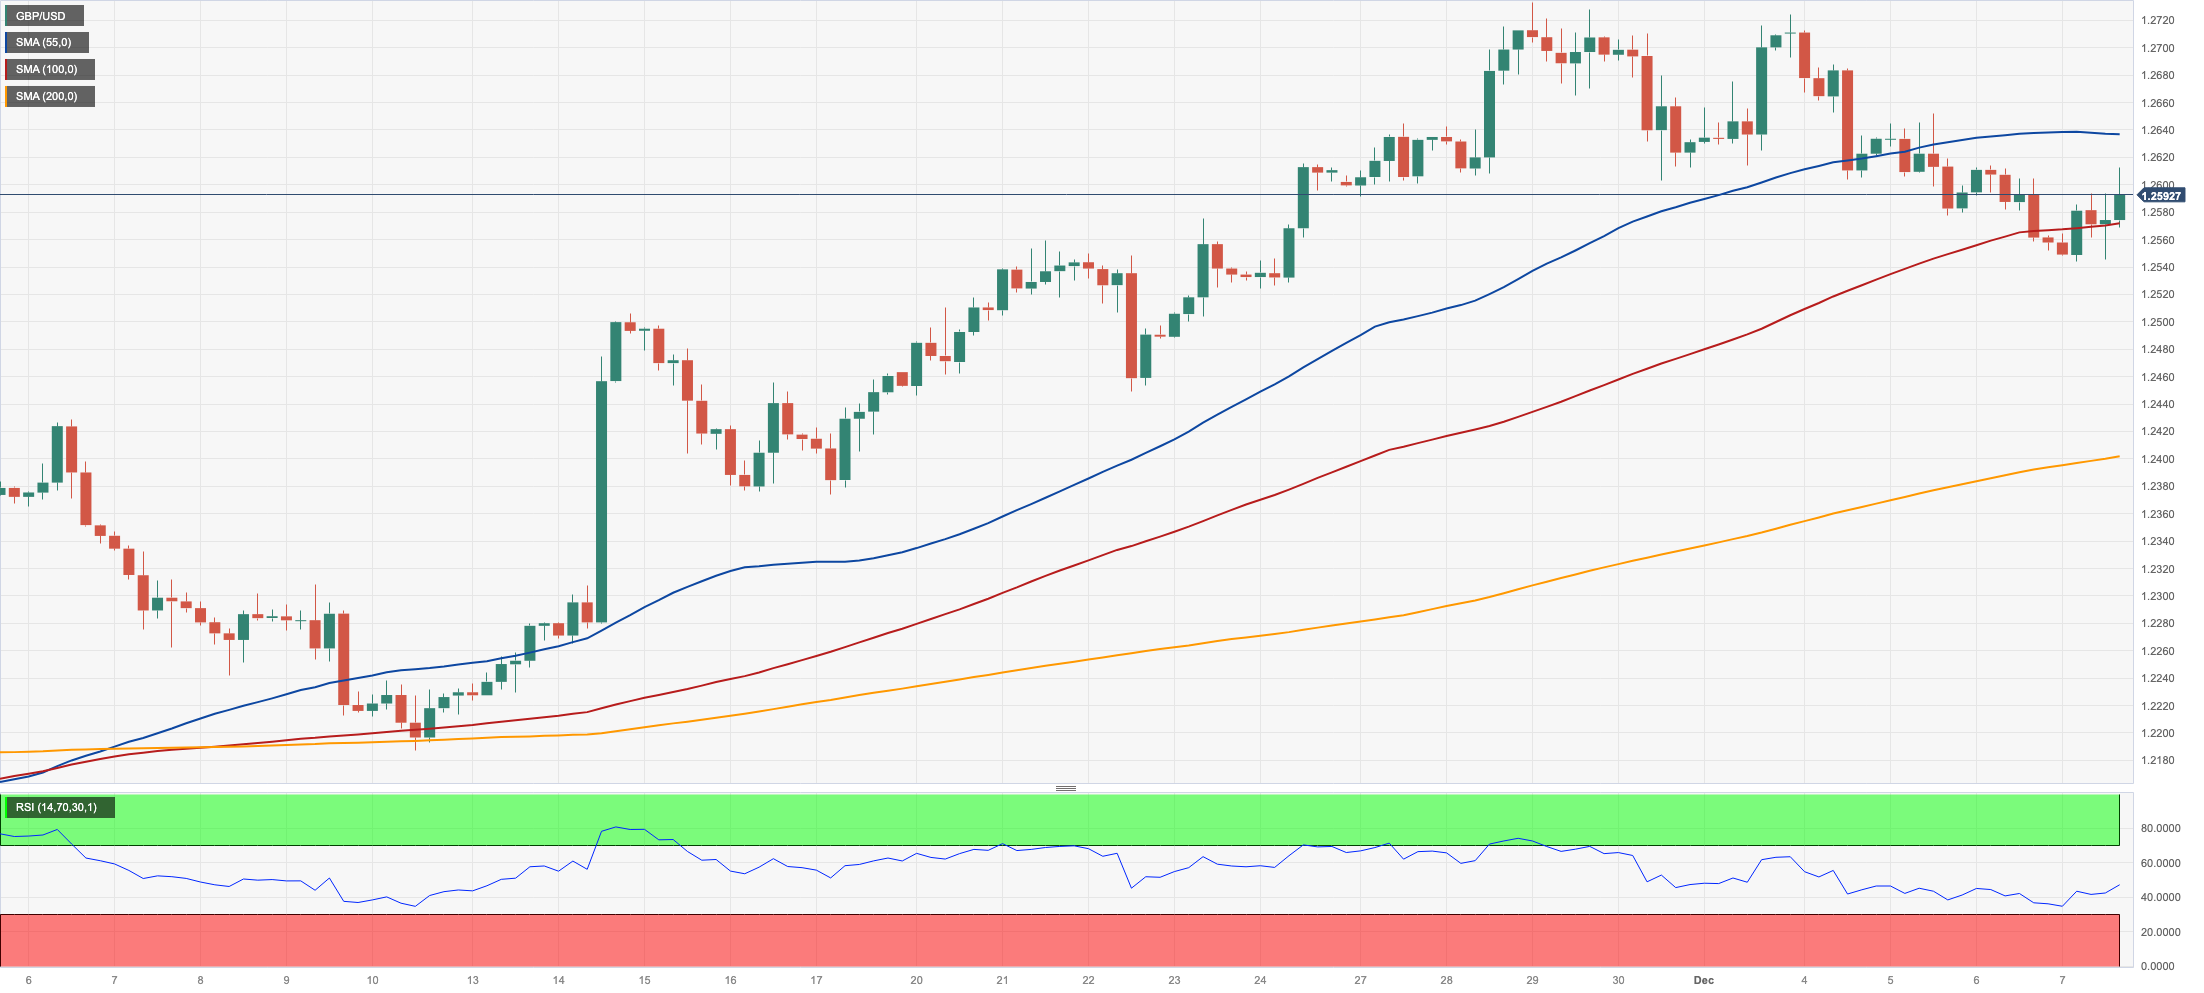
GBPUSD
The firm pullback in the greenback gave some much-needed oxygen to the risk-associated universe on Thursday, sparking the first session of gains for GBP/USD after three daily declines in a row.
In fact, Cable managed to rebound from multi-day lows near 1.2540 and surpassed the 1.2600 hurdle on the back of the dollar’s retracement and the better tone in the risky assets, while UK 10-year gilt yields regained some balance and reclaimed the area above the key 4.0% hurdle.
In the UK, house prices tracked by Halifax rose by 0.5% MoM in November and contracted by 1.0% over the last twelve months.
The November top of 1.2733 represents the next upward barrier for GBP/USD (November 29). If this level is trespassed, the door might be opened to weekly peaks of 1.2746 (August 30), 1.2818 (August 10), and 1.2995 (July 27), which all occur before the critical 1.3000 yardstick. The crucial 200-day SMA at 1.2481, on the other hand, is projected to give early support ahead of the fragile 55-day SMA at 1.2317. The weekly low of 1.2187 (November 10) comes next and is followed by the October low of 1.2037 (October 3), both of which are ahead of the critical 1.2000 level and the 2023 low of 1.1802 (March 8). The daily RSI improved past 57.
Resistance levels: 1.2715 1.2733 1.2746 (4H chart)
Support levels: 1.2544 1.2448 1.2373 (4H chart)
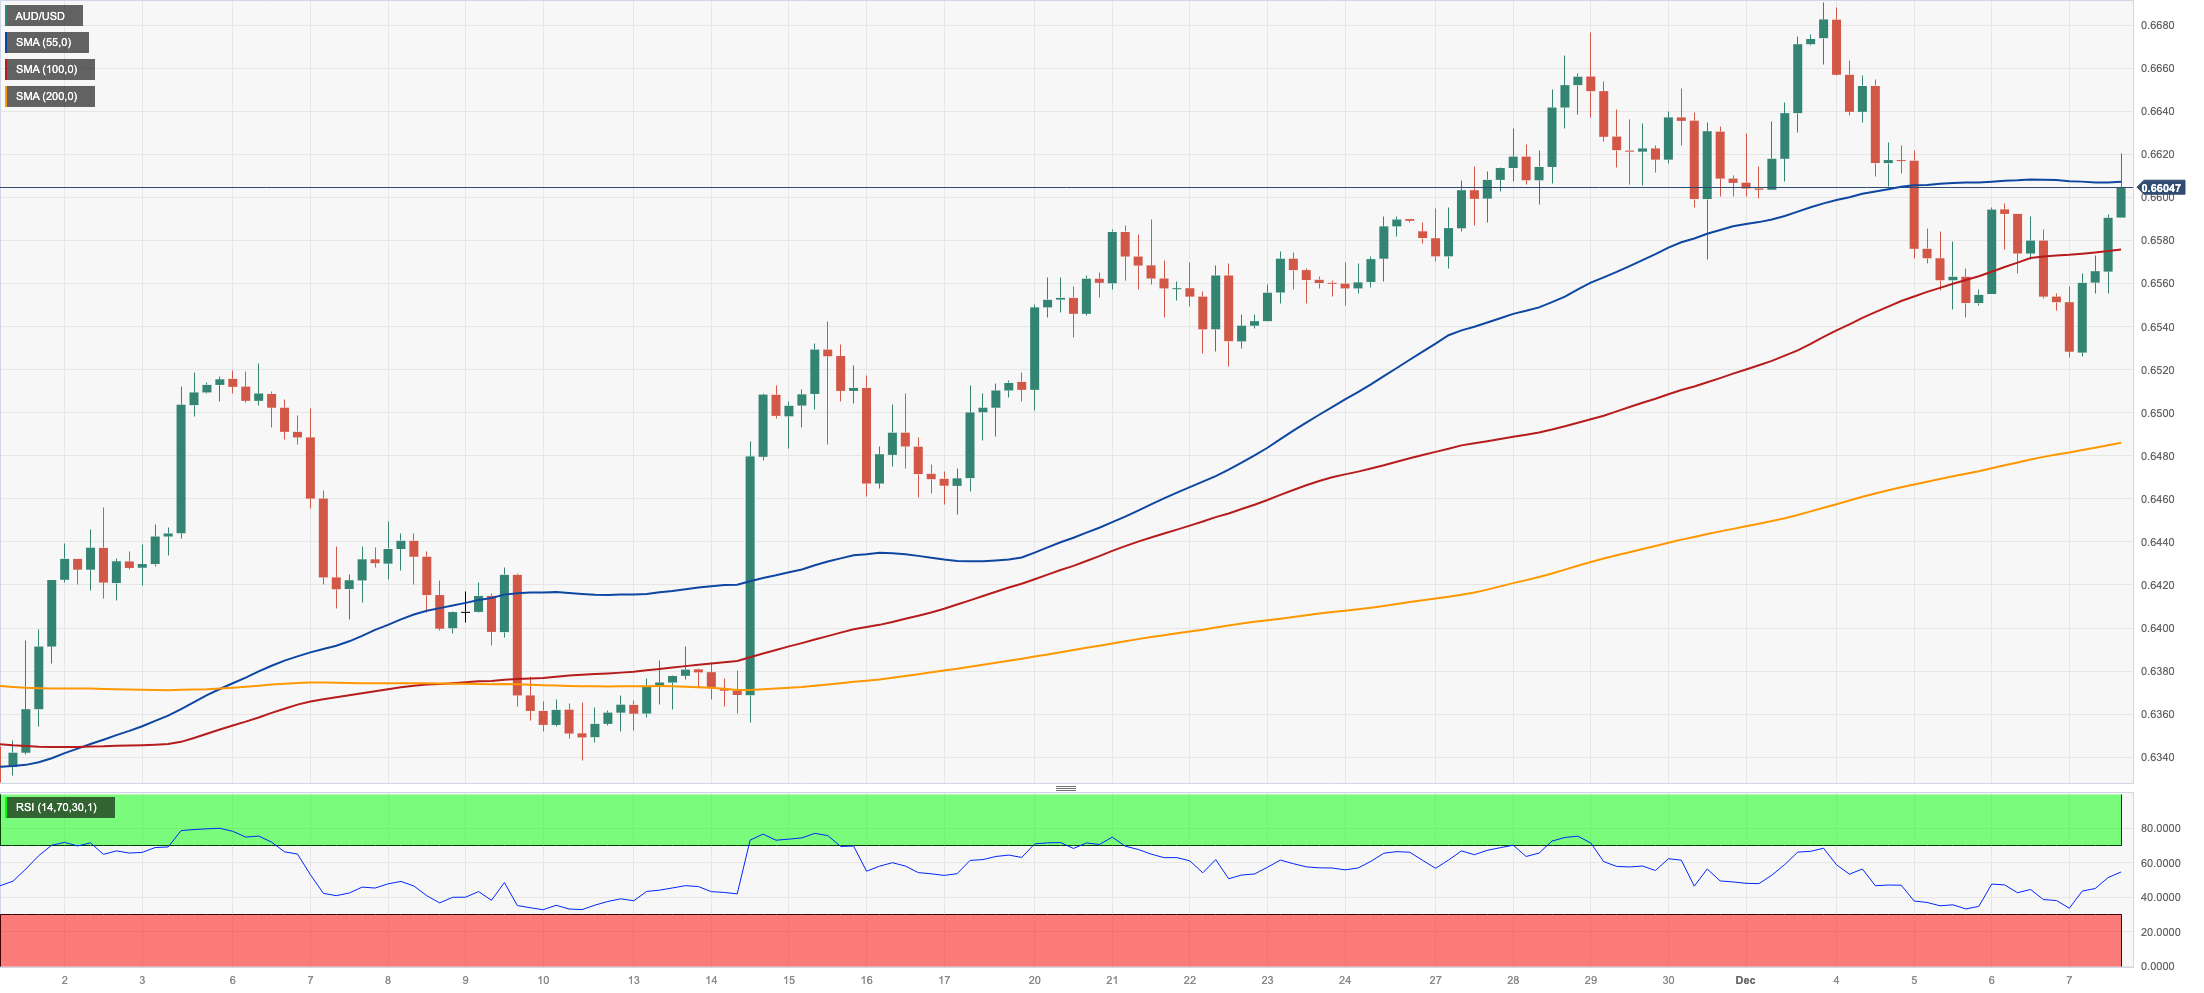
AUDUSD
AUD/USD advanced strongly and managed to regain the key barrier of 0.6600 the figure and beyond after three straight sessions in the red territory on Thursday.
The daily improvement in the Aussie dollar followed the broad-based upbeat sentiment in the risk complex, helped by the much weaker dollar, encouraging trade balance readings from China, and positive developments in the commodity galaxy, particularly higher copper and iron ore prices.
Data-wise, in Australia, October’s trade surplus widened to A$7.129B.
If the AUD/USD falls below the December low of 0.6525 (December 7), it could retest the interim 100-day and 55-day SMAs at 0.6466 and 0.6438, respectively. If the latter is dropped, a move to the 2023 bottom of 0.6270 (October 26) might appear on the horizon before the round level of 0.6200 and the 2022 low of 0.6169 (October 13). On the flip side, the next stumbling block is the December high of 0.6690 (December 4). A break above this level might launch a challenge to the July top of 0.6894 (July 14), which is just ahead of the June high of 0.6899 (June 16) and the crucial 0.7000 level. The daily RSI increased north of the 58 yardstick.
Resistance levels: 0.6605 0.6690 0.6739 (4H chart)
Support levels: 0.6525 0.6479 0.6452 (4H chart)
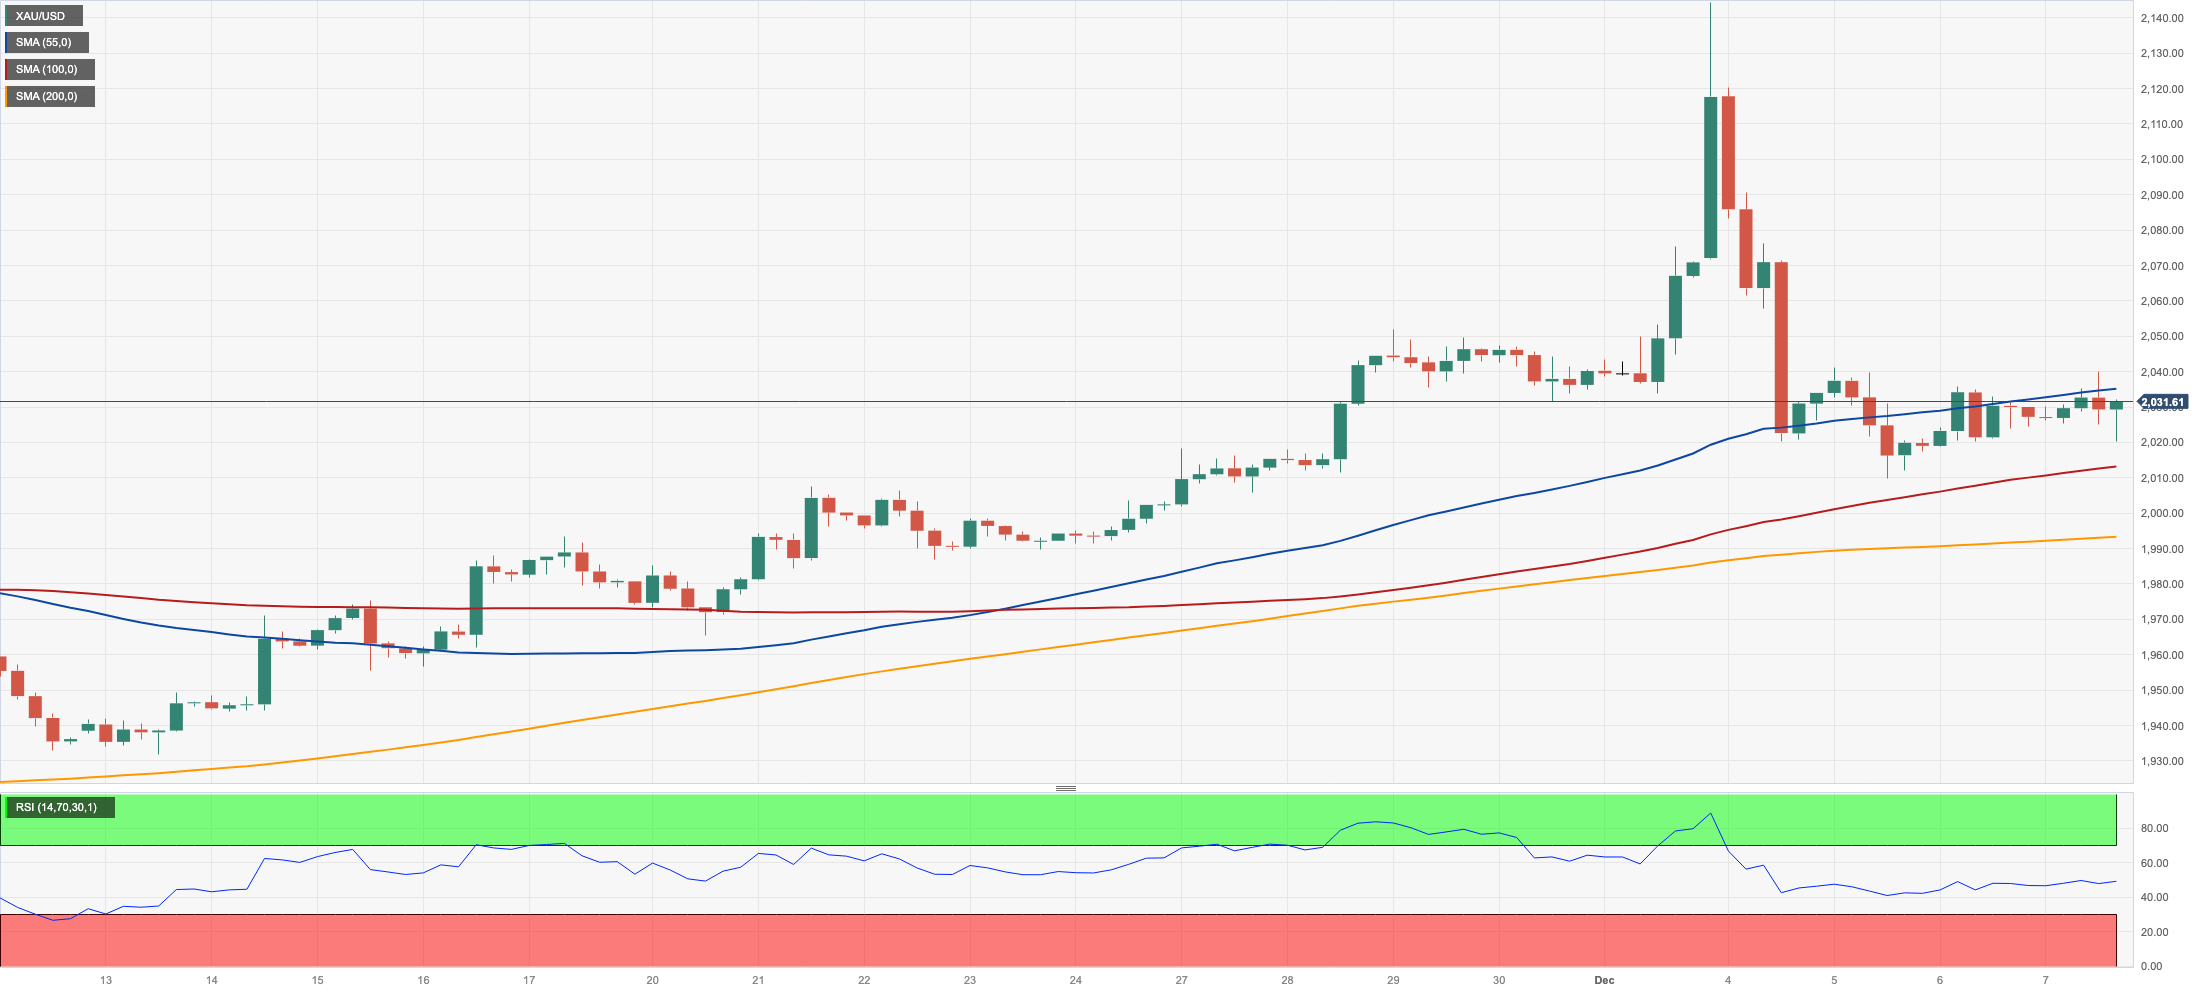
GOLD
Gold prices rose for the second session in a row, managing to keep business above the $2020 region per troy ounce on Thursday.
The sharp pullback in the greenback dragged the USD Index (DXY) to three-day lows near 103.30, underpinning the recovery in the precious metal, which was also bolstered by the mixed performance of US yields across the curve.
Meanwhile, this week holds significant significance for the commodity as it anticipates the unveiling of crucial US Nonfarm Payrolls data on Friday. Additionally, the anticipation of potential easing by the Federal Reserve by Q2 2024 is viewed as a factor that could restrain occasional periods of weakness in the gold market for the time being.
If the bulls push harder, the all-time high of $2149 will be the next gold milestone (December 4). Instead, bearish attempts might push the yellow metal below the 200-day SMA of $1949 before the November low of $1931 (November 13). If this level is breached, the October low of $1810 (October 6) might be in play, followed by the 2023 low of $1804 (February 28) and the critical $1800 contention zone.
Resistance levels: $2041 $2149 (4H chart)
Support levels: $2009 $1992 $1965 (4H chart)
CRUDE WTI
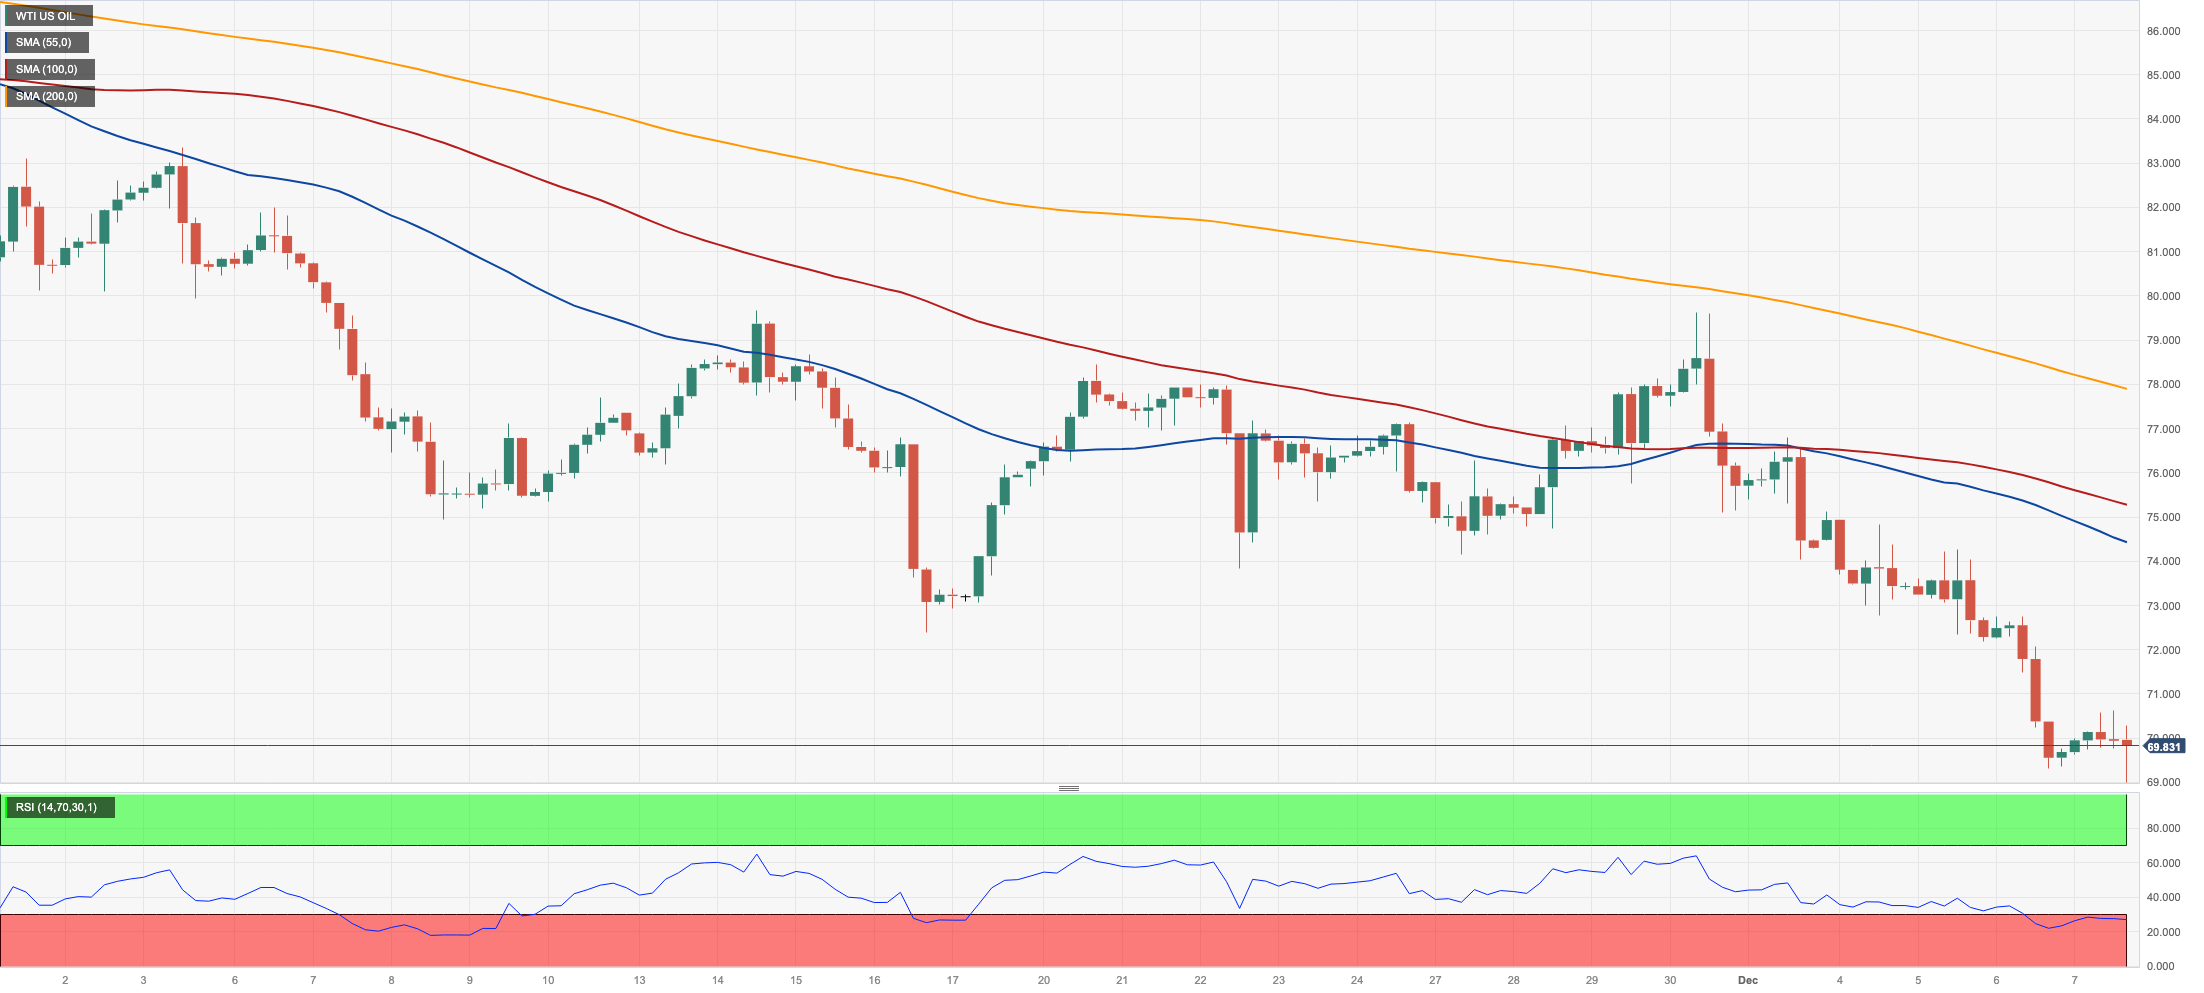
WTI prices alternated gains with losses in the area of six-month lows in the sub-$69.00 region on Thursday.
Further weakness around crude oil came on the back of persevering demand concerns, mainly stemming from China, while increasing US production and the unexpectedly large drop in weekly gasoline stockpiles (+5.421M barrels), as reported by the EIA, also added to the ongoing sour sentiment among traders.
Sustaining the above also emerged unabated scepticism following the recent decision by the OPEC+ to reduce the cartel’s oil output, while market participants kept digesting Tuesday’s downgrade of China’s credit outlook to negative by agency Moody’s.
If WTI clears the December low of $68.63 (December 7) it could then dispute the 2023 bottom of $63.61 (May 4) prior to the critical $60.00 yardstick. In the other direction, a break over the 200-day SMA at $77.96 might reintroduce a challenge to the significant $80.00 level, which would be quickly followed by the November high of $80.15 (November 3). Further gains from here could revisit the weekly high of $89.83 (October 18) seconded by the 2023 top of $94.99 (September 28). Further up comes the August 2022 peak of $97.65 (August 30) before the psychological $100.00 mark per barrel.
Resistance levels: $76.72 $79.56 $83.56 (4H chart)
Support levels: $68.83 $67.01 $63.61 (4H chart)
GER40
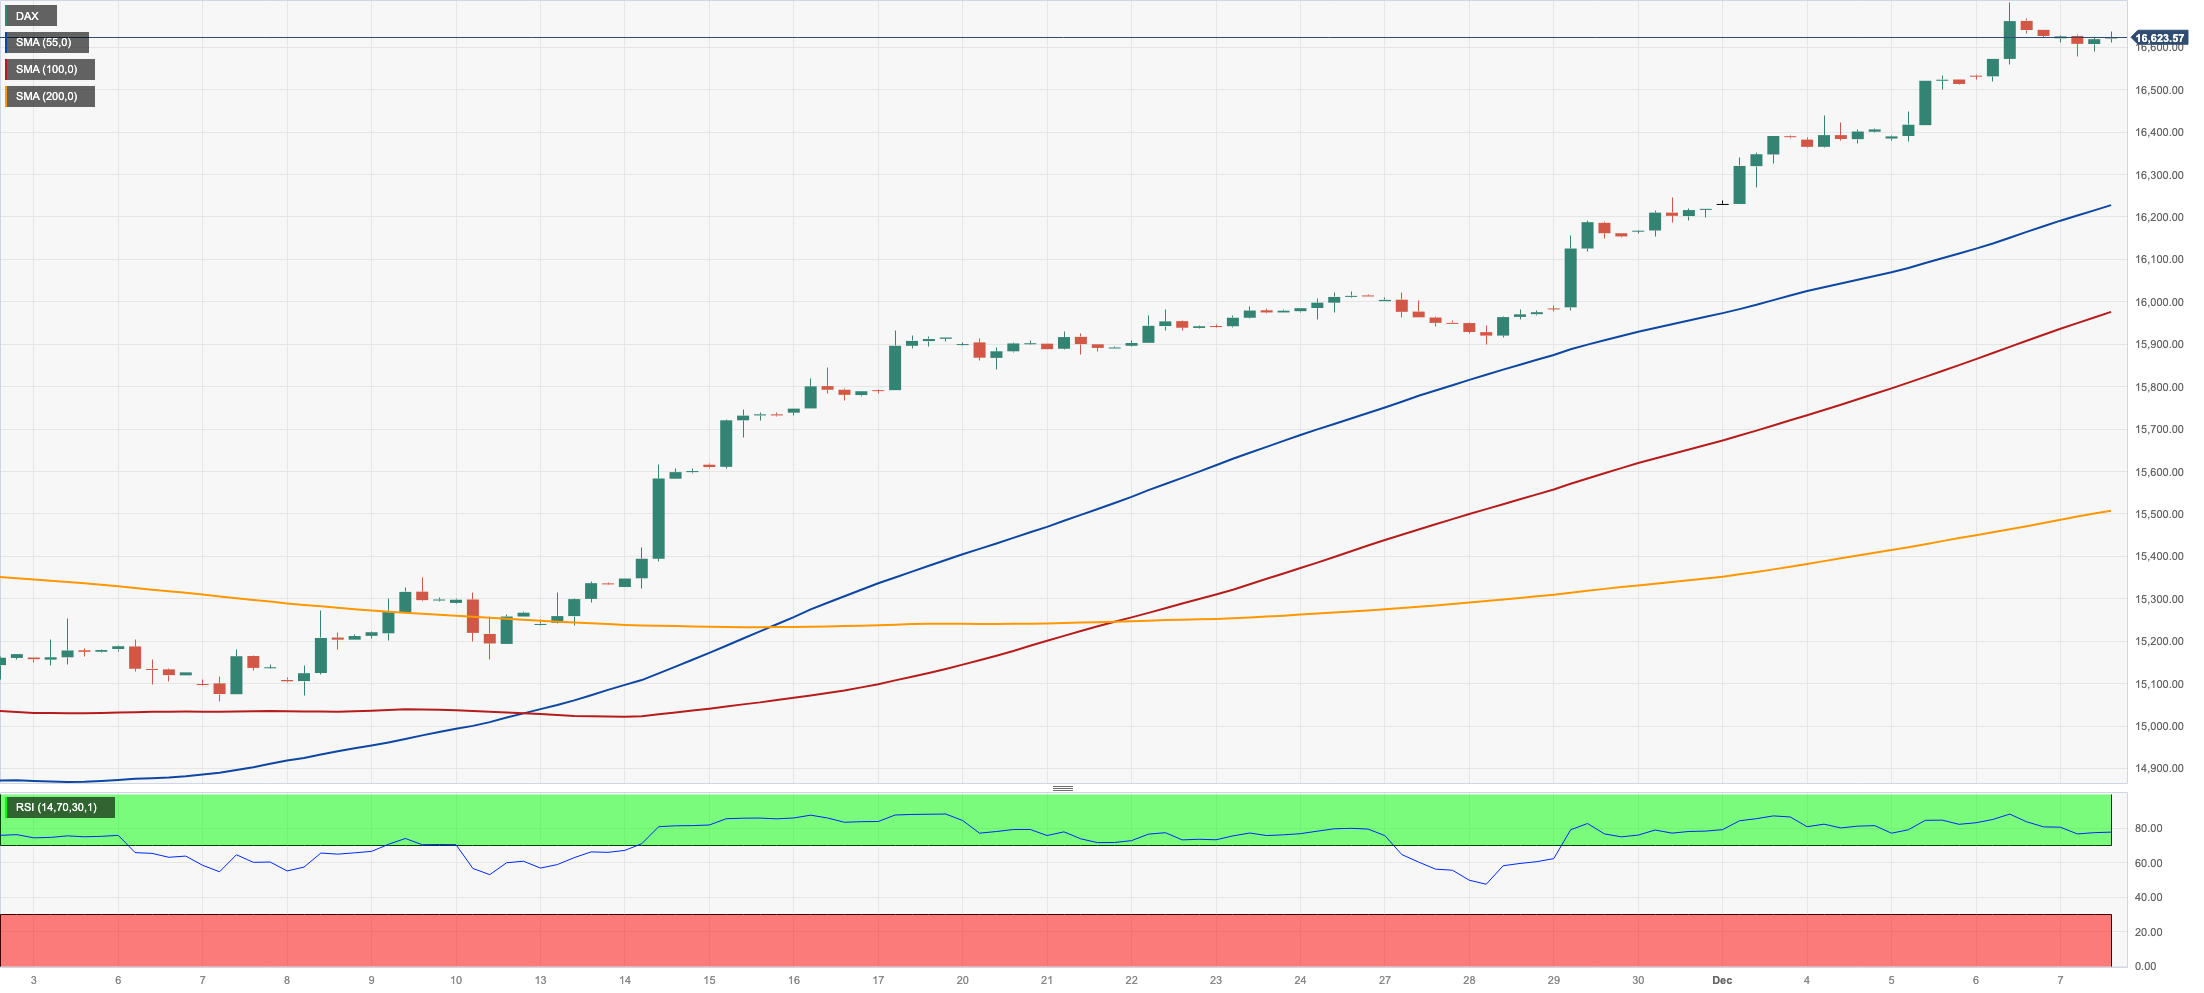
The upside momentum in the German blue-chip index DAX40 seems to have taken a breather on Thursday, retreating modestly after seven consecutive daily advances, including a new all-time top past 16700 recorded on Wednesday.
The correction in Germany’s key market was long-awaited due to its significantly overbought state. However, the outlook continues to favour upward movement, driven by the prevalent anticipation of potential rate cuts by the Fed and the ECB at some point in Q2 2024.
The corrective knee-jerk in the index mirrored another negative session in the 10-year bund yields, which this time retreated to the proximity of 2.15% for the first time since early April.
Further gains might propel the DAX40 to an all-time high of 16727 (December 6). Instead, early support may be found at the weekly low of 15915 (November 28), which is placed ahead of the critical 200-day SMA of 15706 and the intermediate 55-day SMA of 15453. If this zone is breached, the October low of 14630 (October 23) may be retested before the March low of 14458 (March 20). The daily RSI eased to the sub-82 region, still suggesting that the market was still significantly overbought.
Best Performers: Merck, Heidelbergcement, BASF
Worst Performers: Commerzbank, Zalando SE, Adidas
Resistance levels: 16727 (4H chart)
Support levels: 16079 15915 15501 (4H chart)
NASDAQ
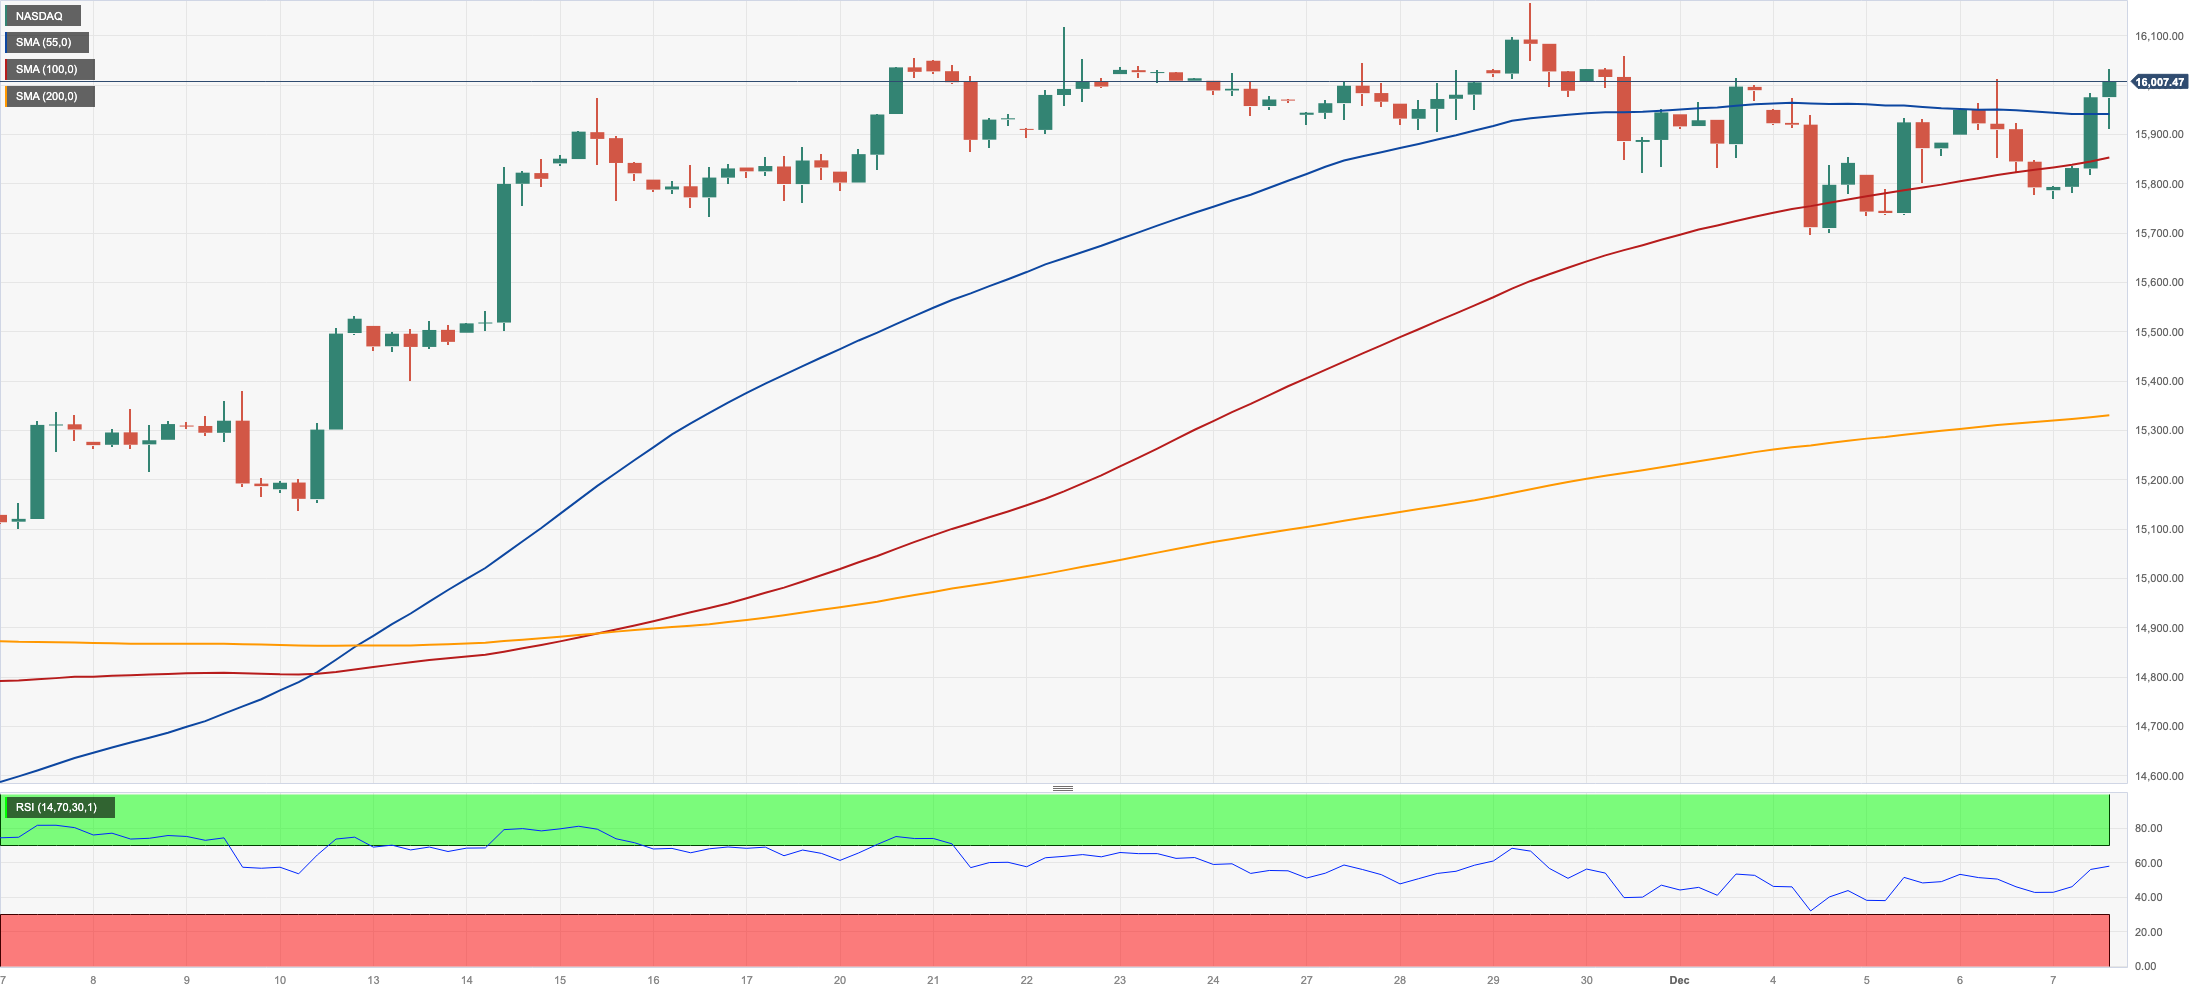
Following the heightened optimism among market participants, the tech reference Nasdaq 100 resumed its uptrend on Thursday, quickly leaving behind the marked pullback seen in the previous session and reclaiming the area above the 16000 threshold.
The sharp retracement in the greenback, an absence of clear direction in US yields, and the outstanding performance of AMD and Google parent's Alphabet all bolstered the robust rebound in the tech sector.
The Nasdaq 100's immediate upside target is the 2023 peak of 16166 (November 29), followed by the December 2021 high of 16607 (December 28) and the all-time top of 16764 (November 22 2021). For all that, there is an initial support at the December low of 15695 (December 4) ahead of the provisional 55-day SMA of 15178. Further down aligns the 200-day SMA of 14409 seconded by the October low of 14058 (October 26). Once the latter is cleared, the index might challenge the April bottom of 12724 (April 25) ahead of the March low of 11695 (March 13) and the 2023 low of 10696 (January 3). The RSI leapt past the 63 level.
Top Gainers: AMD, Walgreen Boots, Alphabet C
Top Losers: Constellation Energy, O’Reilly Automotive, CoStar
Resistance levels: 16166 16607 16764 (4H chart)
Support levels: 15695 15225 14058 (4H chart)
DOW JONES
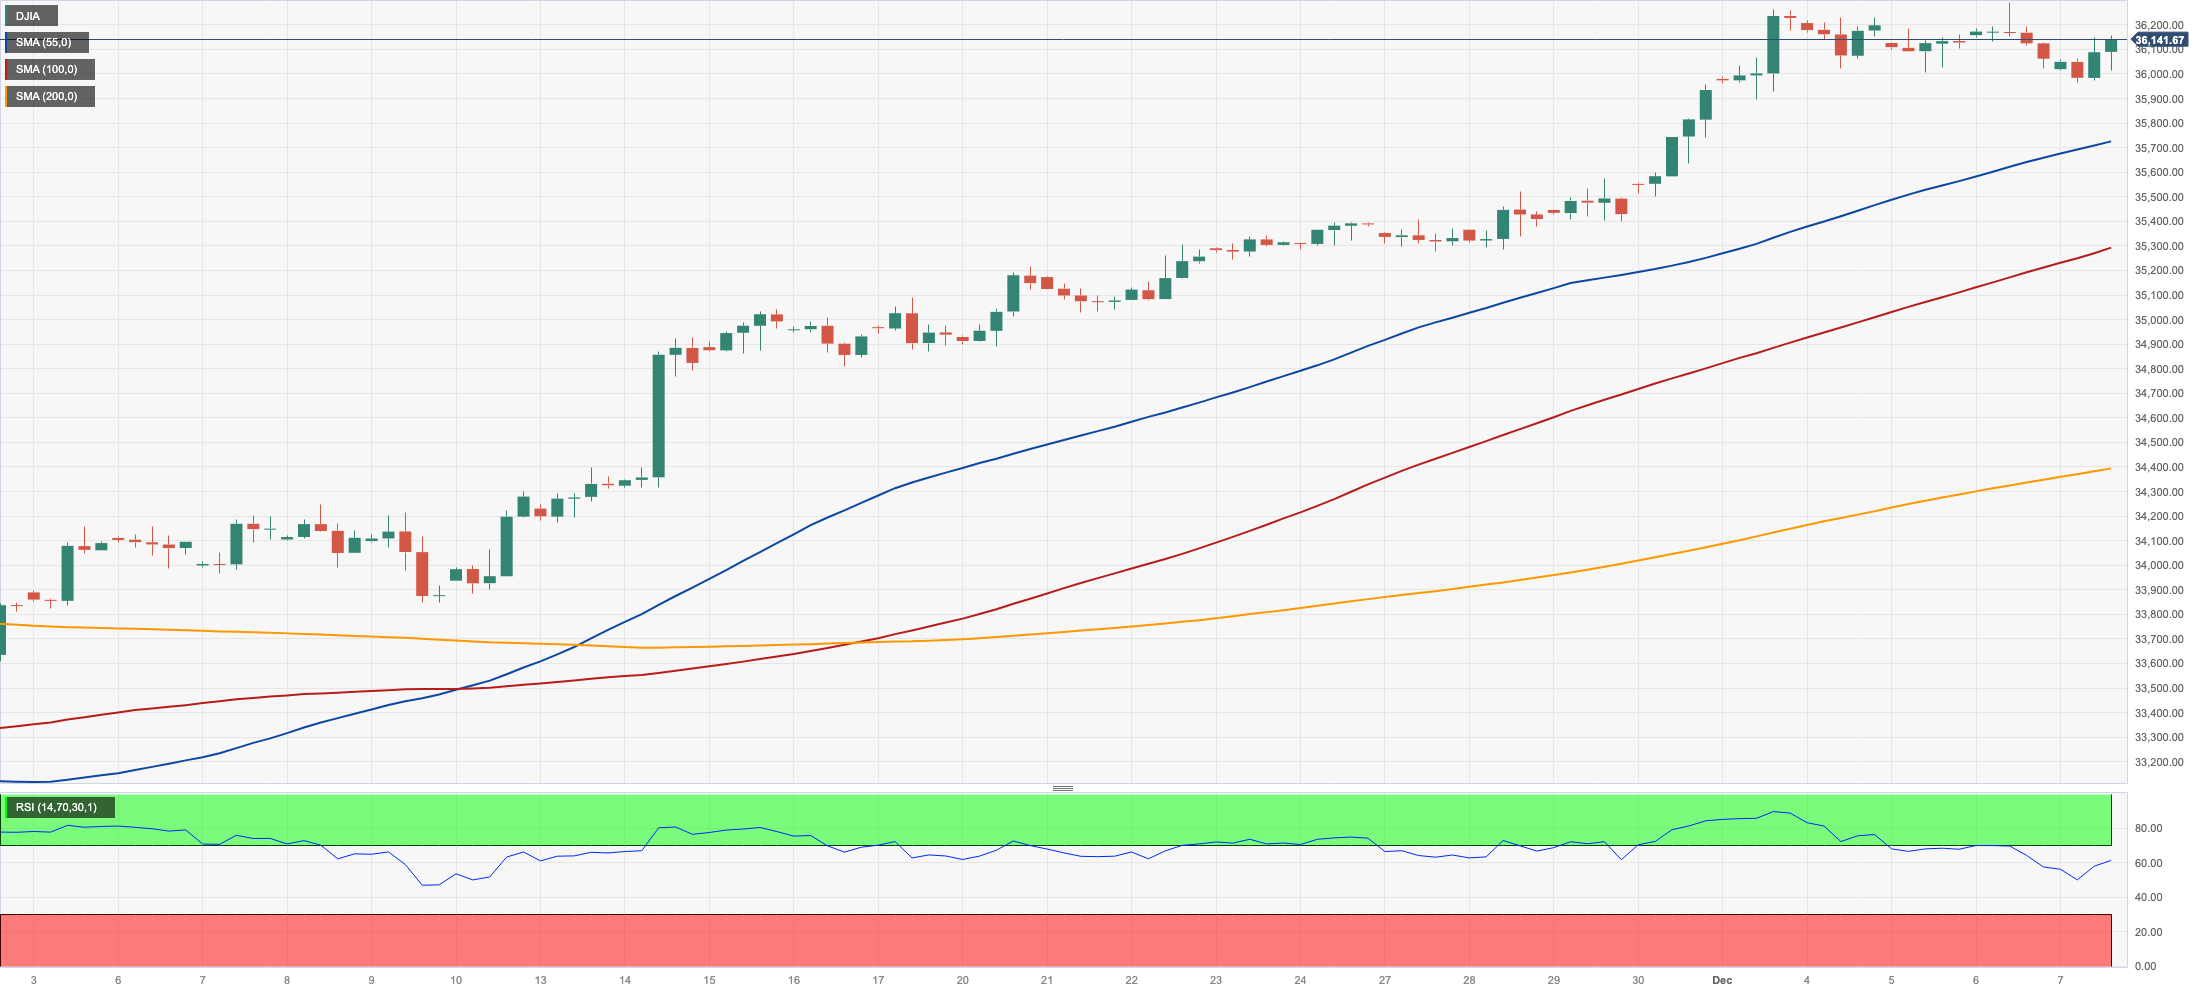
US stocks navigated through ups and downs and left the key Dow Jones with humble gains above the 36100 level on Thursday.
In fact, the price movement surrounding the index displayed a lack of clear direction amid growing caution as market participants awaited the release of the highly significant Nonfarm Payrolls report on Friday (+180K expected).
However, there was a consistent sense of optimism among market participants regarding the possibility of interest rate cuts by the Federal Reserve at some point in the spring of 2024.
All in all, the Dow Jones advanced 0.22% to 36135, the S&P500 rose 0.71% to 4581, and the tech-benchmark Nasdaq Composite gained 1.26% to 14324.
If the Dow Jones exceeds the 2023 high of 36292 (December 6), it may reach the all-time top of 36952 (January 5, 2022) before hitting the round level of 37000. The other way around, the 200-day SMA of 3956 and the weekly low of 33859 should provide support (November 7) ahead of the October low of 32327 (October 27). The loss of the latter could pave the way for a move to the 2023 low of 31429 (March 15) ahead of the 2022 low of 28660 (October 13). The daily RSI bounced a tad past 75, still over the overbought threshold (70).
Top Performers: Walgreen Boots, Intel, Walt Disney
Worst Performers: Merck&Co, Nike, UnitedHealth
Resistance levels: 36292 36513 36952 (4H chart)
Support levels: 34492 33859 32327 (4H chart)
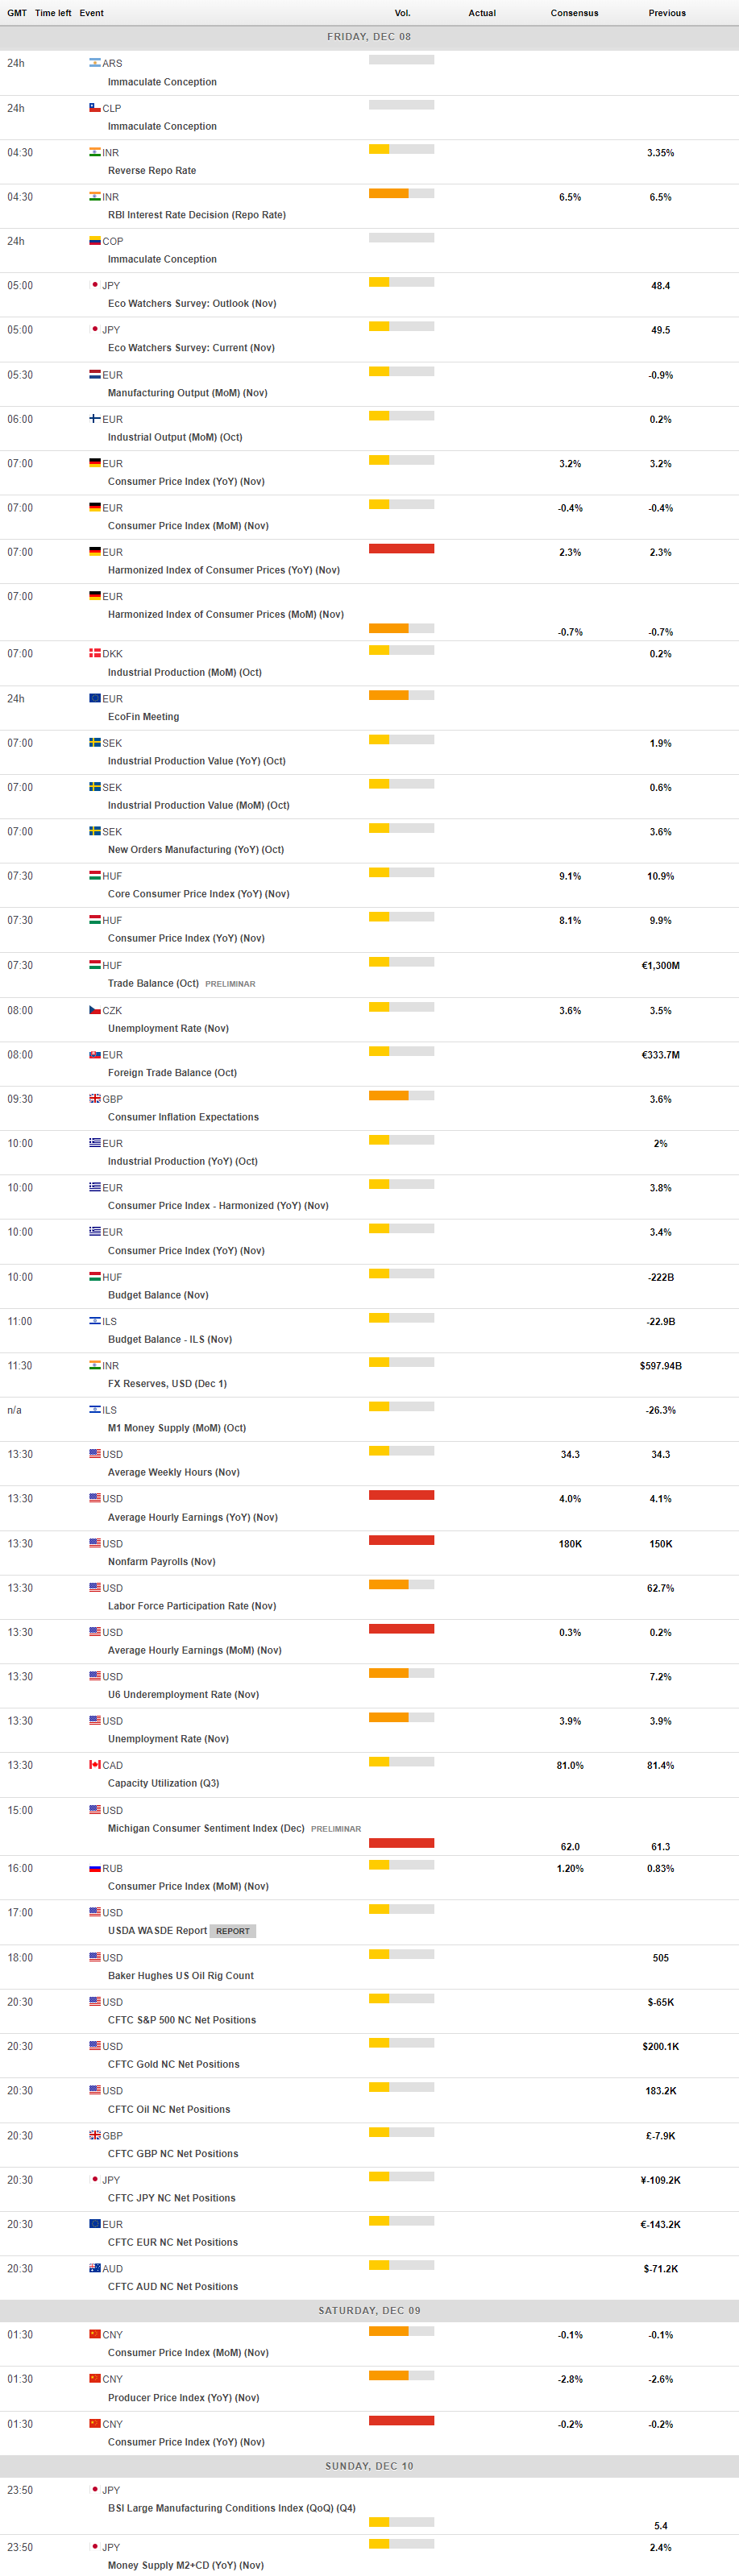
MACROECONOMIC EVENTS
All Information & Updates provided by:

All information relating to the financial markets available on this page has been prepared and issued by FXStreet (Forexstreet SL, Spain, Reg: B62498233) on the basis of publicly available information and all information believed to be reliable and does not conflict with Kuwaiti local laws, and all necessary care has been taken to before the company to ensure that the facts mentioned are correct from the source.
NCM Investment nor any of its directors or employees shall in any way be held responsible for the contents of this news, and the information contained on this page is intended only to provide clients with publicly available information and should not be construed as investment advice, report or analysis and/or constitute an offer or invitation to buy or sell financial instruments of any kind.
RISK WARNING: Forex and CFDs are highly risky leveraged products, as losses can exceed deposits. Please ensure you understand all the risks and take independent advice if necessary. NCM will segregate the clients based on the criteria of the regulator and its bylaws. NCM does not provide any advisory service; the material published does not constitute advice or a recommendation for a transaction in any financial instrument. NCM accepts no responsibility for any use of the content presented and any consequences of that use. Anyone acting on the information provided does so at their own risk.