
- Contact Us:
-

-

-

-


Daily Market Updates
11 Dec 2023
EURUSD
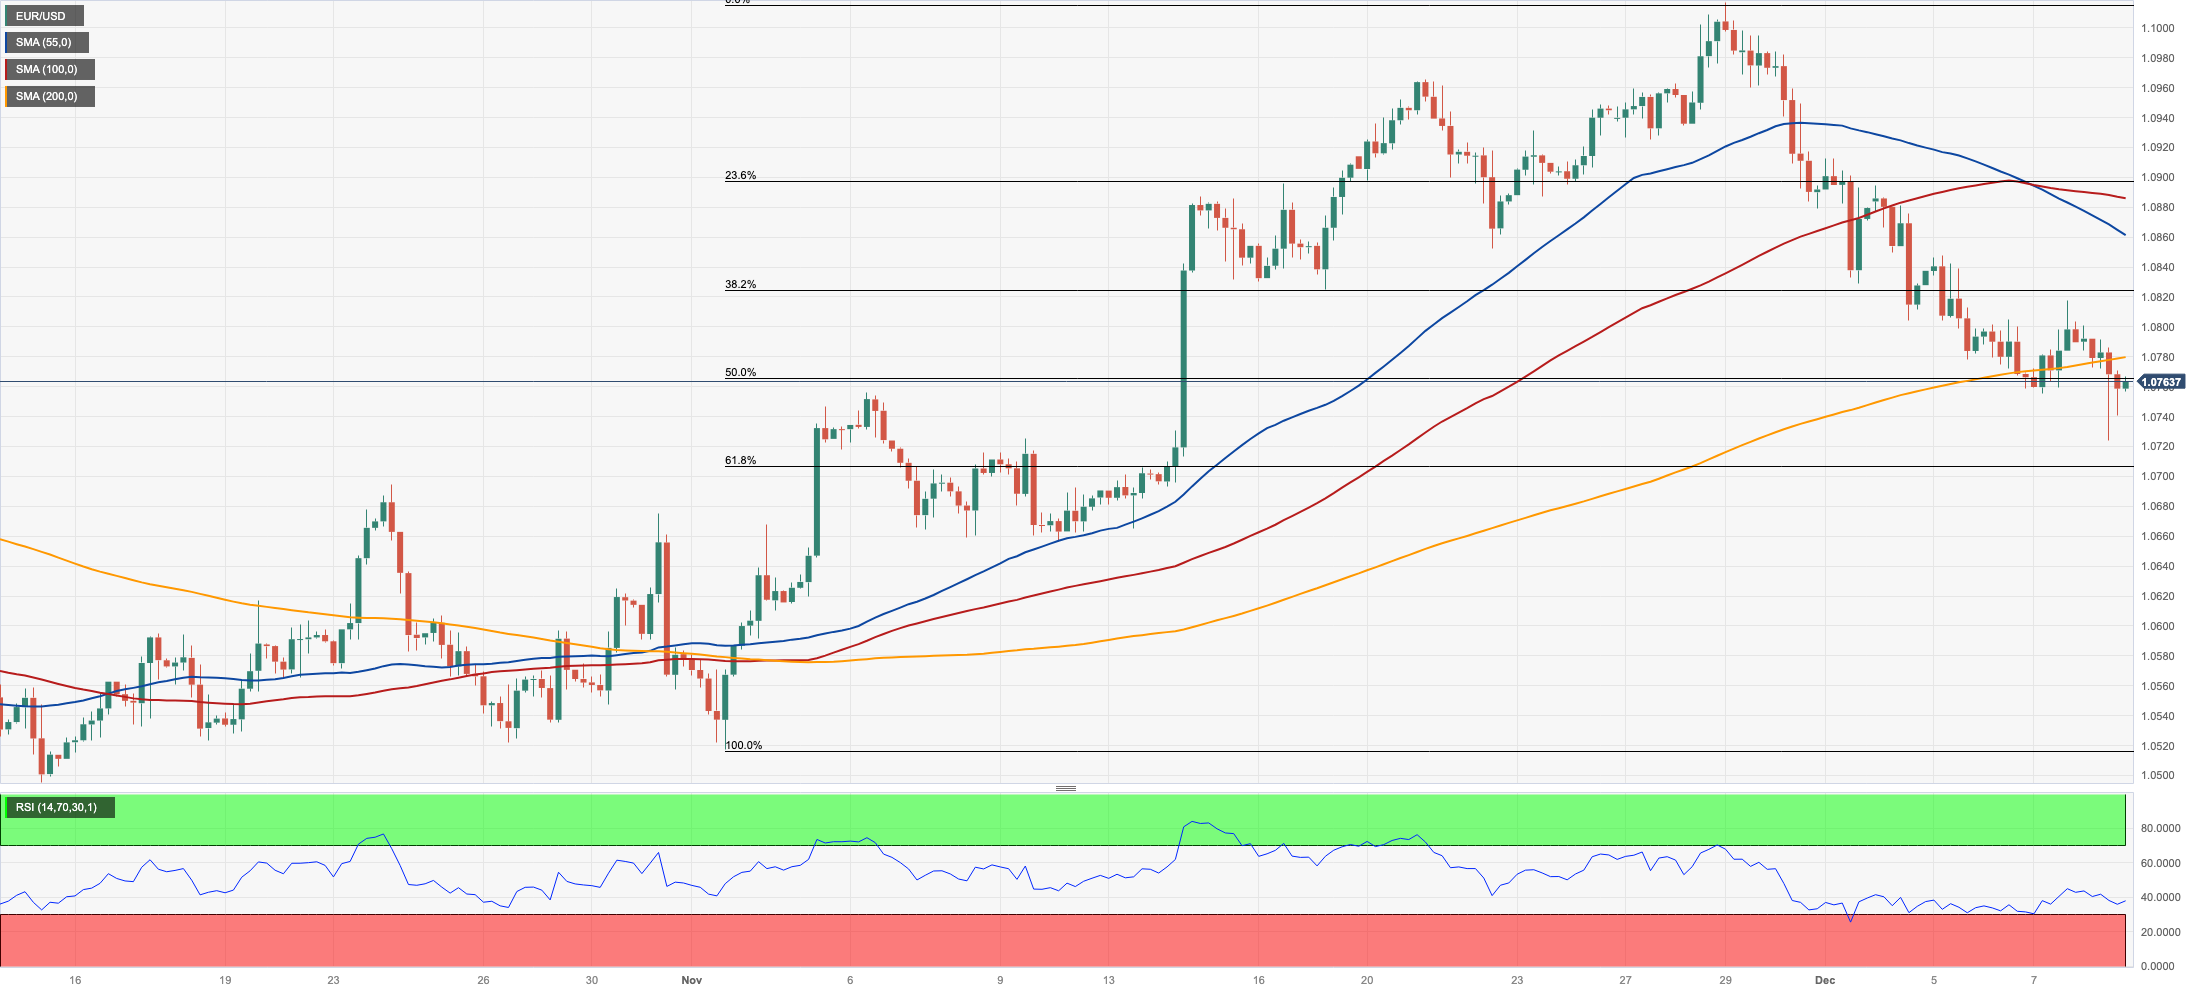
Following a sharp NFP-driven pullback to new three-week lows in the 1.0725/20 band, EUR/USD managed to regain some balance and rebounded to the 1.0760 region at the end of the week.
In light of this price action, spot closed its second consecutive week of losses and maintained the negative monthly performance intact so far.
On the USD side of the equation, the greenback resumed its weekly recovery and briefly revisited the area of three-week tops near 104.30 when gauged by the USD Index (DXY). The marked advance in the dollar came in tandem with an equally strong bounce in US yields across different timeframes.
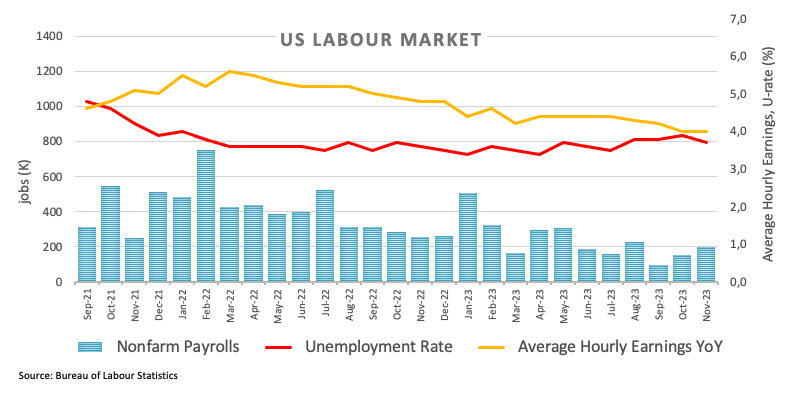
The improved sentiment around the greenback was reinvigorated after US Nonfarm Payrolls showed the economy added 199K jobs in November (vs. 180K expected) and the jobless rate ticked lower to 3.7%. In addition, Average Hourly Earnings rose by 0.4% MoM and 4.0% over the last twelve months, while Participation Rate rose marginally to 62.8%. Closing the docket, the advanced Michigan Consumer Sentiment rose to 69.4 for the current month.
In the euro area, final inflation figures in Germany saw the CPI contract by 0.4% MoM in November and rise by 3.2% from a year earlier.
If EUR/USD falls below the December low of 1.0723 (December 8), it may challenge the intermediate 55-day SMA at 1.0690. The loss of the latter might reintroduce a challenge of the weekly low of 1.0495 (October 13) before the 2023 low of 1.0448 (October 3) and the round level of 1.0400. On the upside, further gains may send the pair back to the 200-day SMA at 1.0822 before the November top of 1.1017 (November 29). Once cleared, the pair might return the August peak of 1.1064 (August 10) and the weekly high of 1.1149 (July 27), all of which precede the 2023 top of 1.1275 (July 18). The daily RSI dropped below the 45 zone.
Resistance levels: 1.0817 1.0886 1.1017 (4H chart)
Support levels: 1.0723 1.0656 1.0516 (4H chart)
USDJPY
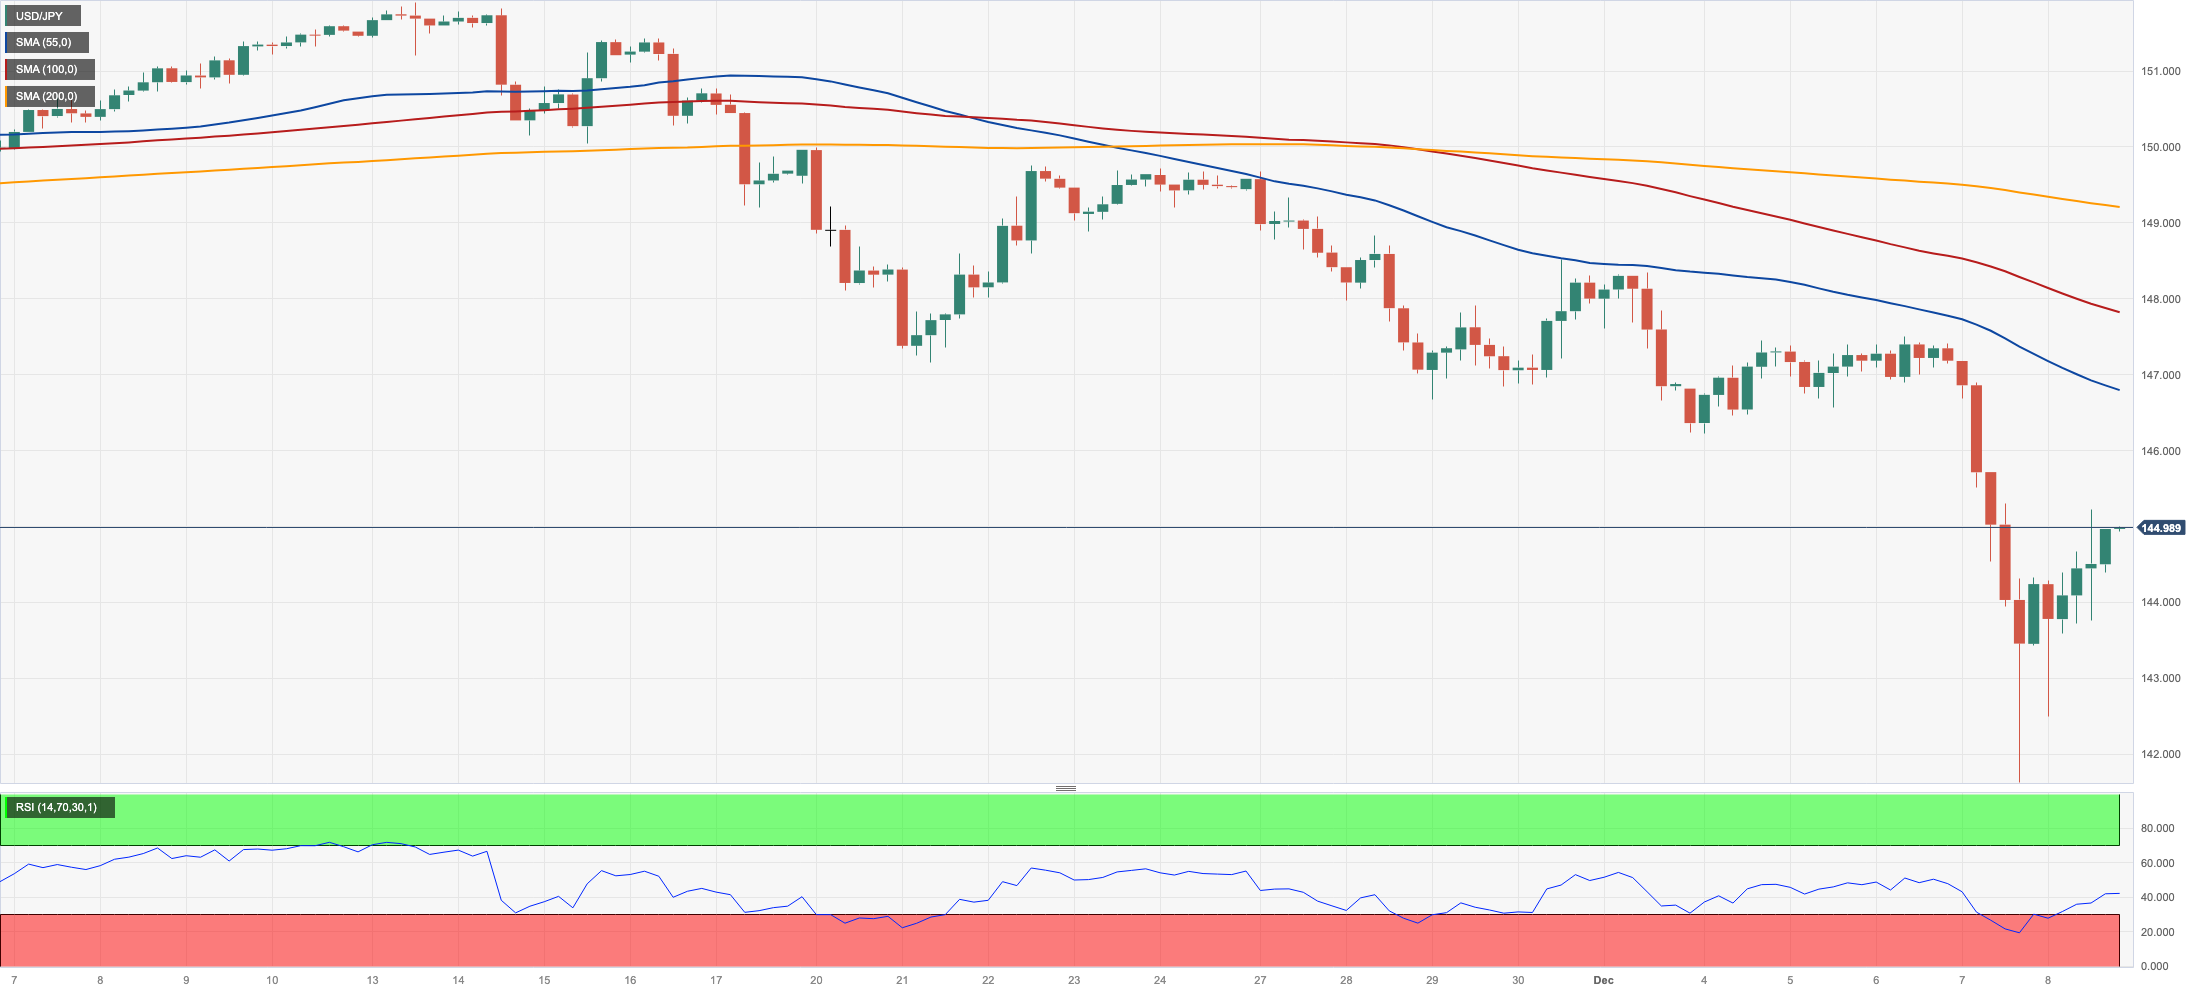
The Japanese yen surrendered part of Thursday’s pronounced gains and allowed USD/JPY to close Friday’s session with marked gains around the key 145.00 zone. Looking at the weekly chart, the pair clinched its fourth drop in a row following mid-November’s 2023 high near the 152.00 barrier.
The daily uptick in spot, in the meantime, came in tandem with the strong recovery of the dollar and rising US yields across different maturities, while the JGB 10-year yields extended the bounce to the boundaries of 0.80%.
On another front, policymakers have emphasized that the upcoming round of wage negotiations in the spring will hold significant importance in terms of policy normalization.
In the domestic calendar, Household Spending contracted by 2.5% in the year to October, Bank Lending expanded by 2.8% YoY in November, and the Current Account surplus narrowed to ¥2582.8B also in October. In addition, final GDP figures saw the economy contract by 2.9% in the July–September period.
If the December low of 141.60 (December 7) is breached, USD/JPY may fall to the August low of 141.50 (August 7), which precedes the July low of 137.23 (July 14). In contrast. the temporary 55-day SMA at 149.26 is immediately to the upside, before the 2023 peak of 151.90 (November 13) and the 2022 high of 151.94 (October 21), all prior to the round number of 152.00. The RSI leapt past the 34 yardstick.
Resistance levels: 147.49 148.52 149.22 (4H chart)
Support levels: 141.60 141.50 138.05 (4H chart)
GBPUSD
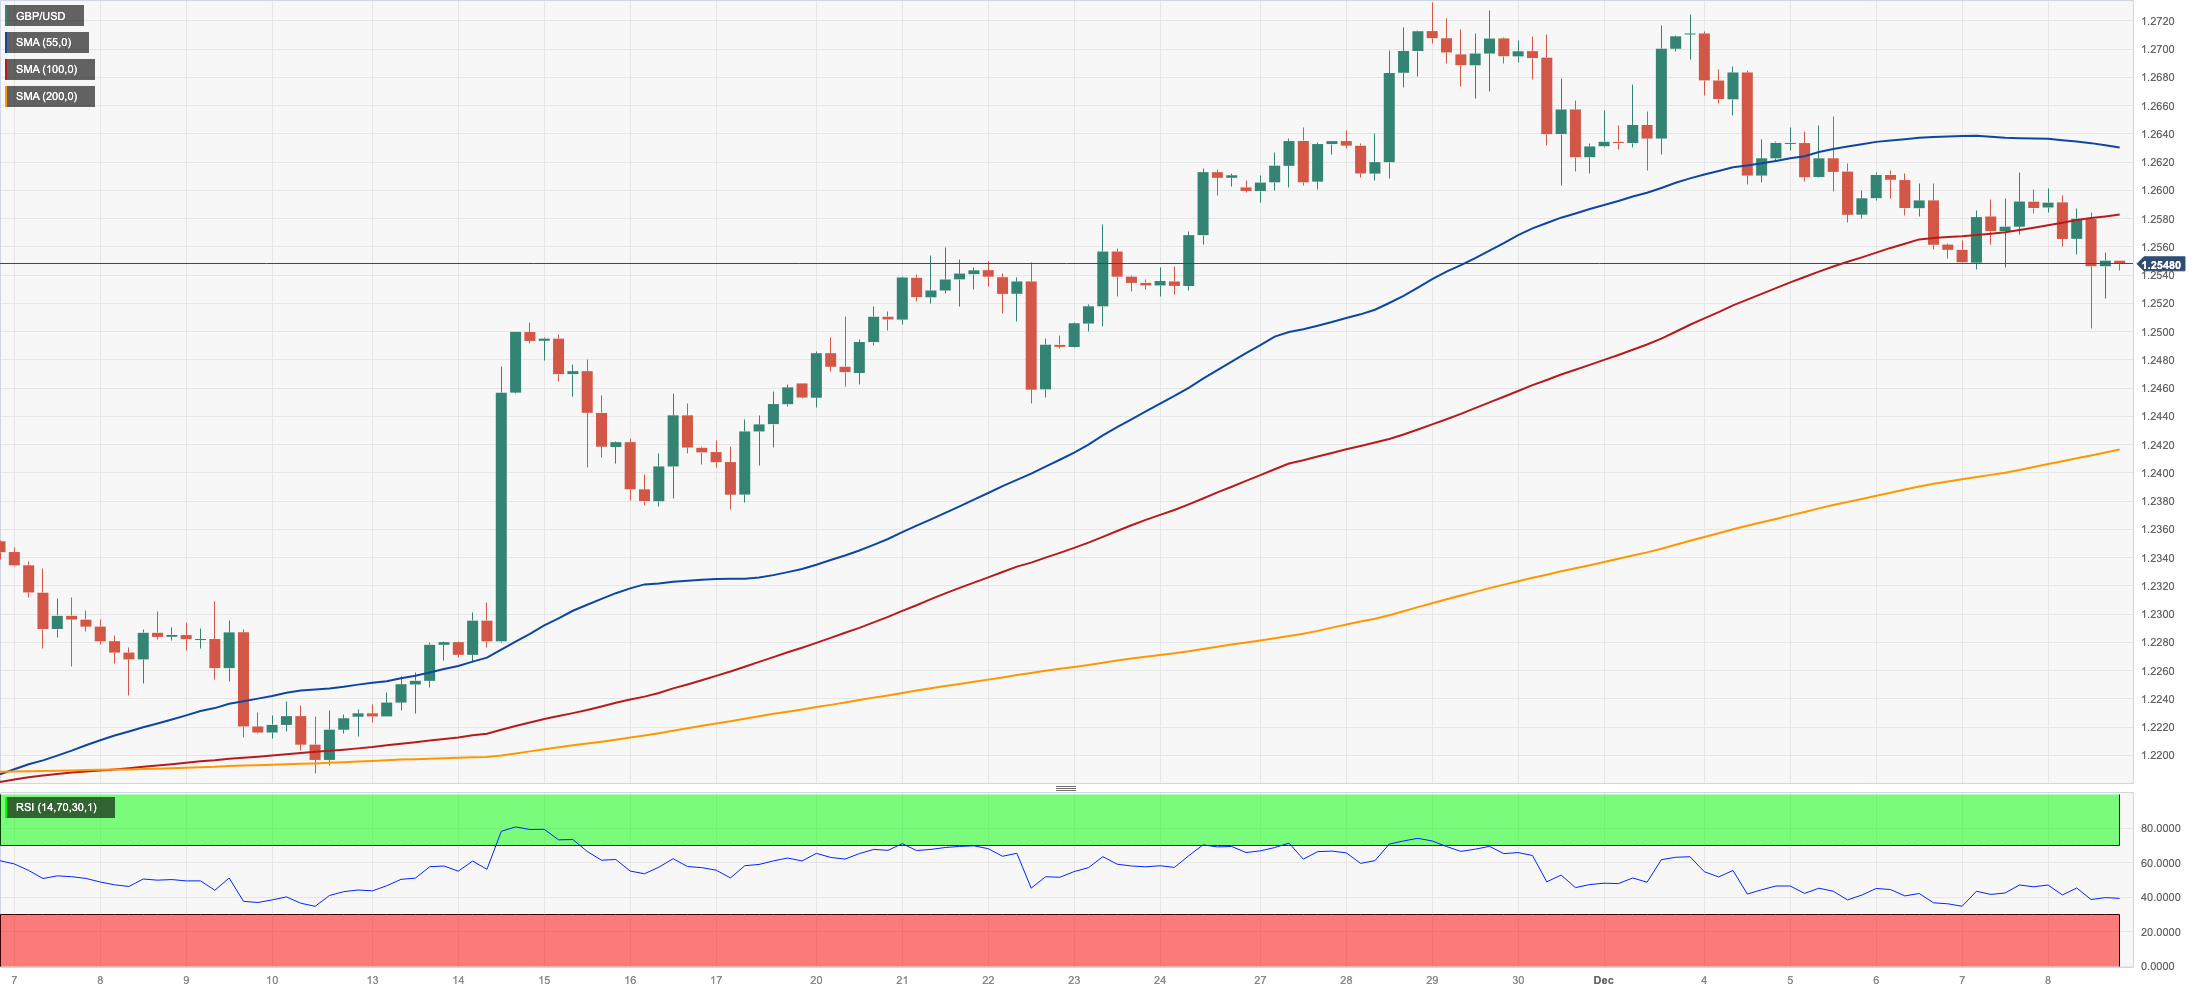
The substantial rebound in the greenback put the risk-linked space under renewed downside pressure at the end of the week, sparking the resumption of the selling bias in GBP/USD, which briefly reached a new two-week low in the 1.2500 neighbourhood.
Indeed, Cable succumbed to the dollar’s steep bounce and flirted with the 1.2500 contention zone in the wake of the release of the US jobs report for the month of November, which seems to have somewhat underpinned hopes of interest rate cuts by the Fed early in 2024.
In the UK money market, the 10-year gilt yields added to Thursday’s small advance and rose further north of the key 4.0%.
There were no data releases across the Channel on Friday.
Immediately to the downside for GBP/USD now emerges the pivotal 200-day SMA at 1.2484, prior to the interim 55-day SMA at 1.2323 and the weekly low of 1.2187 (November 10). Down from here aligns the October low of 1.2037 (October 3), ahead of the key 1.2000 level and the 2023 low of 1.1802 (March 8). On the contrary, the next upward hurdle is the November high of 1.2733 (November 29). If this level is breached, it might lead to weekly tops of 1.2746 (August 30), 1.2818 (August 10), and 1.2995 (July 27), all of which occur before the important 1.3000 yardstick. The daily RSI grinded lower below 54.
Resistance levels: 1.2630 1.2715 1.2733 (4H chart)
Support levels: 1.2502 1.2448 1.2373 (4H chart)
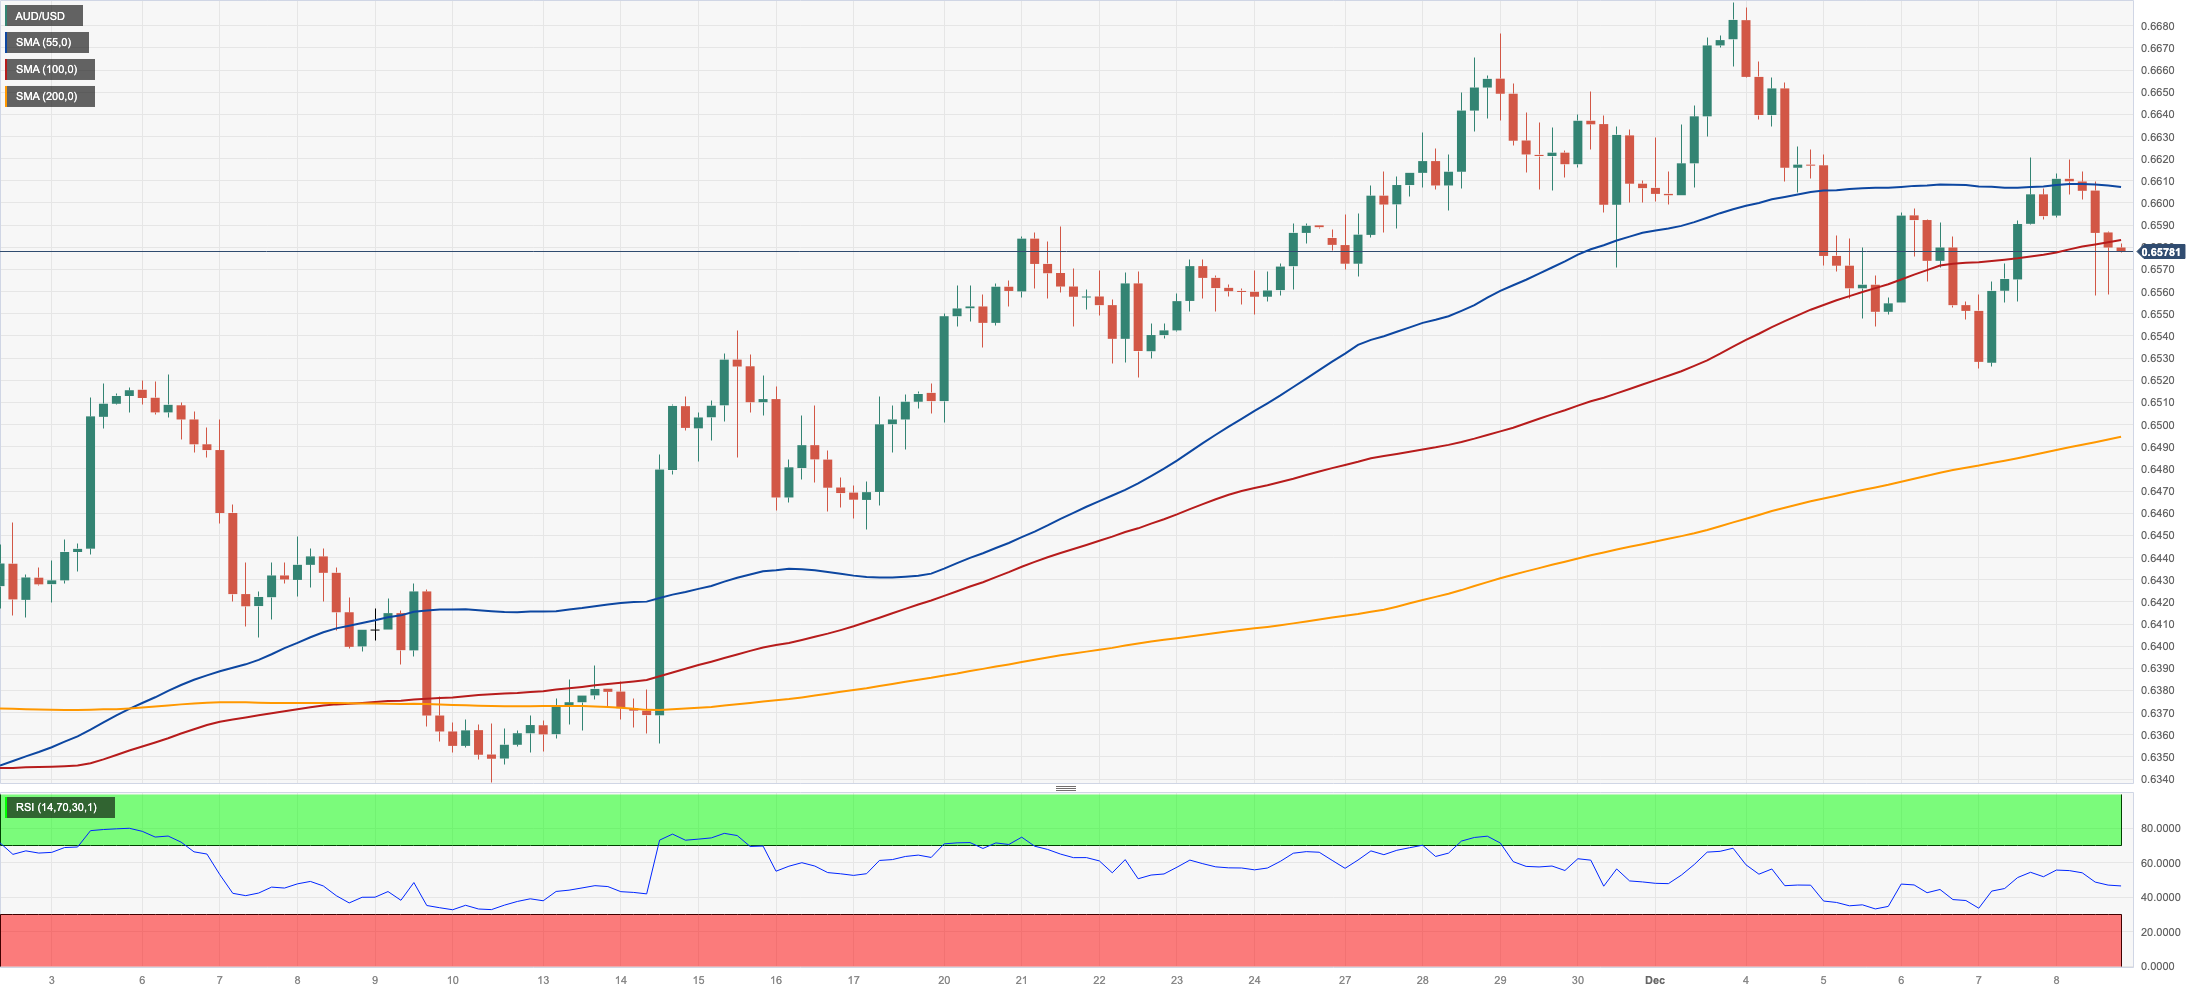
AUDUSD
The strong resurgence of the greenback put the Aussie dollar under extra pressure and forced AUD/USD to give away Thursday’s advance and refocus on the downside at the end of the week.
Indeed, the pair traded on the defensive and remained in negative territory so far this month, while the positive performance from both copper prices and iron ore could not prevent spot from losing ground on Friday.
On the Australian docket, RBA’s Head of Financial Stability, A. Brischetto, mentioned that amidst the recent increase in the number of borrowers experiencing "severe financial stress," the majority of Australians had demonstrated resilience. She indicated that, according to the RBA's estimation, with the current interest rates, fewer than two percent of variable-rate owner-occupier borrowers were presently facing a "real risk" of being unable to meet their essential expenses and mortgage payments solely from their existing income, lacking substantial savings reserves to rely on.
If the AUD/USD goes below the December low of 0.6525 (December 7), it may retest the intermediate 100-day and 55-day SMAs of 0.6464 and 0.6441, respectively. If the latter is dropped, a move to the 2023 bottom of 0.6270 (October 26) before the round level of 0.6200 and the 2022 low of 0.6169 (October 13) may be on the horizon. On the flip side, the December high of 0.6690 is the next hurdle (December 4). A break above this level might pave the way for a challenge to the July top of 0.6894 (July 14), which is just ahead of the June peak of 0.6899 (June 16) and the important 0.7000 threshold. The daily RSI eased to the sub-55 area.
Resistance levels: 0.6620 0.6690 0.6739 (4H chart)
Support levels: 0.6525 0.6479 0.6452 (4H chart)
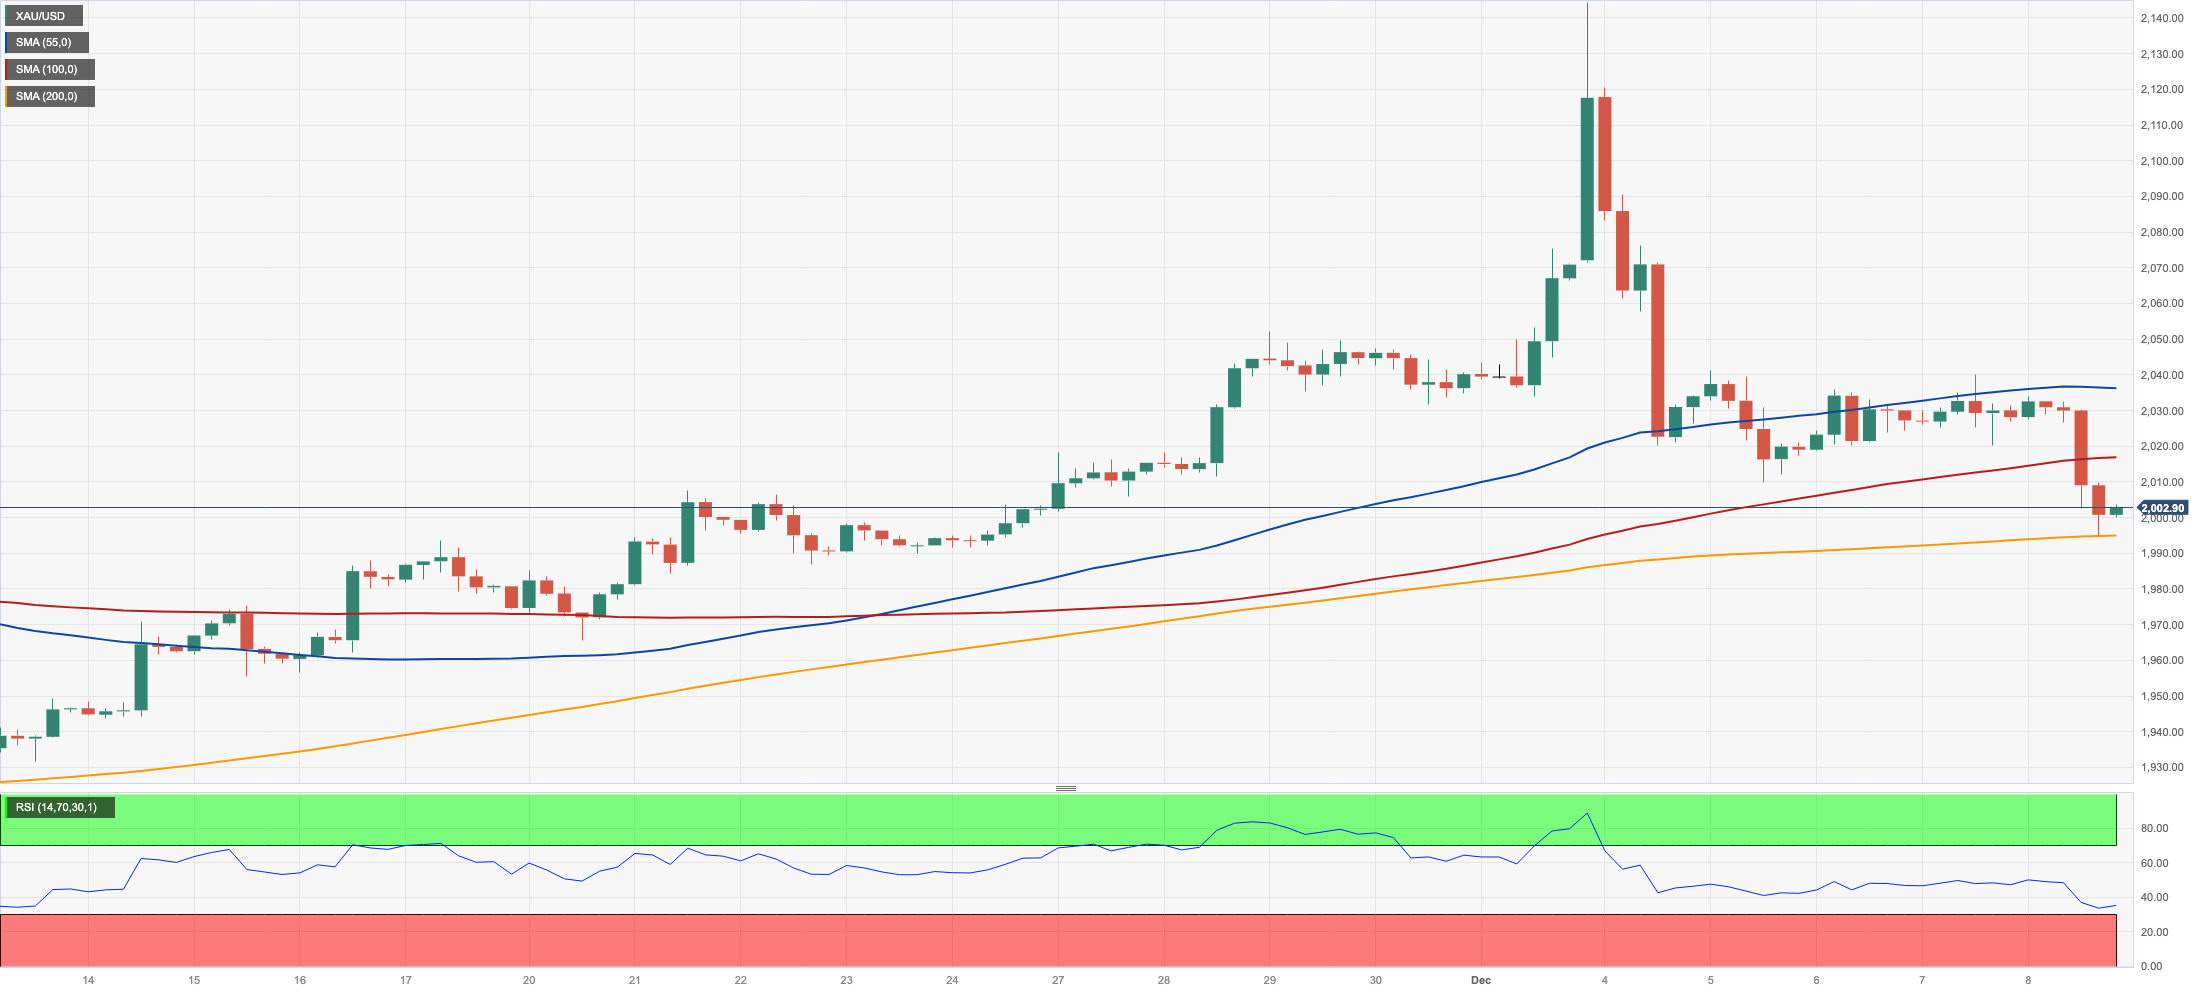
GOLD
It was quite a volatile week for the precious metal.
Indeed, gold prices retreated markedly and briefly revisited the sub-$2000 region on Friday on the back of the sharp move higher in the greenback, while further gains in US yields across the curve also kept the price action around the yellow metal depressed.
Extra weakness also followed shrinking expectations of interest rate reductions by the Federal Reserve early next year in response to auspicious results from the US labour market, which gave further signs of resilience.
If the bulls regain the upper hand, the next target for gold emerges at the all-time high of $2149 (December 4). Instead, bearish attempts may drive the yellow metal below the 200-day SMA of $1950 before the November low of $1931 (November 13). If this level is broken, the October low of $1810 (October 6) might come into play, followed by the 2023 bottom of $1804 (February 28) and the important $1800 contention zone.
Resistance levels: $2015 $2041 $2149 (4H chart)
Support levels: $1994 $1965 $1931 (4H chart)
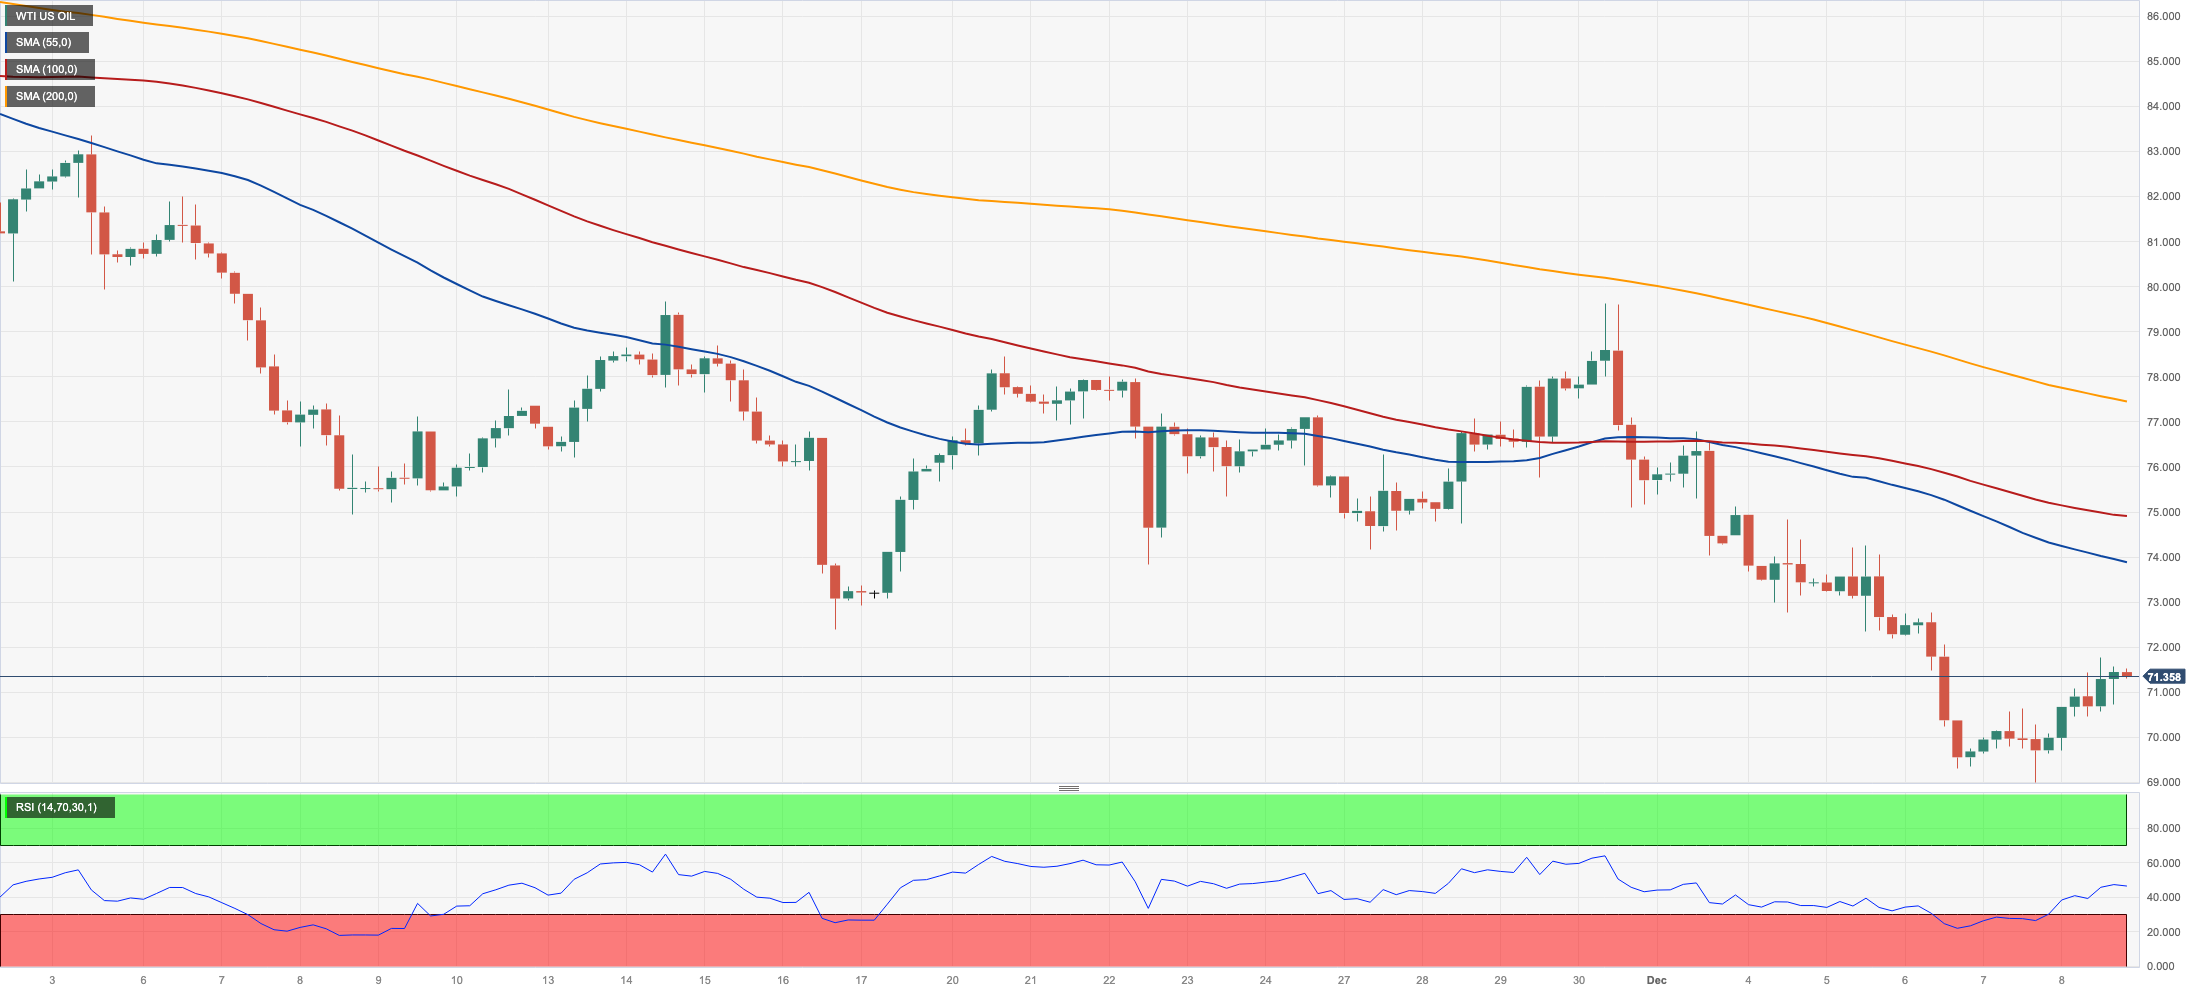
CRUDE WTI
Prices of the American benchmark for sweet light crude oil extended the optimism seen in the latter part of the week and rose past the $71.00 mark per barrel on Friday.
Despite the rebound seen in the last couple of sessions, WTI prices clinched their seventh consecutive weekly drop, retreating to the sub-$69.00 area for the first time since late June.
The weekly decline in crude oil prices came in tandem with unabated demand concerns, mainly stemming from China, although the solid prints from November’s US Nonfarm Payrolls seem to have lent extra legs to the recovery at the end of the week.
In the docket, the US total active oil rigs went down by 2 to 503 in the week to December 8, according to driller Baker Hughes.
If WTI breaks through the December low of $68.63 (December 7), it might challenge the 2023 low of $63.61 (May 4) before the key $60.00 yardstick. A break over the 200-day SMA at $77.93 might reintroduce a challenge to the crucial $80.00 level, which would be swiftly followed by the November high of $80.15 (November 3). Further increases from here might take the market back to the weekly top of $89.83 (October 18), followed by the 2023 peak of $94.99 (September 28). The August 2022 top of $97.65 (August 30) follows next, ahead of the psychological $100.00 mark per barrel.
Resistance levels: $71.68 $74.68 $77.58 (4H chart)
Support levels: $68.77 $67.01 $63.61 (4H chart)
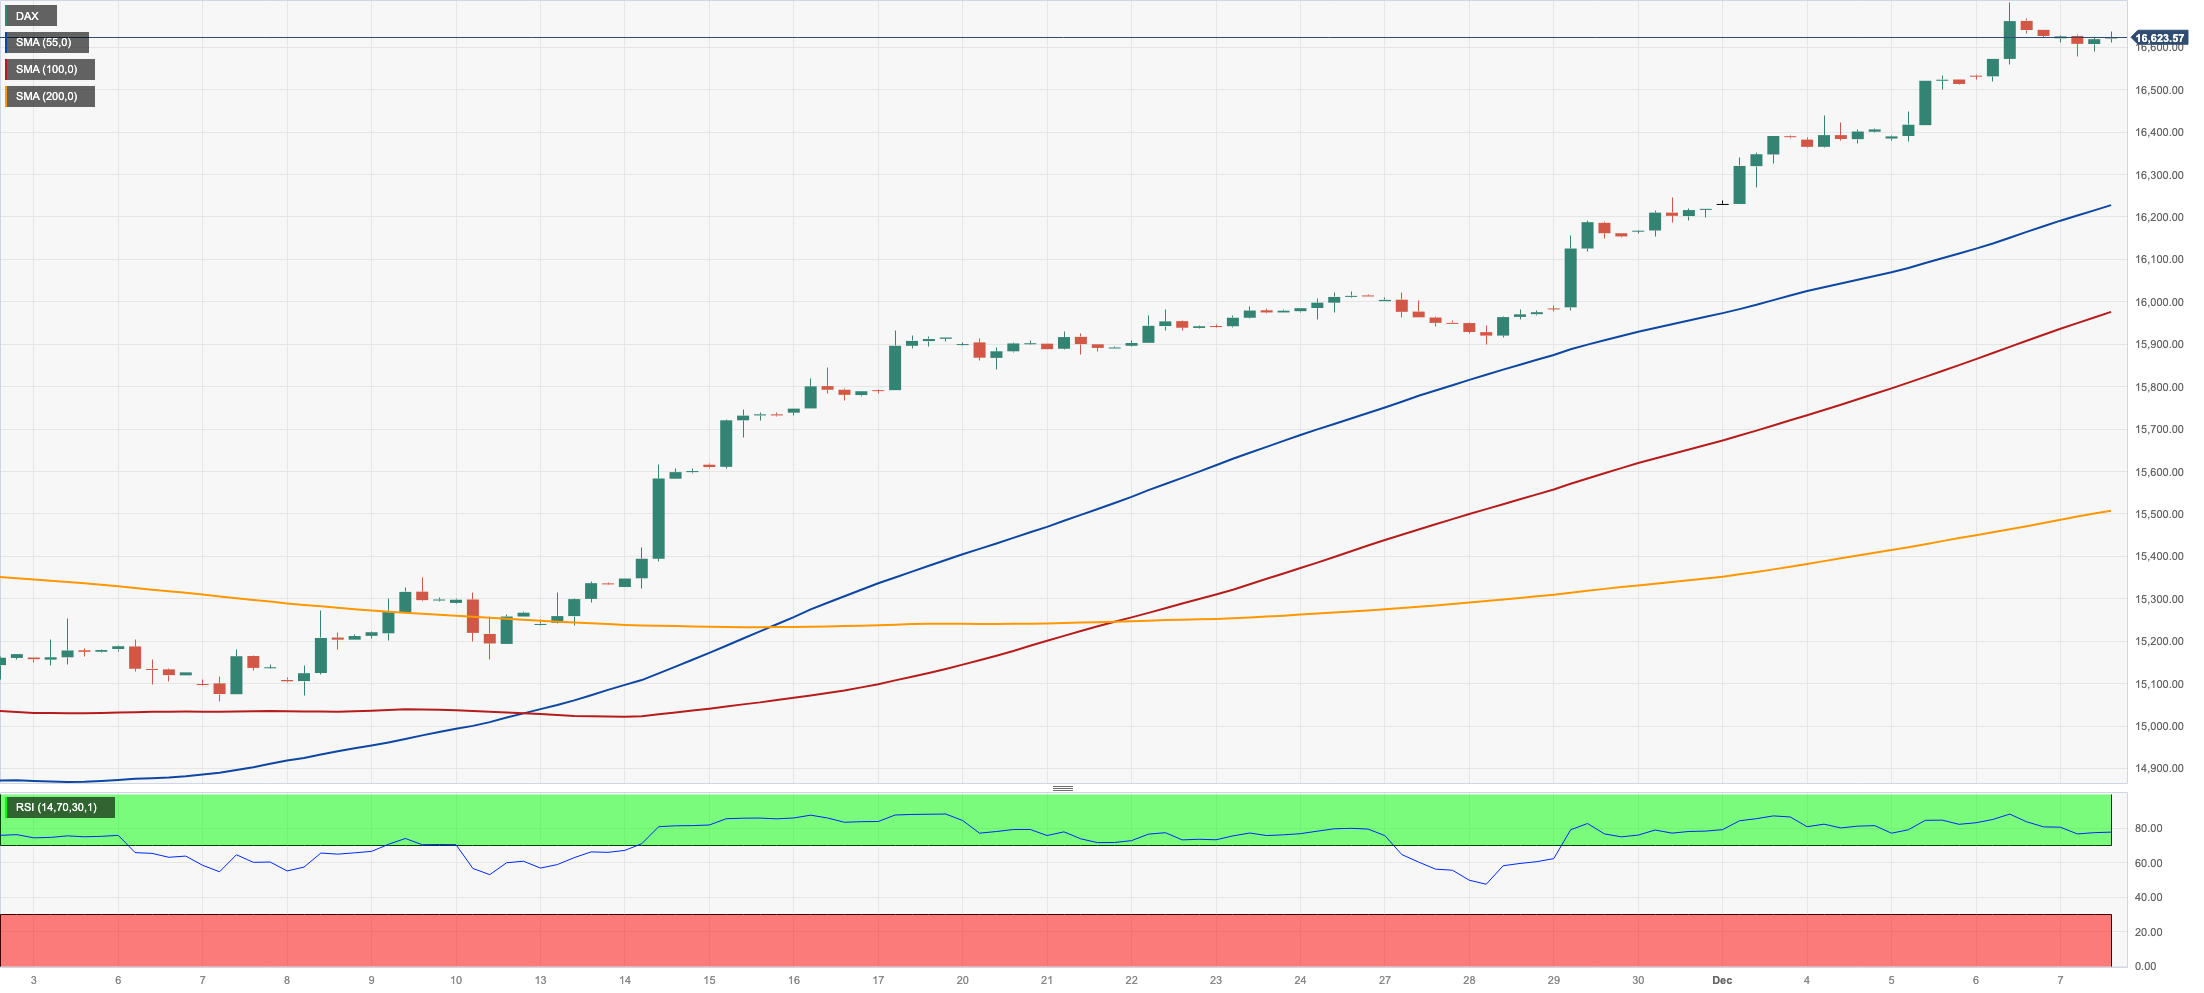
GER40
The upside momentum in the German blue-chip index DAX40 seems to have taken a breather on Thursday, retreating modestly after seven consecutive daily advances, including a new all-time top past 16700 recorded on Wednesday.
The correction in Germany’s key market was long-awaited due to its significantly overbought state. However, the outlook continues to favour upward movement, driven by the prevalent anticipation of potential rate cuts by the Fed and the ECB at some point in Q2 2024.
The corrective knee-jerk in the index mirrored another negative session in the 10-year bund yields, which this time retreated to the proximity of 2.15% for the first time since early April.
Further gains might propel the DAX40 to an all-time high of 16727 (December 6). Instead, early support may be found at the weekly low of 15915 (November 28), which is placed ahead of the critical 200-day SMA of 15706 and the intermediate 55-day SMA of 15453. If this zone is breached, the October low of 14630 (October 23) may be retested before the March low of 14458 (March 20). The daily RSI eased to the sub-82 region, still suggesting that the market was still significantly overbought.
Best Performers: Merck, Heidelbergcement, BASF
Worst Performers: Commerzbank, Zalando SE, Adidas
Resistance levels: 16727 (4H chart)
Support levels: 16079 15915 15501 (4H chart)
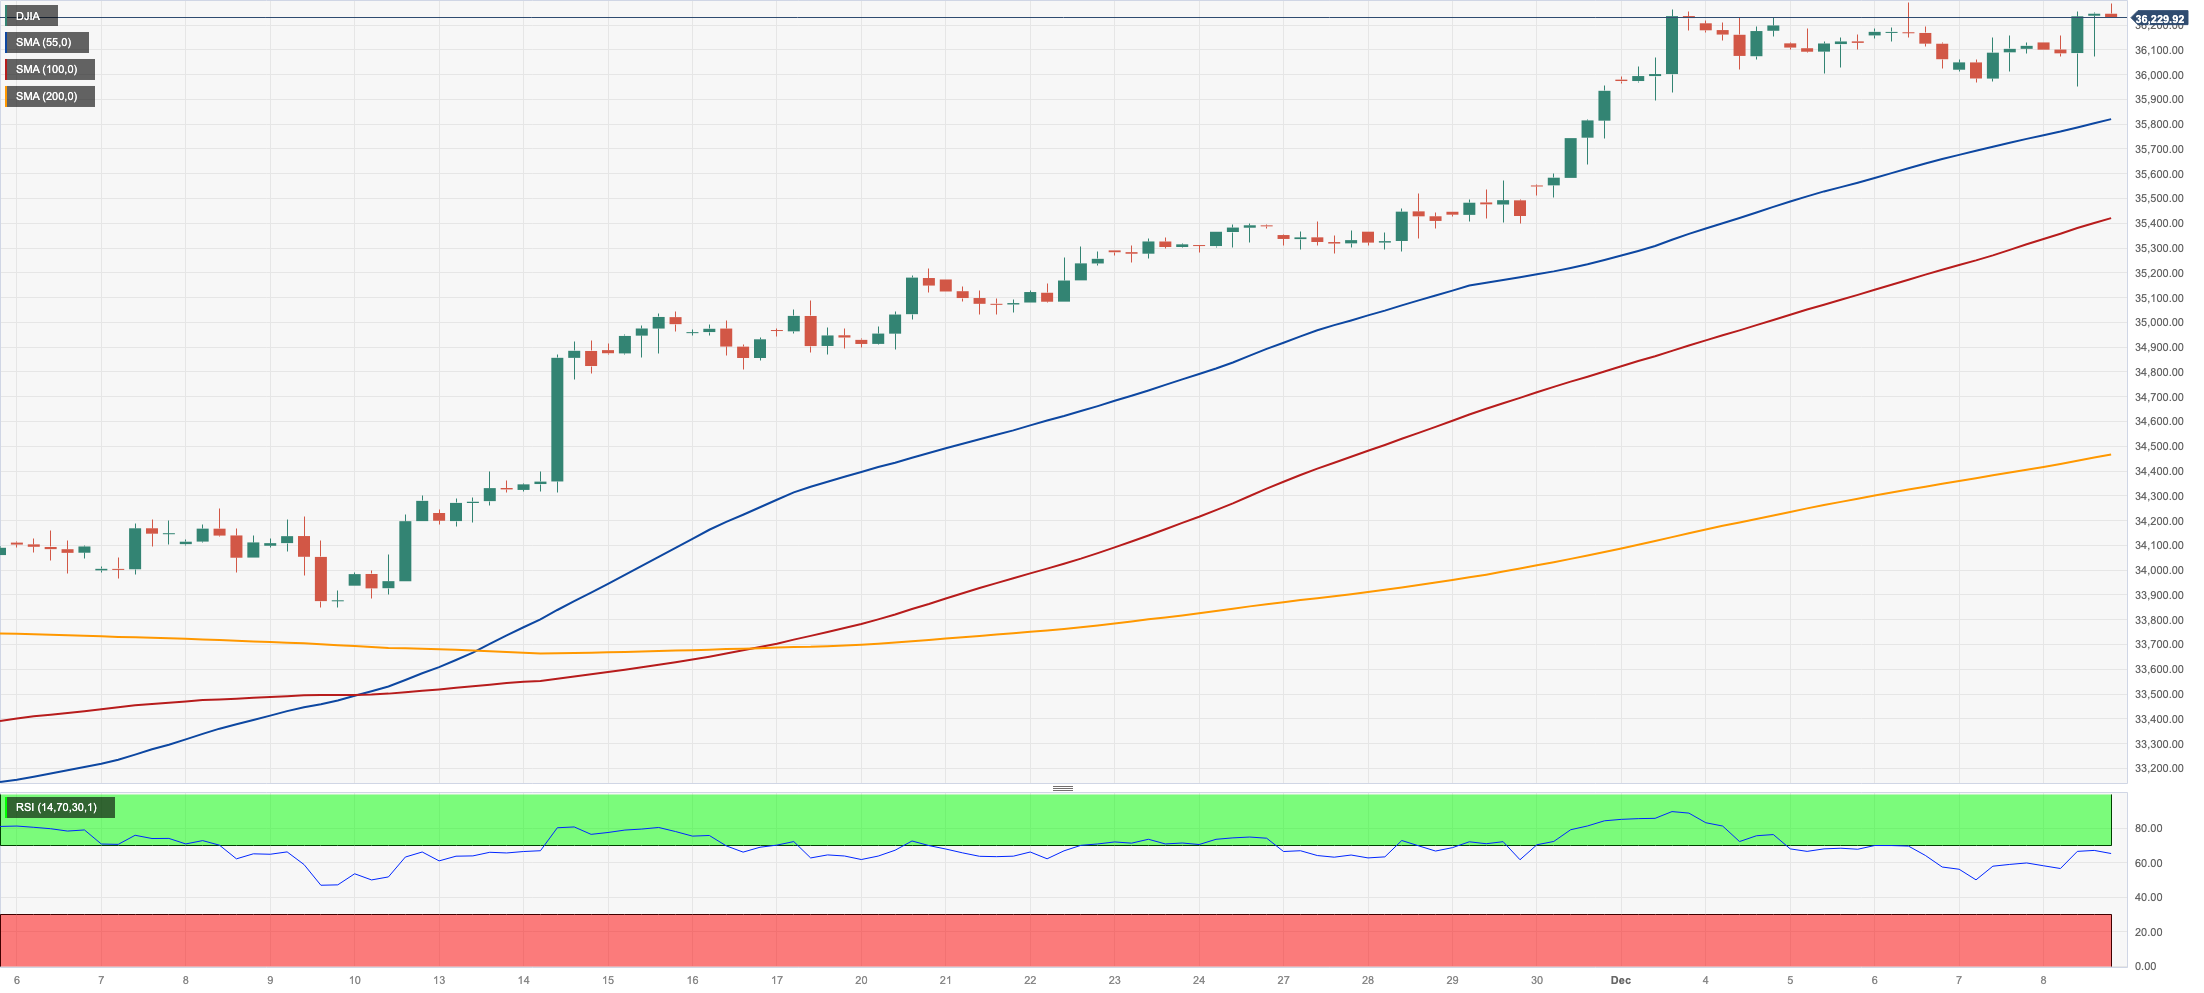
DOW JONES
The key stock reference Dow Jones added to Thursday’s gains and rose to a new YTD top near 36300 at the end of the week.
In fact, the optimism among market participants remained well and sound and was propped up further following the better-than-expected US jobs report, where the economy created more jobs than anticipated and the unemployment rate ticked lower in November.
Further support also came from the firm view that the Fed might start cutting rates at some point in the spring of 2024.
On Friday, the Dow Jones gained 0.36% to 36247, the S&P500 advanced 0.41% to 4604, and the tech-focused Nasdaq Composite rose 0.45% to 14403.
If the Dow Jones clears the 2023 high of 36296 (December 8), it may reach the all-time top of 36952 (January 5, 2022) prior to the round level of 37000. The other way around, the 200-day SMA of 33971 and the weekly low of 33859 should offer support (November 7) ahead of the October low of 32327 (October 27). The breakdown of the latter might open the way for a move to the 2023 bottom of 31429 (March 15), before the 2022 low of 28660 (October 13). The daily RSI rose above 76, remaining above the overbought zone.
Top Performers: Boeing, Goldman Sachs, Chevron
Worst Performers: Honeywell, Walmart, Verizon
Resistance levels: 36296 36513 36952 (4H chart)
Support levels: 34510 33859 32327 (4H chart)
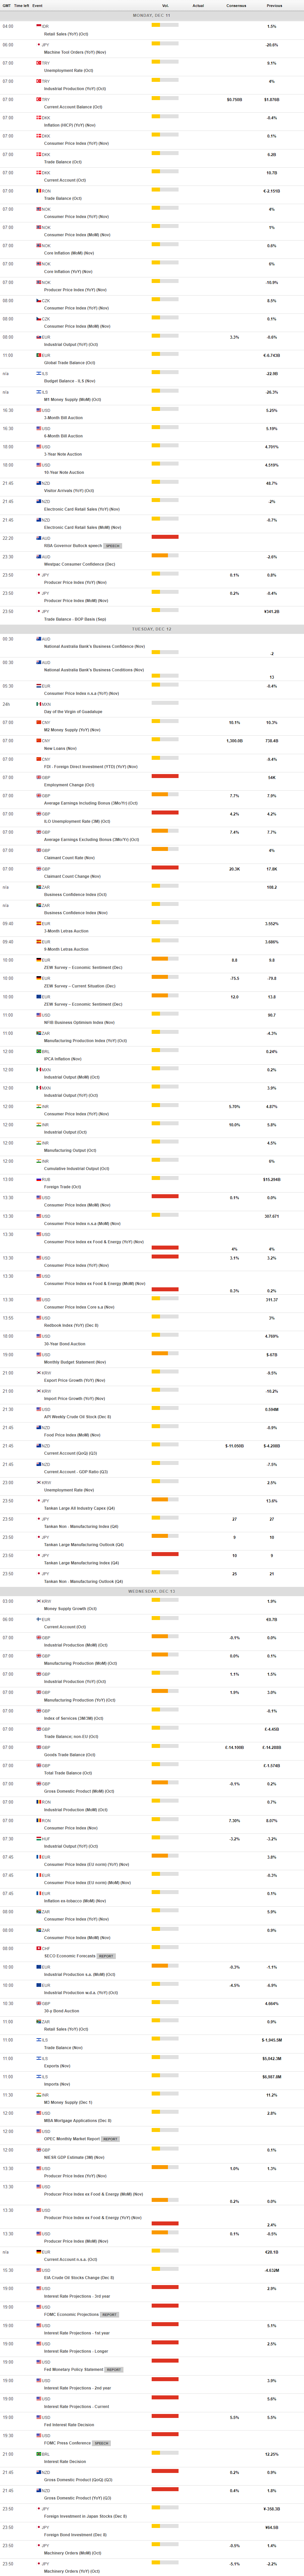
MACROECONOMIC EVENTS
All Information & Updates provided by:

All information relating to the financial markets available on this page has been prepared and issued by FXStreet (Forexstreet SL, Spain, Reg: B62498233) on the basis of publicly available information and all information believed to be reliable and does not conflict with Kuwaiti local laws, and all necessary care has been taken to before the company to ensure that the facts mentioned are correct from the source.
NCM Investment nor any of its directors or employees shall in any way be held responsible for the contents of this news, and the information contained on this page is intended only to provide clients with publicly available information and should not be construed as investment advice, report or analysis and/or constitute an offer or invitation to buy or sell financial instruments of any kind.
RISK WARNING: Forex and CFDs are highly risky leveraged products, as losses can exceed deposits. Please ensure you understand all the risks and take independent advice if necessary. NCM will segregate the clients based on the criteria of the regulator and its bylaws. NCM does not provide any advisory service; the material published does not constitute advice or a recommendation for a transaction in any financial instrument. NCM accepts no responsibility for any use of the content presented and any consequences of that use. Anyone acting on the information provided does so at their own risk.