
- Contact Us:
-

-

-

-


Daily Market Updates
12 Dec 2023
EURUSD
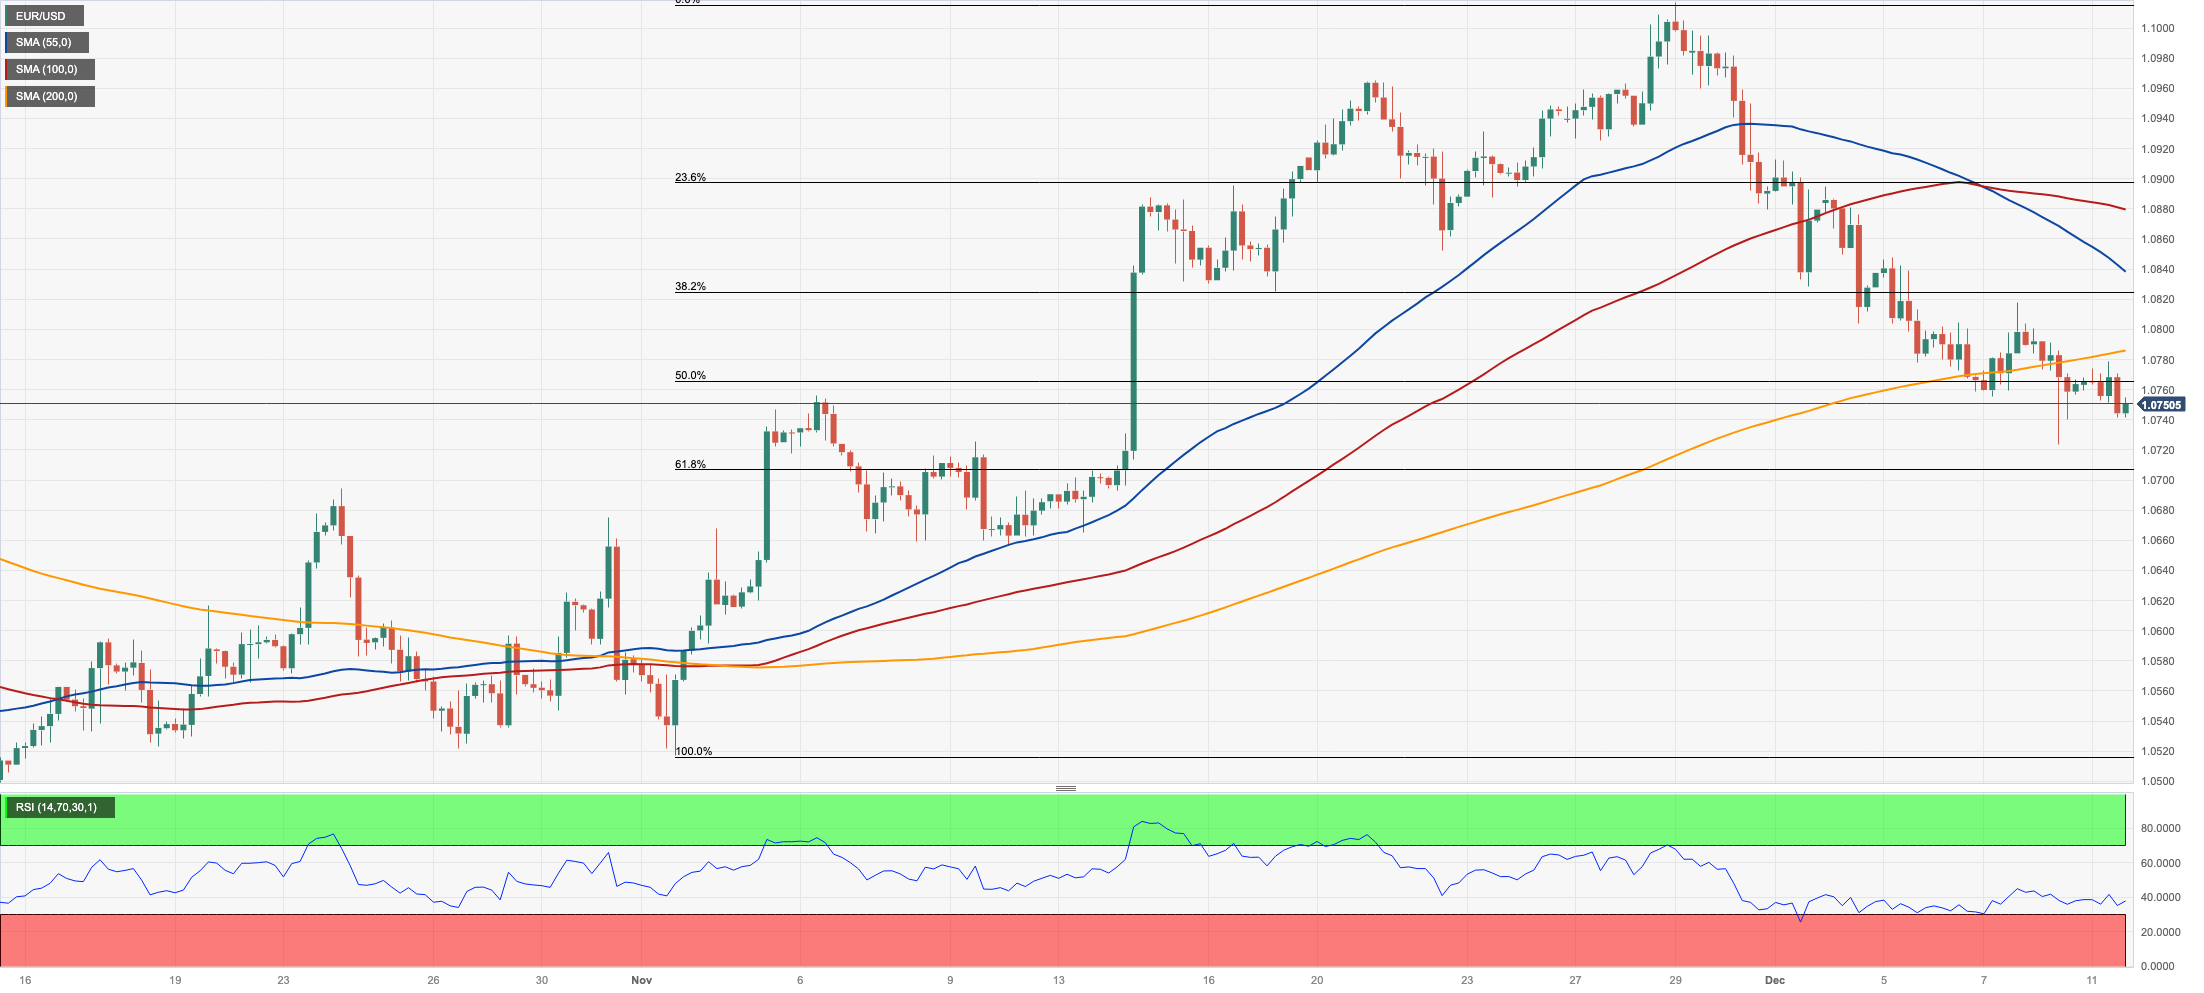
An apathetic beginning of the week saw EUR/USD hover around the mid-1.0700s on the back of the decent bid bias surrounding the greenback.
On the latter, the USD Index (DXY) managed to keep the trade in the low 104.00s against the backdrop of further recovery in US yields across different timeframes, while cautiousness among market participants is expected to pick up pace ahead of the publication of US inflation figures on December 12 as well as the Federal Reserve and the ECB interest rate decisions.
In the meantime, consensus continues to favour an “on-hold” stance from both central banks, while speculation of interest rate cuts at some point in the spring of 2024 remains well on the rise.
Adding to the impassive start of the new trading week, there were no data releases scheduled on both sides of the Atlantic.
If the EUR/USD goes below the December low of 1.0723 (December 8), it is likely to test the transitory 55-day SMA at 1.0707. The loss of the latter might revive a challenge to the weekly low of 1.0495 (October 13), which comes before the 2023 low of 1.0448 (October 3) and the round level of 1.0400. Further advances might push the pair back to the 200-day SMA at 1.0822 before the November high of 1.1017 (November 29). Once cleared, spot may confront the August top of 1.1064 (August 10) and the weekly peak of 1.1149 (July 27), all of which precede the 2023 high of 1.1275 (July 18). The daily RSI receded to the proximity of 44.
Resistance levels: 1.0817 1.0881 1.1017 (4H chart)
Support levels: 1.0723 1.0656 1.0516 (4H chart)
USDJPY
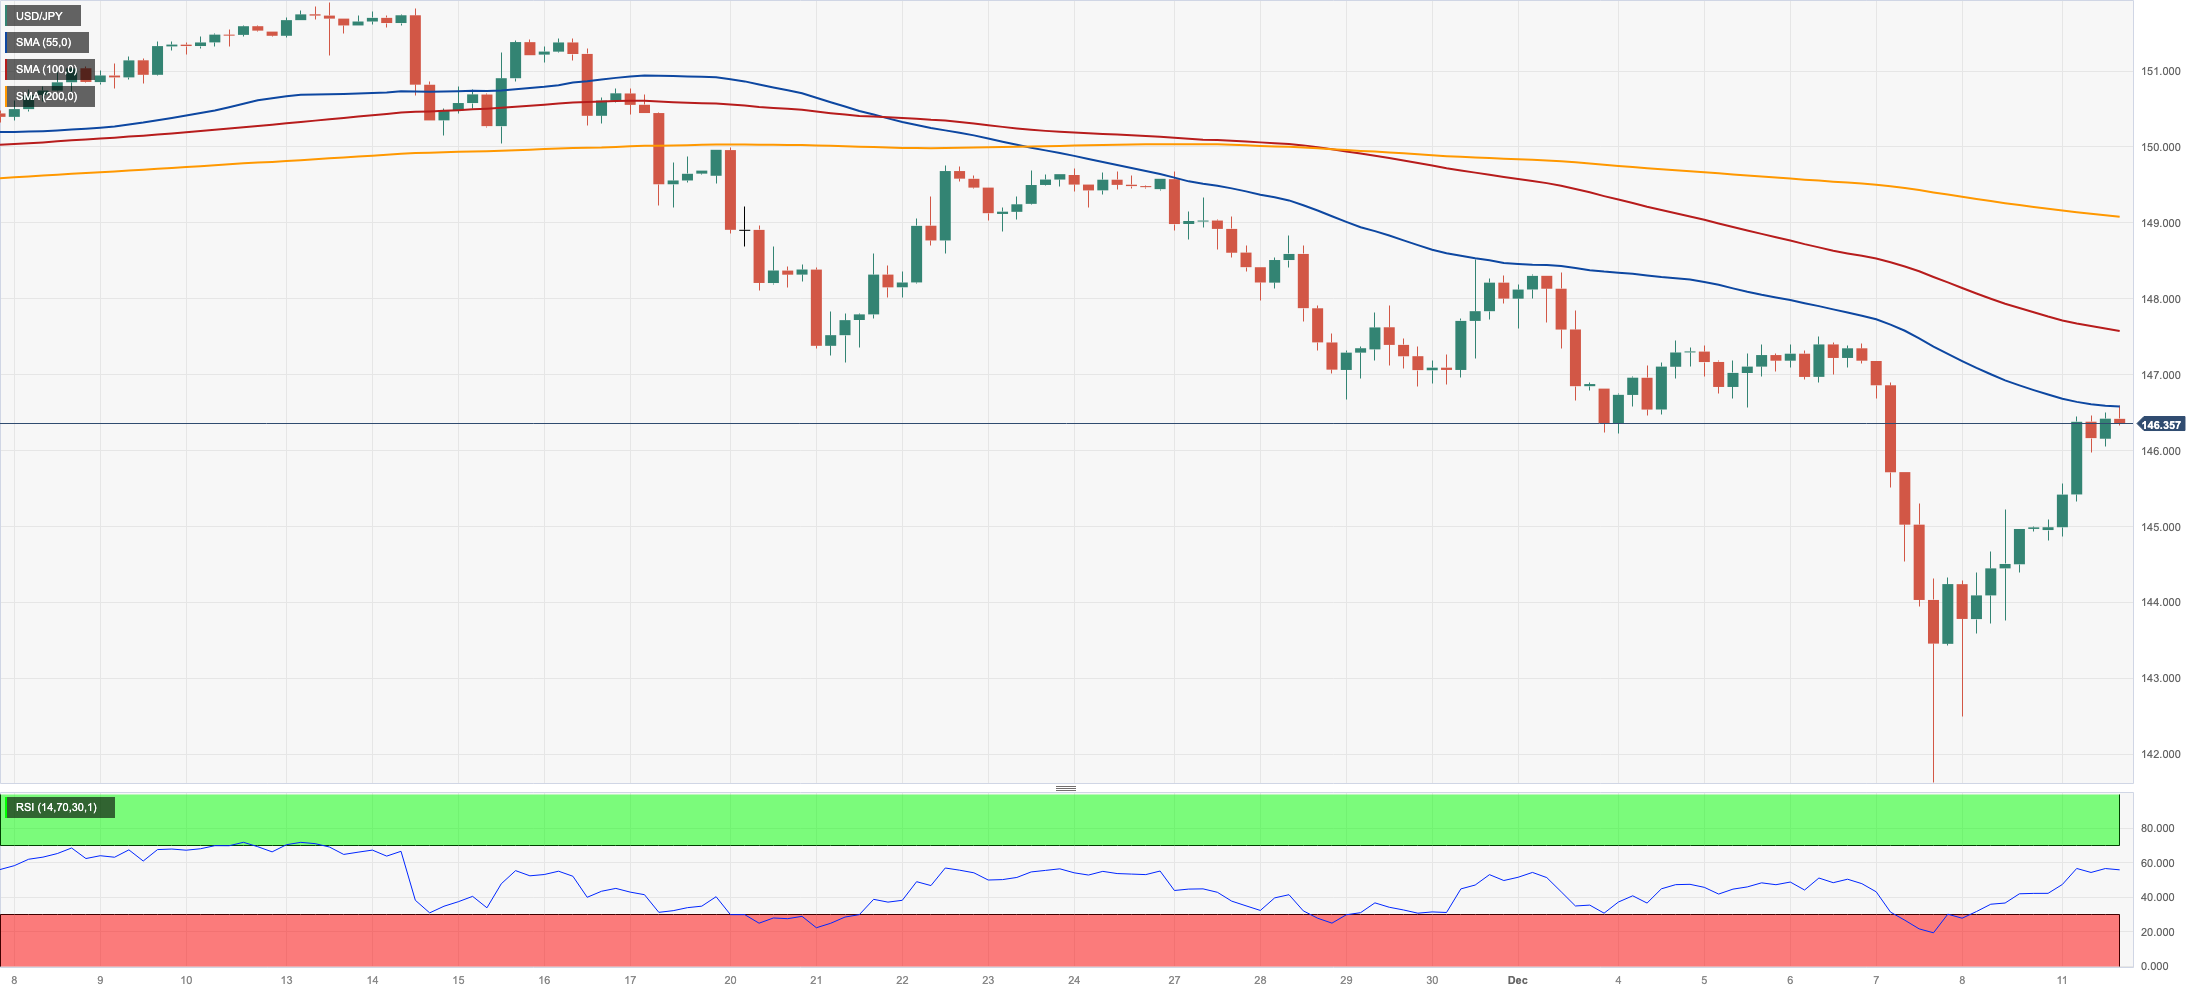
Further weakness around the Japanese yen encouraged USD/JPY to extend Friday’s bounce, which rose to two-day highs well north of the 146.00 hurdle at the beginning of the week.
Indeed, comments from BoJ officials practically ruling out any change to the monetary policy stance at the bank’s December event weighed on the safe-haven currency and favoured further gains in spot on Monday.
Further upside momentum in the pair also came on the back of rising US yields across the curve vs. the negative session in the JGB 10-year yields.
In Japan, BSI Large Manufacturing expanded 5.7% QoQ for the October–December period.
In case sellers regain the upper hand, there is an initial contention zone at the key 200-day SMA at 142.37 prior to the December low of 141.60 (December 7). The loss of the latter could open the door to a potential test of the August low of 141.50 (August 7), which comes before the July low of 137.23 (July 14). On the flip side, the 55-day SMA at 149.22 is expected to offer interim resistance ahead of the 2023 peak of 151.90 (November 13) and the 2022 high of 151.94 (October 21), both before the round number of 152.00. The RSI surpassed the 42 yardstick.
Resistance levels: 146.58 147.49 148.52 (4H chart)
Support levels: 141.60 141.50 138.05 (4H chart)
GBPUSD
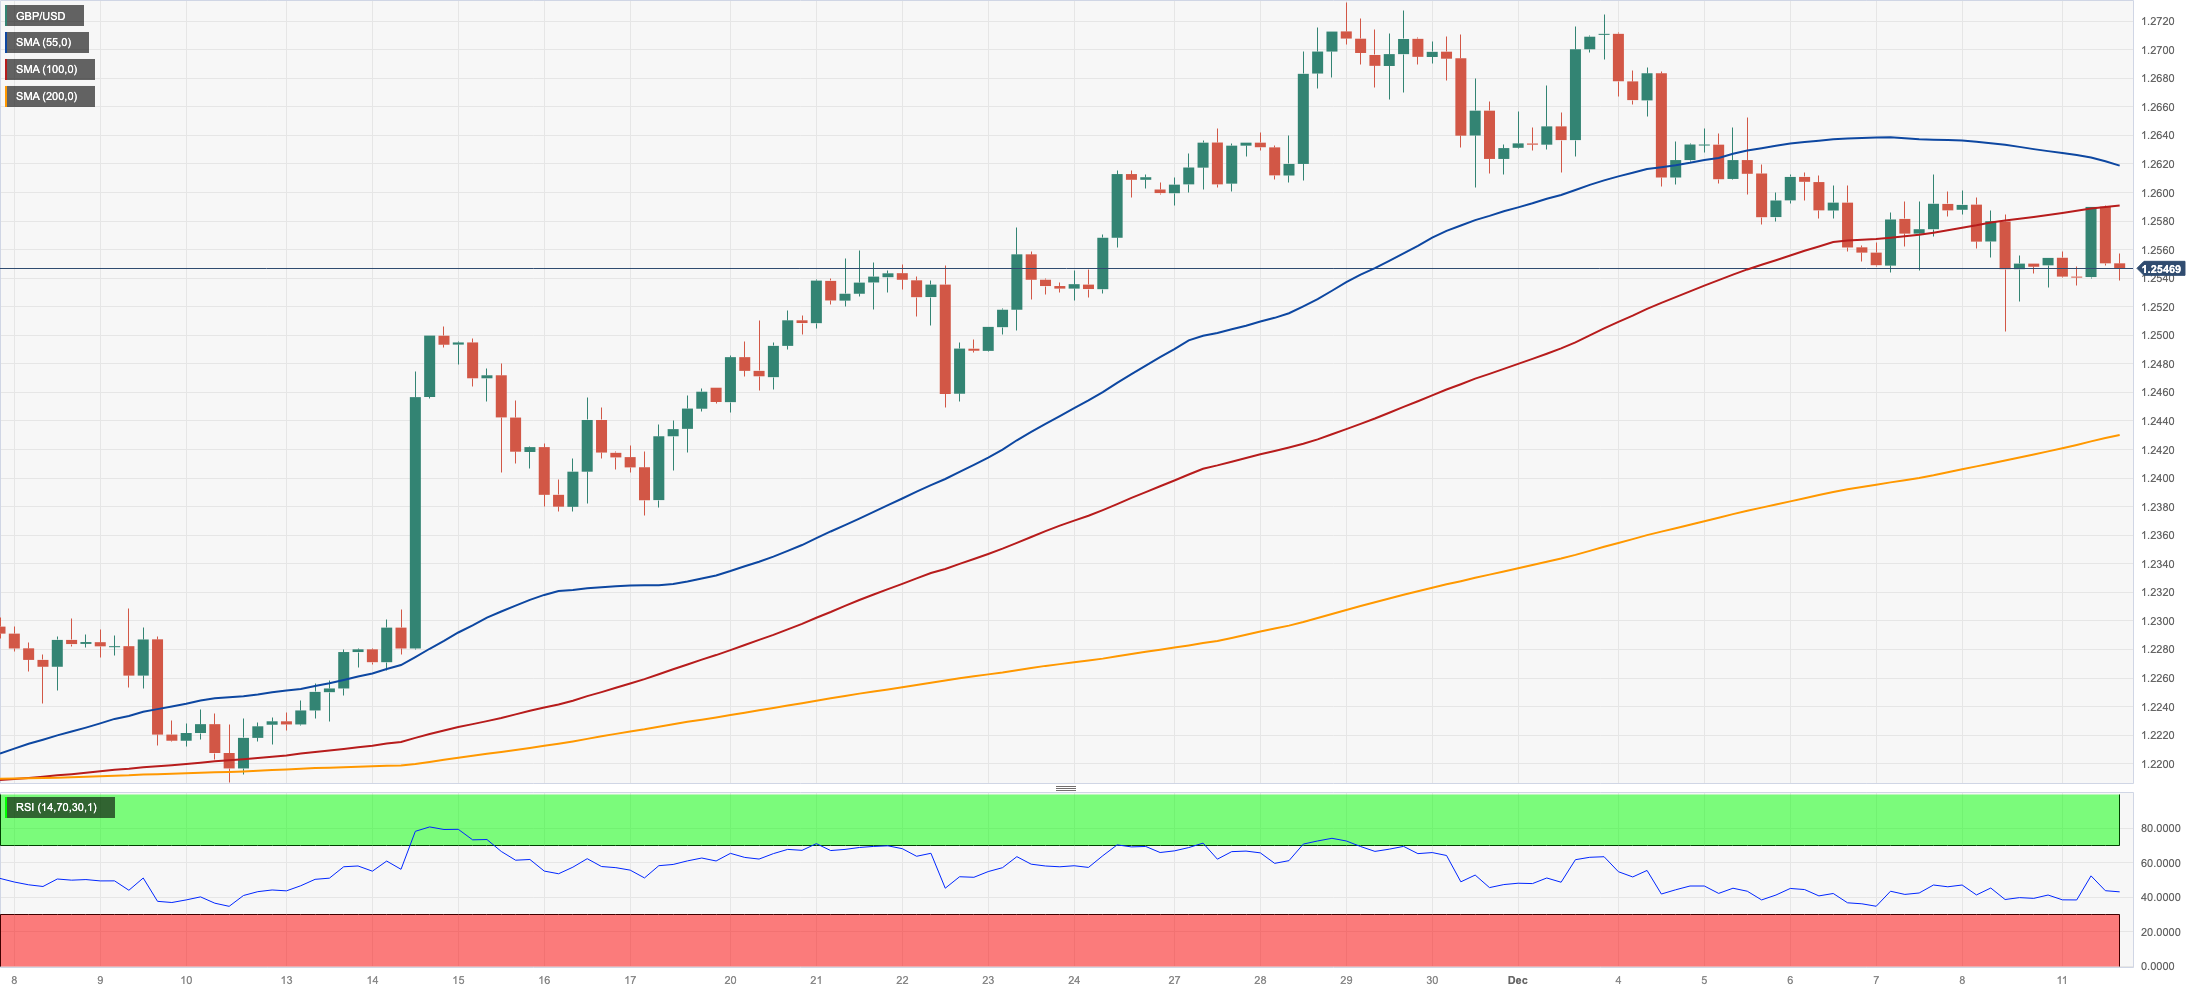
The British pound seems to have followed dynamics of its own and prompted GBP/USD to leave behind Friday’s pullback and chart marginal gains around the 1.2550 region on Monday.
In fact, Cable regained some shine despite the tepid advance in the greenback and the generalized prudence among market participants in light of upcoming key data releases as well as interest rate decisions by the Fed, BoE, and ECB.
The UK docket was empty at the beginning of the week, leaving all attention to the publication of the UK labour market report on Tuesday.
Around the UK fixed-income market, the 10-year gilt yields clinched their third daily advance in a row, approaching the 4.10% level.
For GBP/USD, the key 200-day SMA at 1.2484 now stands in front of the intermediate 55-day SMA at 1.2329 and the weekly low of 1.2187 (November 10). Down from here, the October bottom of 1.2037 (October 3), the critical 1.2000 level, and the 2023 low of 1.1802 (March 8) are all aligned. The next upward hurdle, on the other hand, is the November top of 1.2733 (November 29). If this level is broken, it might lead to weekly peaks of 1.2746 (August 30), 1.2818 (August 10), and 1.2995 (July 27), all of which happen before the crucial 1.3000 yardstick. The daily RSI looked stable around 54.
Resistance levels: 1.2612 1.2715 1.2733 (4H chart)
Support levels: 1.2502 1.2448 1.2373 (4H chart)
AUDUSD
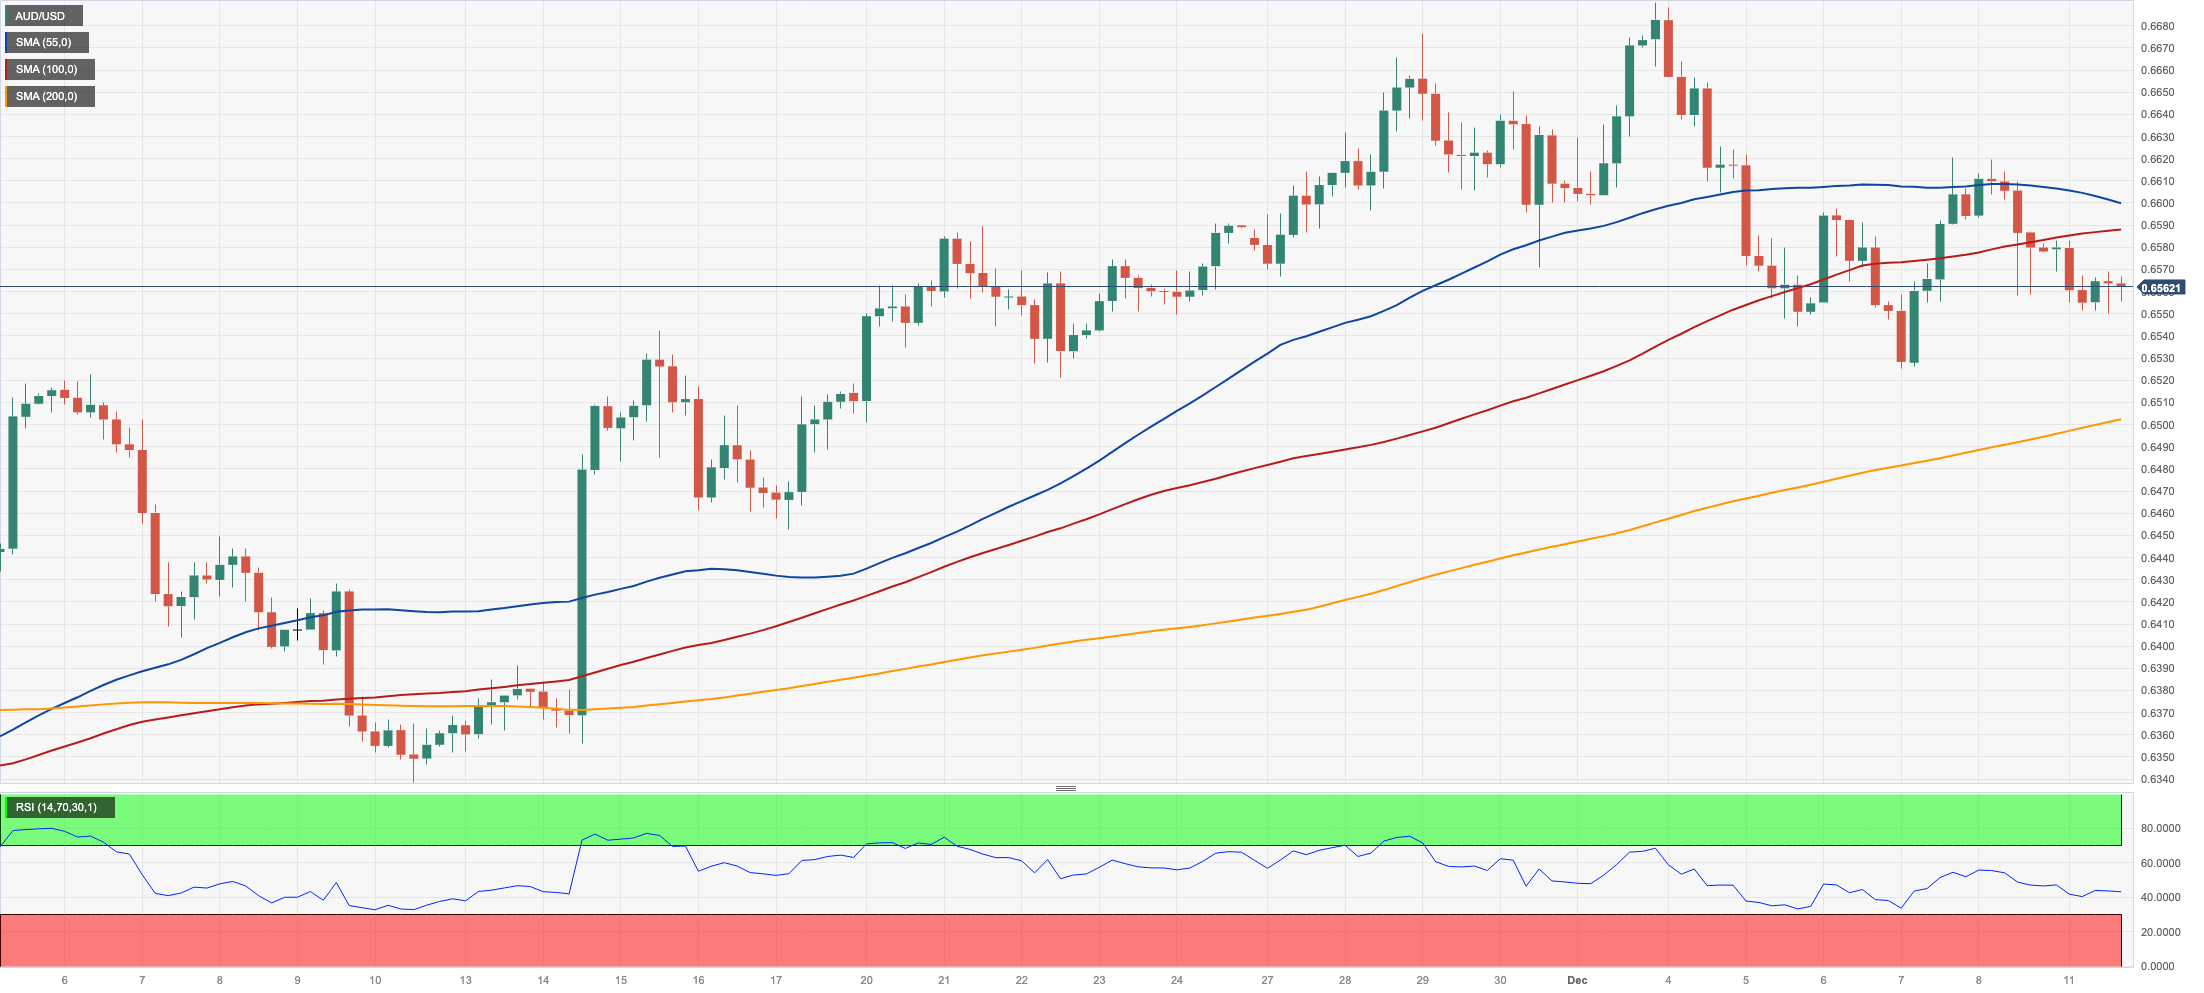
AUD/USD added small losses to Friday’s decline, all amidst a narrow trading range in the 0.6560 zone on Monday.
The meagre advance in the greenback seems to have been enough to put the Aussie dollar under pressure, while the broad-based mixed tone in the commodity complex also contributed to the sour sentiment surrounding the high-beta currency.
Next on tap in the Australian calendar will be the Consumer Sentiment gauge tracked by Westpac and due on December 12.
If the AUD/USD falls below the December low of 0.6525 (December 7), it might retest the temporary 100-day and 55-day SMAs of 0.6462 and 0.6443, respectively. If the latter is dropped, a move to the 2023 bottom of 0.6270 (October 26) could emerge on the horizon before the round level of 0.6200 and the 2022 low of 0.6169 (October 13). Having said that, the next up-barrier comes at the December top of 0.6690 (December 4) prior to the July peak of 0.6894 (July 14), which is just ahead of the June high of 0.6899 (June 16) and the key 0.7000 level. The daily RSI ticked lower to the 53 area.
Resistance levels: 0.6620 0.6690 0.6739 (4H chart)
Support levels: 0.6525 0.6494 0.6452 (4H chart)
GOLD
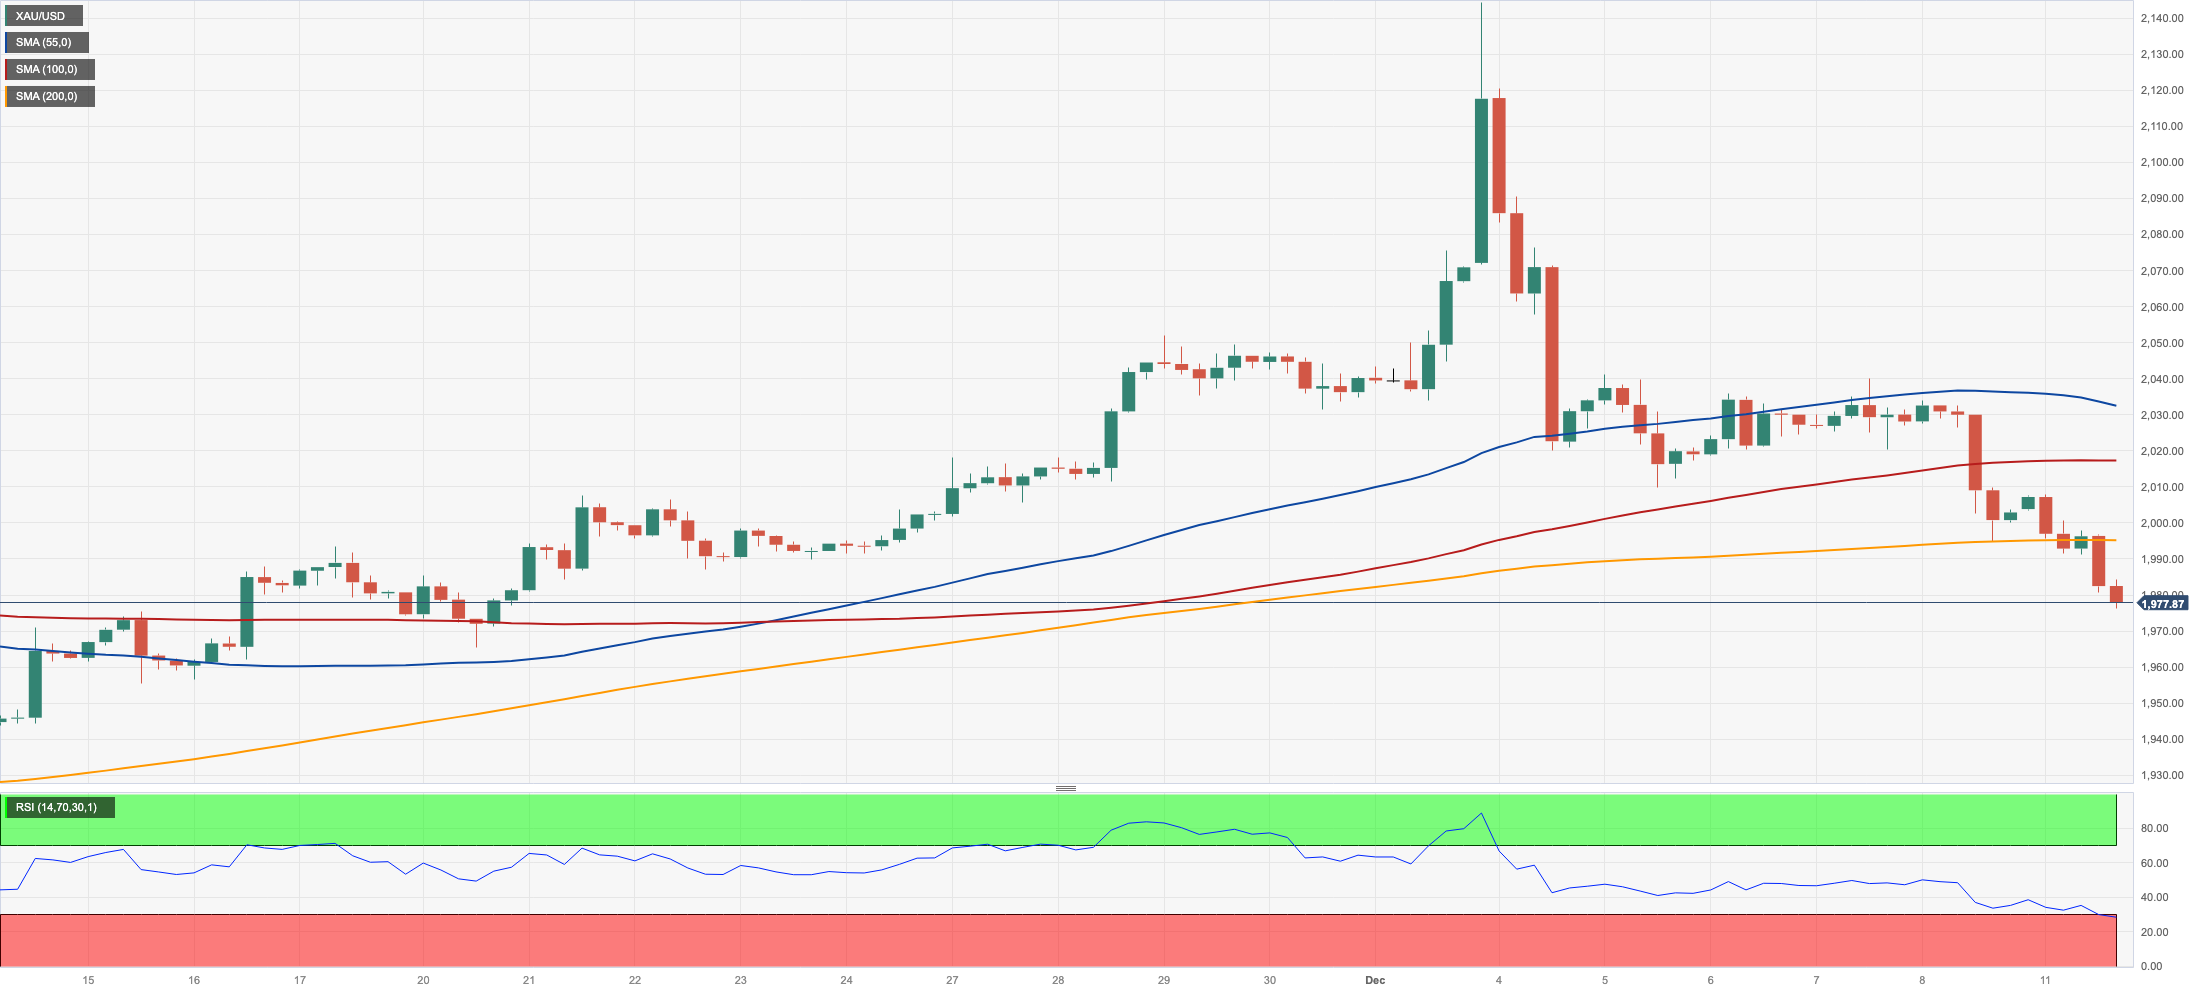
Another negative session for the precious metal dragged prices to multi-day lows well south of the critical $2000 mark per troy ounce on Monday.
In fact, the continuation of the march north in the greenback in combination with higher US yields across the board maintained the bearish tone unchanged around bullion for the second straight session, all against the backdrop of increasing cautiousness ahead of key US fundamentals as well as the interest rate decision by the Federal Reserve.
The prospects for extra losses in gold now target the key 200-day SMA of $1951 before the November low of $1931 (November 13). If this level is cleared, the October low of $1810 (October 6) may become relevant, followed by the 2023 bottom of $1804 (February 28), closely followed by the crucial $1800 contention zone. Just the opposite, the resumption of the bullish trend is expected to put the all-time peak of $2150 (December 4) back on the radar.
Resistance levels: $2016 $2041 $2149 (4H chart)
Support levels: $1976 $1965 $1931 (4H chart)
CRUDE WTI
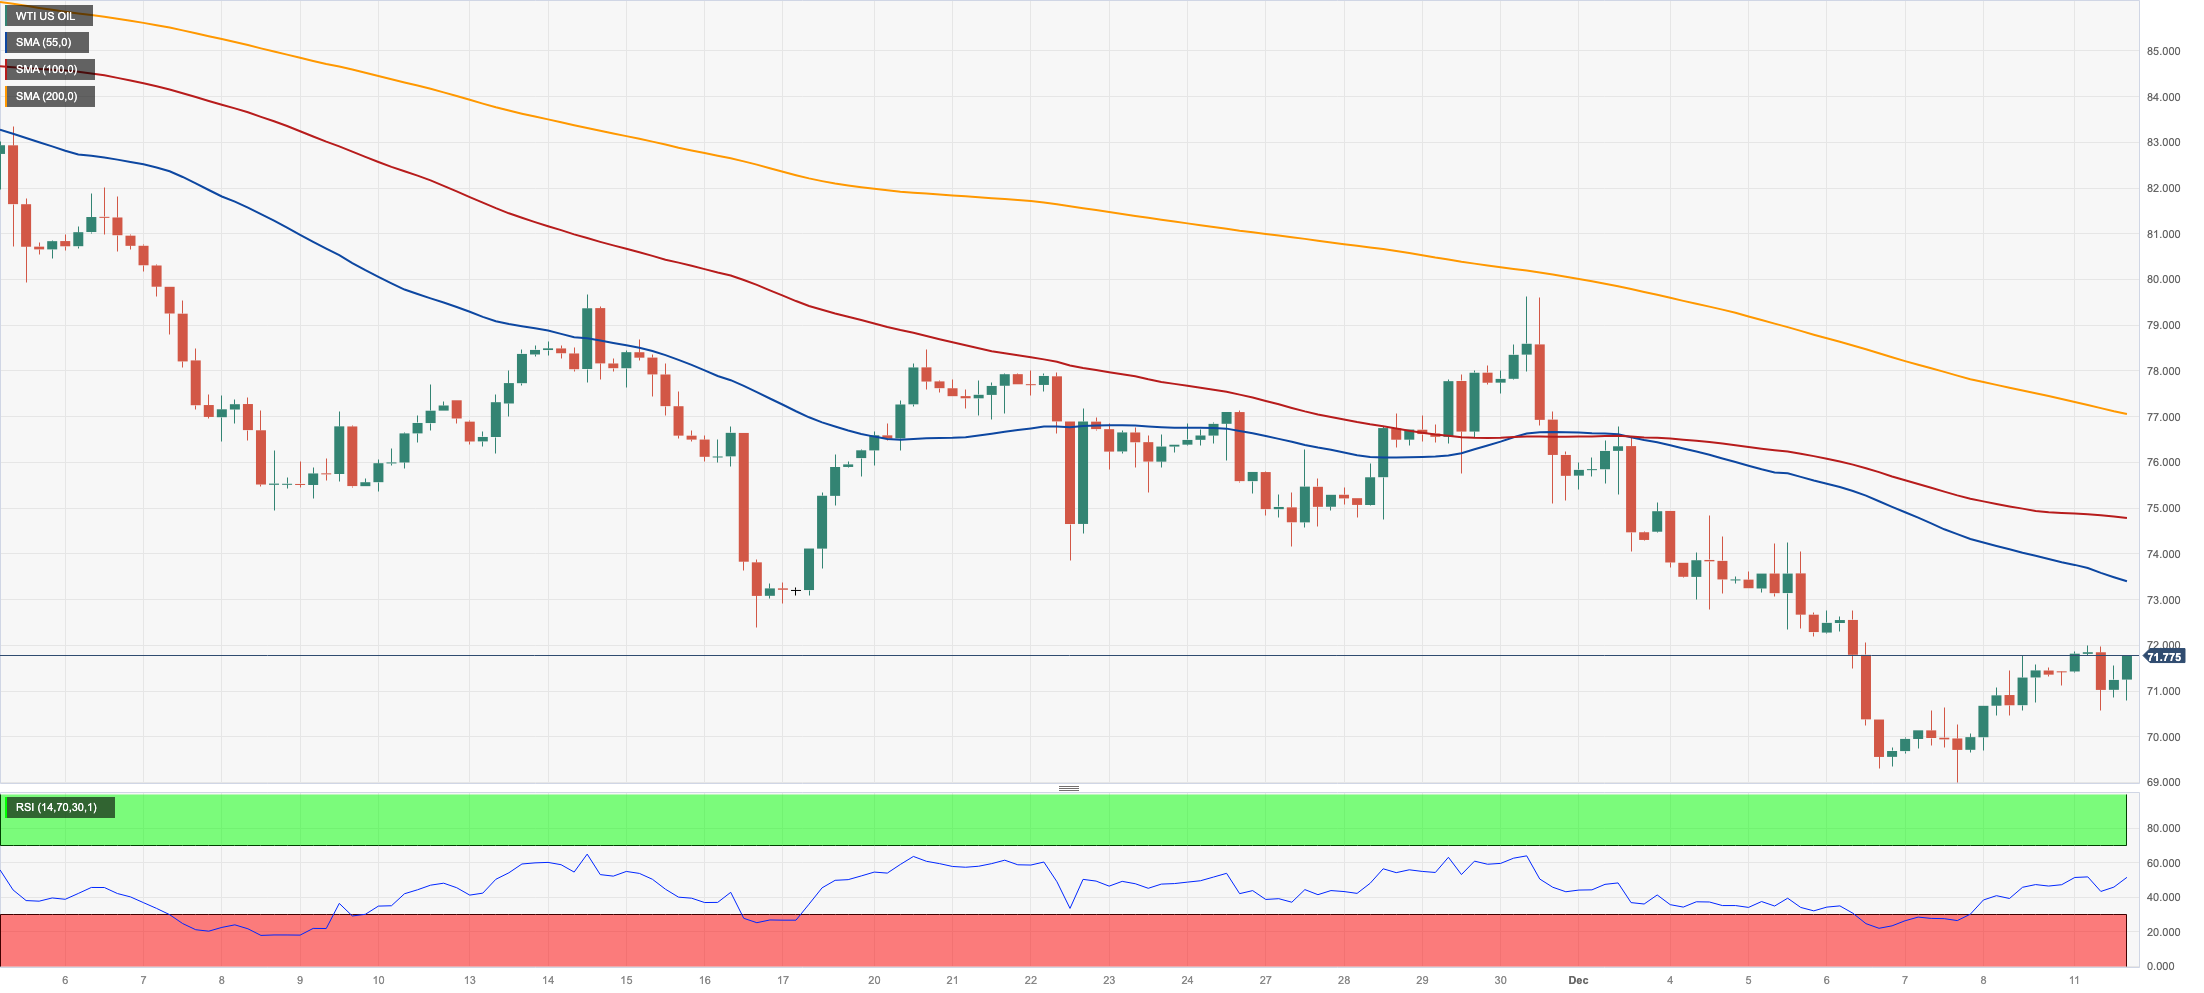
WTI prices traded within a vacillating theme near the $71.00 mark per barrel in quite a dull kick-off the week for the commodity.
In the meantime, rising US oil production as well as demand concerns kept traders’ mood gloomy on Monday, while increasing prudence prior to the publication of US inflation figures (both CPI and PPI) and the Fed’s interest rate decision also played against any attempt at a sustainable recovery of crude oil prices.
If WTI breaches the December low of $68.83 (December 7), it might test the 2023 bottom of $63.61 (May 4) before the critical $60.00 yardstick. In contrast, a break above the 200-day SMA at $77.89 might revive a challenge to the critical $80.00 level, which would be quickly followed by the November high of $80.15 (November 3). Further gains from here might return the market to its weekly top of $89.83 (October 18), seconded by the 2023 peak of $94.99 (September 28). The August 2022 high of $97.65 (August 30) is next, before the psychological $100.00 threshold.
Resistance levels: $71.77 $76.72 $79.56 (4H chart)
Support levels: $70.32 $68.77 $67.01 (4H chart)
DOW JONES
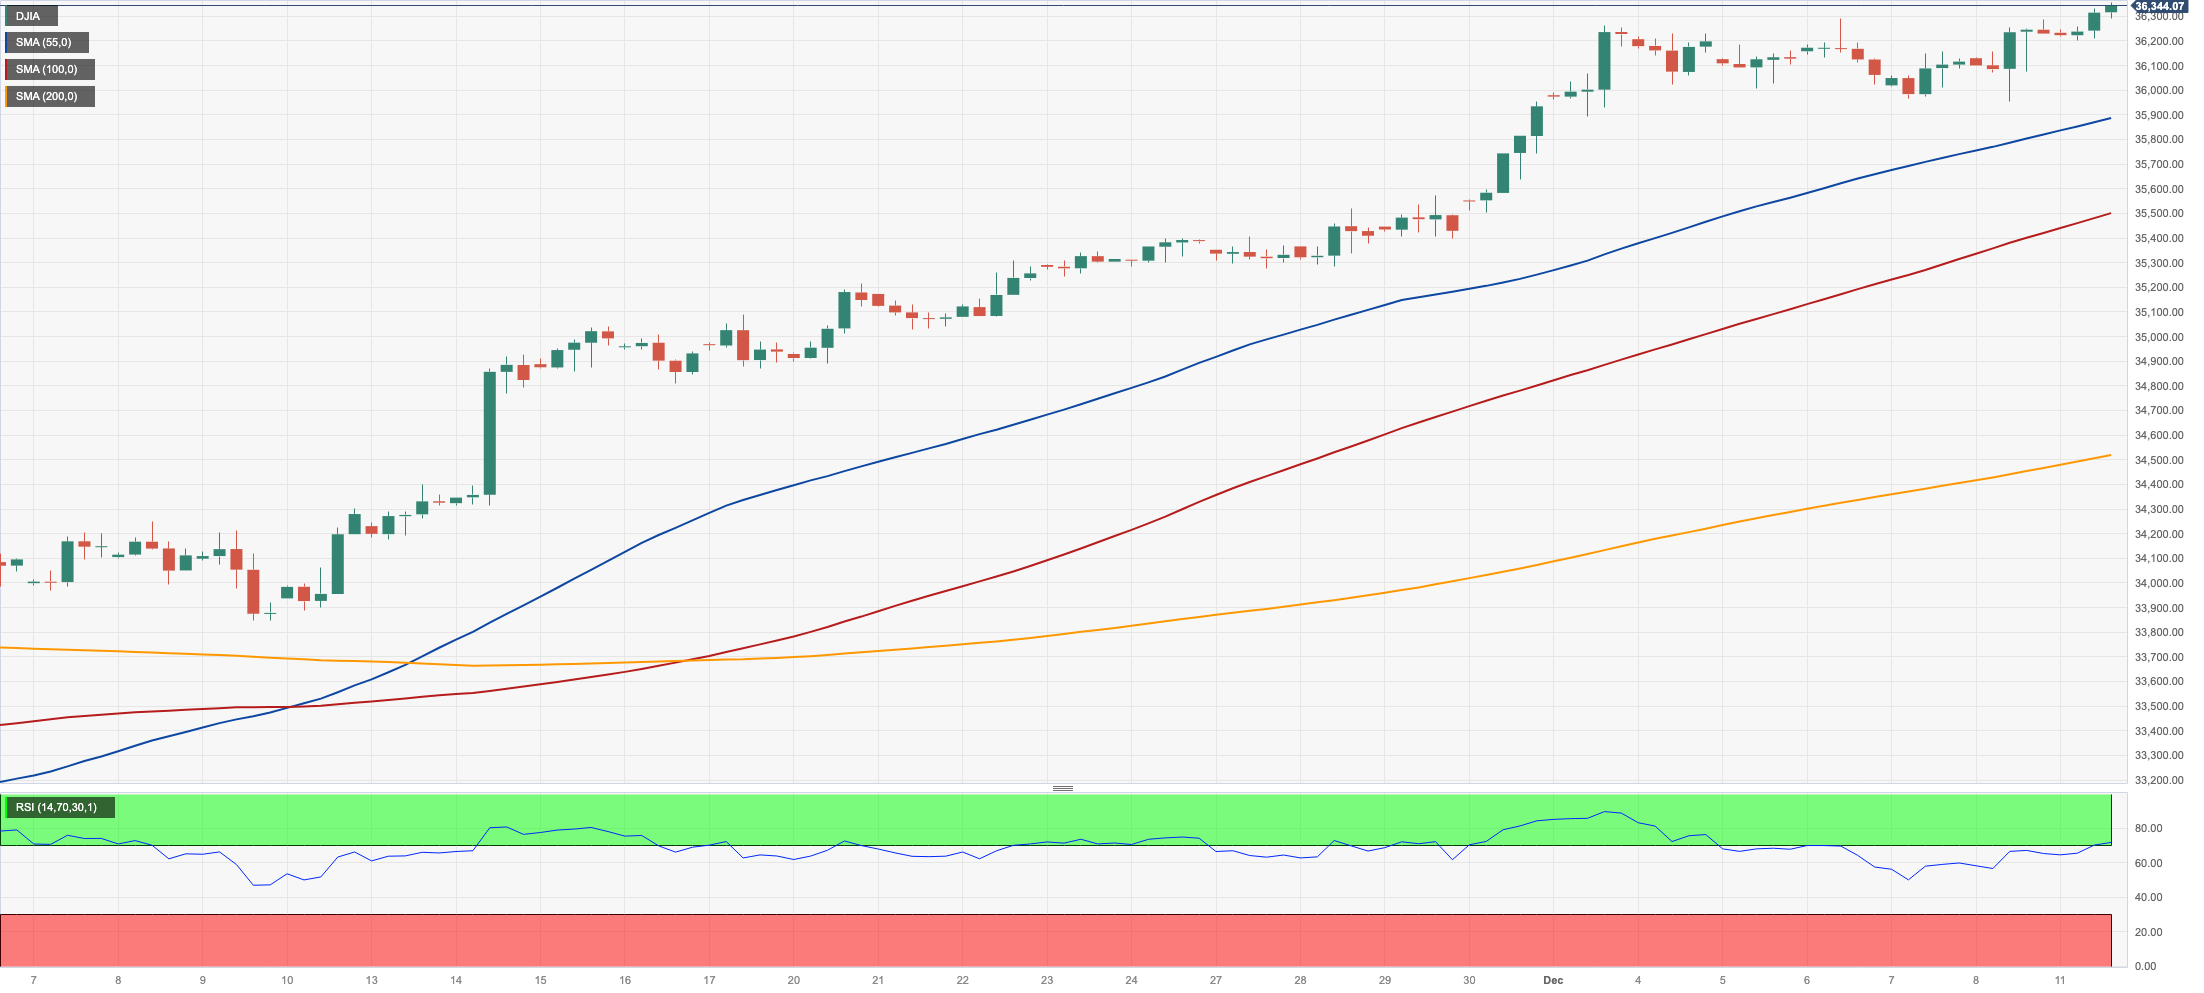
US equities kicked off the new trading week in a positive fashion, building on the current strong upside momentum and pushing the reference Dow Jones to a new yearly high near 36400 on Monday.
The index managed to advance for the third straight session despite the intense move higher in the greenback and further recovery in US yields across different maturities.
Furthermore, extra gains in the Dow came despite the growing prudence among investors ahead of the release of key US CPI (Tuesday) and the FOMC event (Wednesday), where the Federal Reserve is largely anticipated to keep rates unchanged.
All in all, the Dow Jones rose 0.28% to 36349, the S&P500 gained 0.22% to 4614, and the tech-heavy Nasdaq Composite advanced 0.02% to 14407.
If the Dow Jones breaks over the 2023 high of 36296 (December 8), it might reach the all-time high of 36952 (January 5, 2022) before the round level of 37000. The 200-day SMA of 33971 and the weekly low of 33859, on the other hand, should provide support (November 7) ahead of the October low of 32327. (October 27). The latter's collapse might pave the way for a move to the 2023 low of 31429 (March 15), before the 2022 low of 28660. (October 13). The daily RSI increased over 76, staying above the overbought zone.
Top Performers: Intel, Honeywell, Nike
Worst Performers: UnitedHealth, Apple, Verizon
Resistance levels: 36371 36513 36952 (4H chart)
Support levels: 34999 34516 33859 (4H chart)
MACROECONOMIC EVENTS

All Information & Updates provided by:

All information relating to the financial markets available on this page has been prepared and issued by FXStreet (Forexstreet SL, Spain, Reg: B62498233) on the basis of publicly available information and all information believed to be reliable and does not conflict with Kuwaiti local laws, and all necessary care has been taken to before the company to ensure that the facts mentioned are correct from the source.
NCM Investment nor any of its directors or employees shall in any way be held responsible for the contents of this news, and the information contained on this page is intended only to provide clients with publicly available information and should not be construed as investment advice, report or analysis and/or constitute an offer or invitation to buy or sell financial instruments of any kind.
RISK WARNING: Forex and CFDs are highly risky leveraged products, as losses can exceed deposits. Please ensure you understand all the risks and take independent advice if necessary. NCM will segregate the clients based on the criteria of the regulator and its bylaws. NCM does not provide any advisory service; the material published does not constitute advice or a recommendation for a transaction in any financial instrument. NCM accepts no responsibility for any use of the content presented and any consequences of that use. Anyone acting on the information provided does so at their own risk.