
- Contact Us:
-

-

-

-


Daily Market Updates
13 Dec 2023
USDJPY
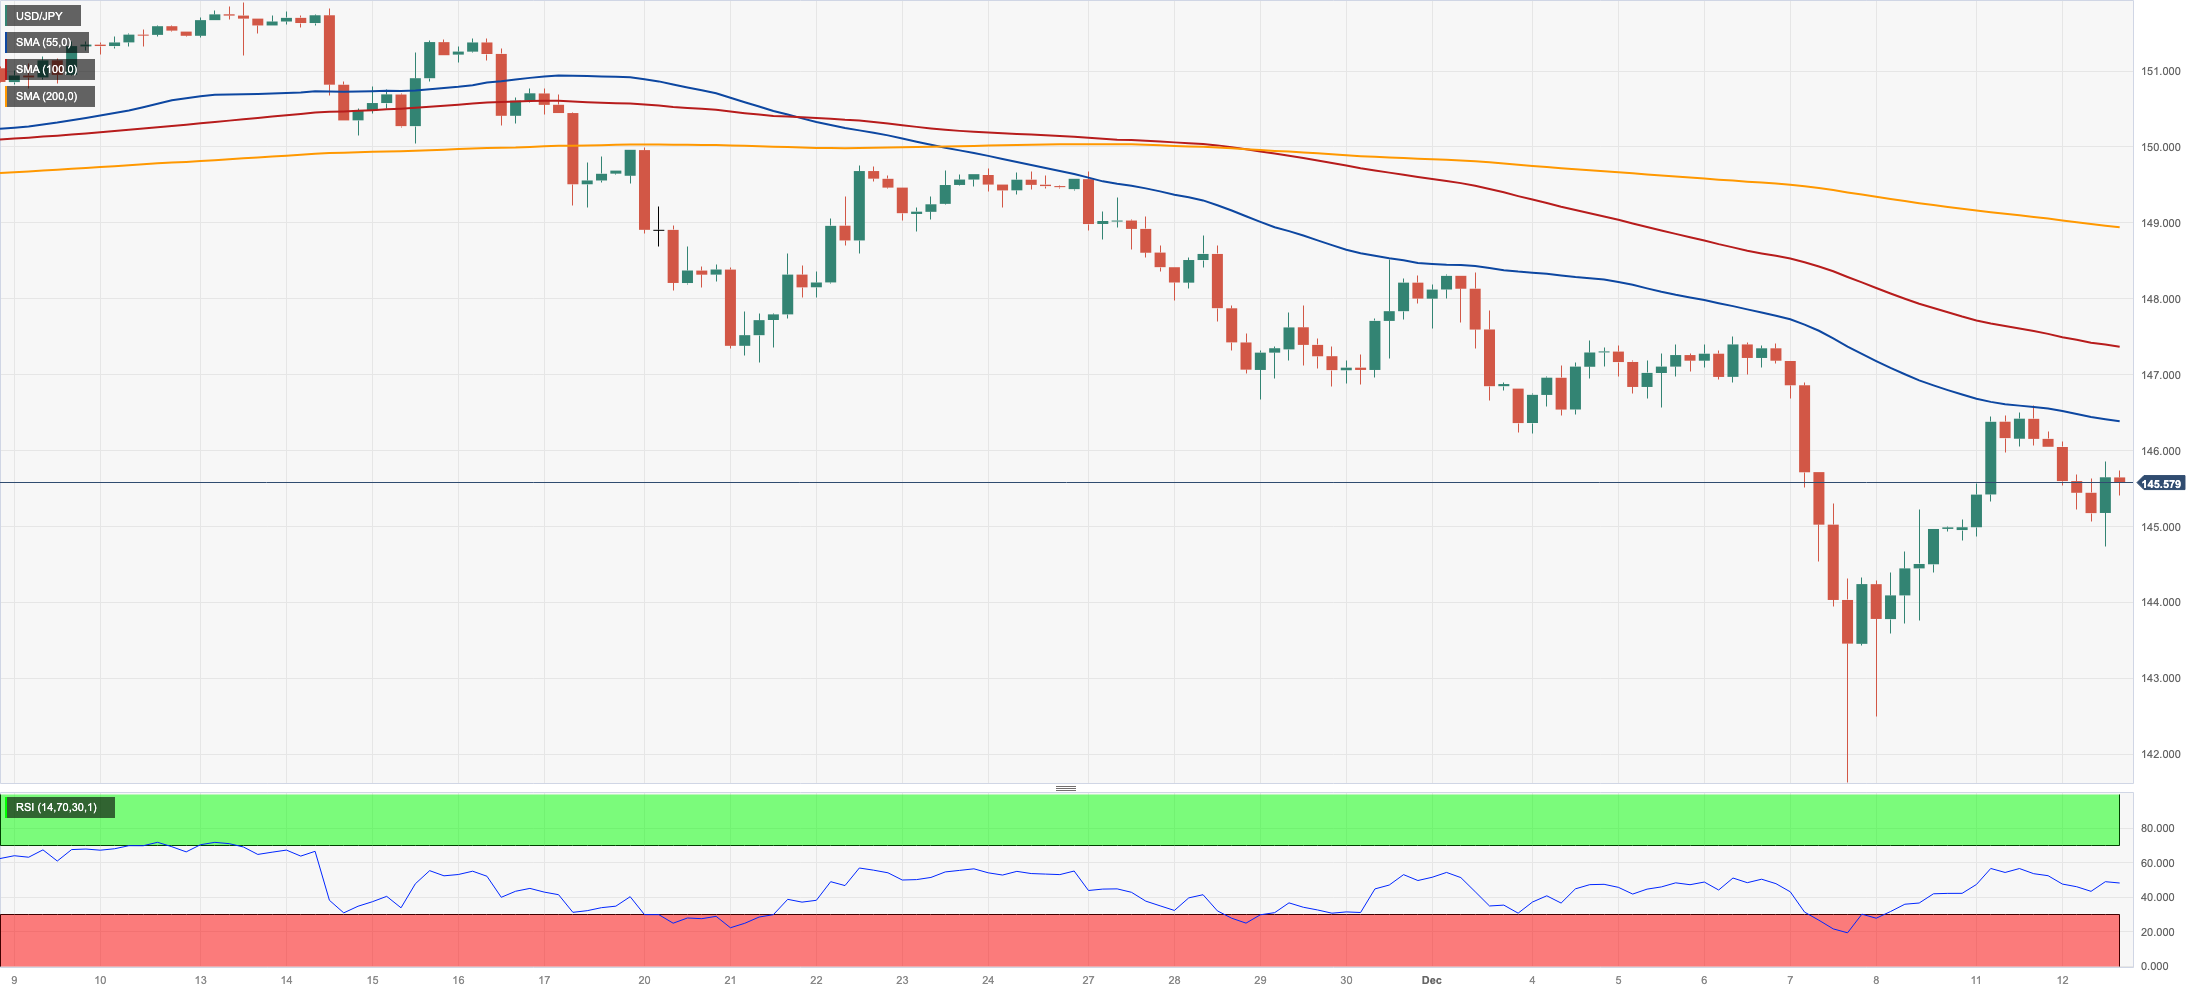
USD/JPY left behind part of the optimism seen at the beginning of the week and briefly revisited the 144.70 region on Tuesday, just to regain some balance afterwards and reclaim the 145.00 barrier and above.
The marked pullback in the greenback in combination with the lack of direction in US yields also contributed to the pair’s daily decline, while JGB 10-year yields added to Monday’s retracement.
In the Japanese docket, Producer Prices rose at a monthly 0.2% in November and 0.3% over the last twelve months.
If sellers take control, an initial conflict zone exists around the crucial 200-day SMA at 142.37, prior to the December low of 141.60. (December 7). The loss of the latter might pave the way for a test of the August low of 141.50 (August 7), which precedes the July low of 137.23 (July 14). On the flip side, the 55-day SMA at 149.15 is projected to provide intermediate resistance ahead of the 2023 peak of 151.90 (November 13) and the 2022 high of 151.94 (October 21), all of which are before the round number of 152.00. The RSI grinded lower to 39.
Resistance levels: 146.58 147.49 148.52 (4H chart)
Support levels: 144.72 141.41 138.05 (4H chart)
GBPUSD
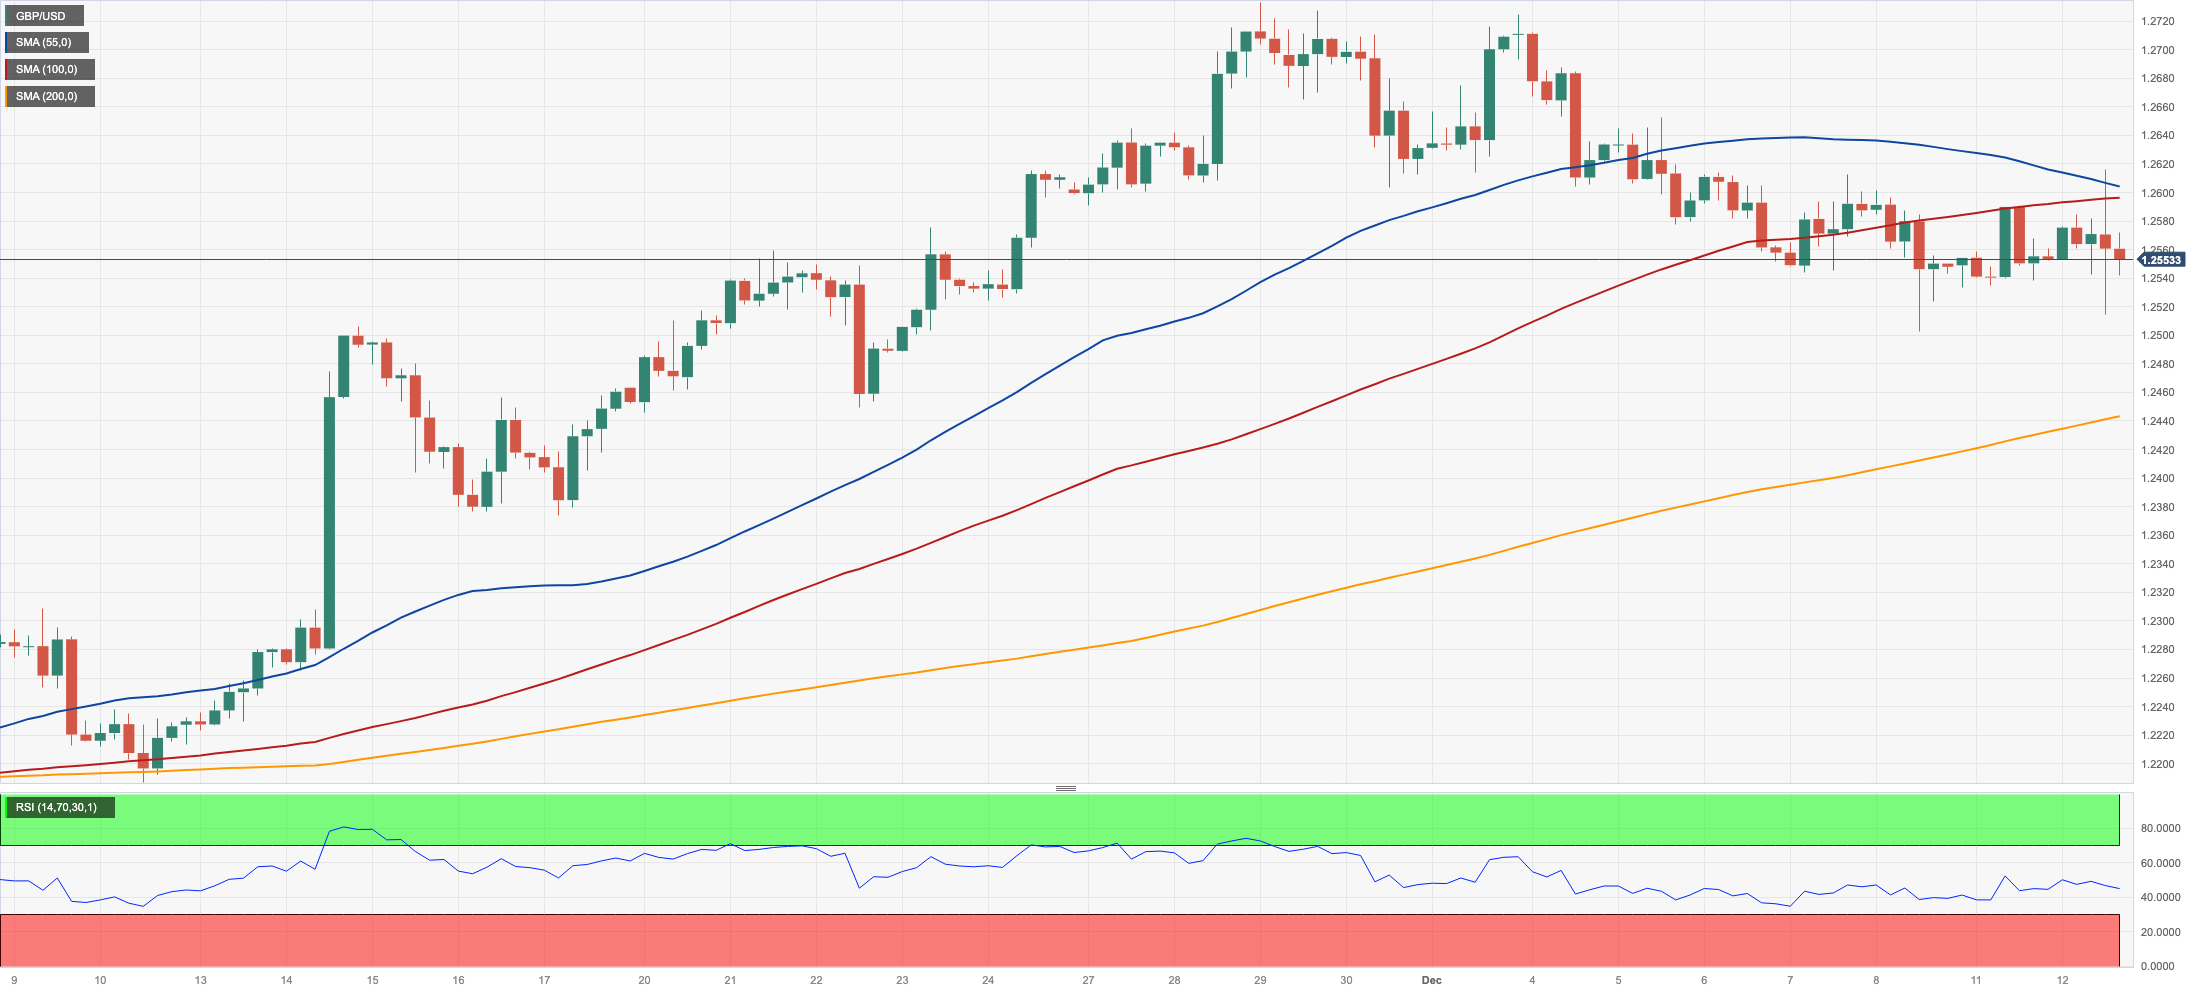
GBP/USD charted a meagre advance to the 1.2560 region on turnaround Tuesday.
Indeed, the British pound practically ignored the selling pressure around the dollar, although further cooling of the UK labour market reinforced the view that the BoE might keep its interest rate unchanged at its event later in the week.
Back to the UK docket, Employment Change rose by 50K in September, and the jobless rate held steady at 4.2% in October. Additional results saw the Average Earnings inc. Bonus rise less than expected by 7.2% in the year to October, while the Claimant Count Change went up by 16K in November.
In the UK bond market, the 10-year gilt yields left behind three consecutive daily gains and retreated to the sub-4.0% region.
The crucial 200-day SMA at 1.2490 currently stands ahead of the intermediate 55-day SMA at 1.2336 and the weekly low of 1.2187 (November 10) for GBP/USD. The October low of 1.2037 (October 3), the crucial 1.2000 level, and the 2023 low of 1.1802 (March 8) are all aligned down from here. On the flip side, the immediate up-barrier aligns at the November high of 1.2733 (November 29). If this level is surpassed, weekly tops of 1.2746 (August 30), 1.2818 (August 10), and 1.2995 (July 27) may occur before the important 1.3000 threshold. The daily RSI settled above 55.
Resistance levels: 1.2614 1.2715 1.2733 (4H chart)
Support levels: 1.2502 1.2448 1.2373 (4H chart)
AUDUSD
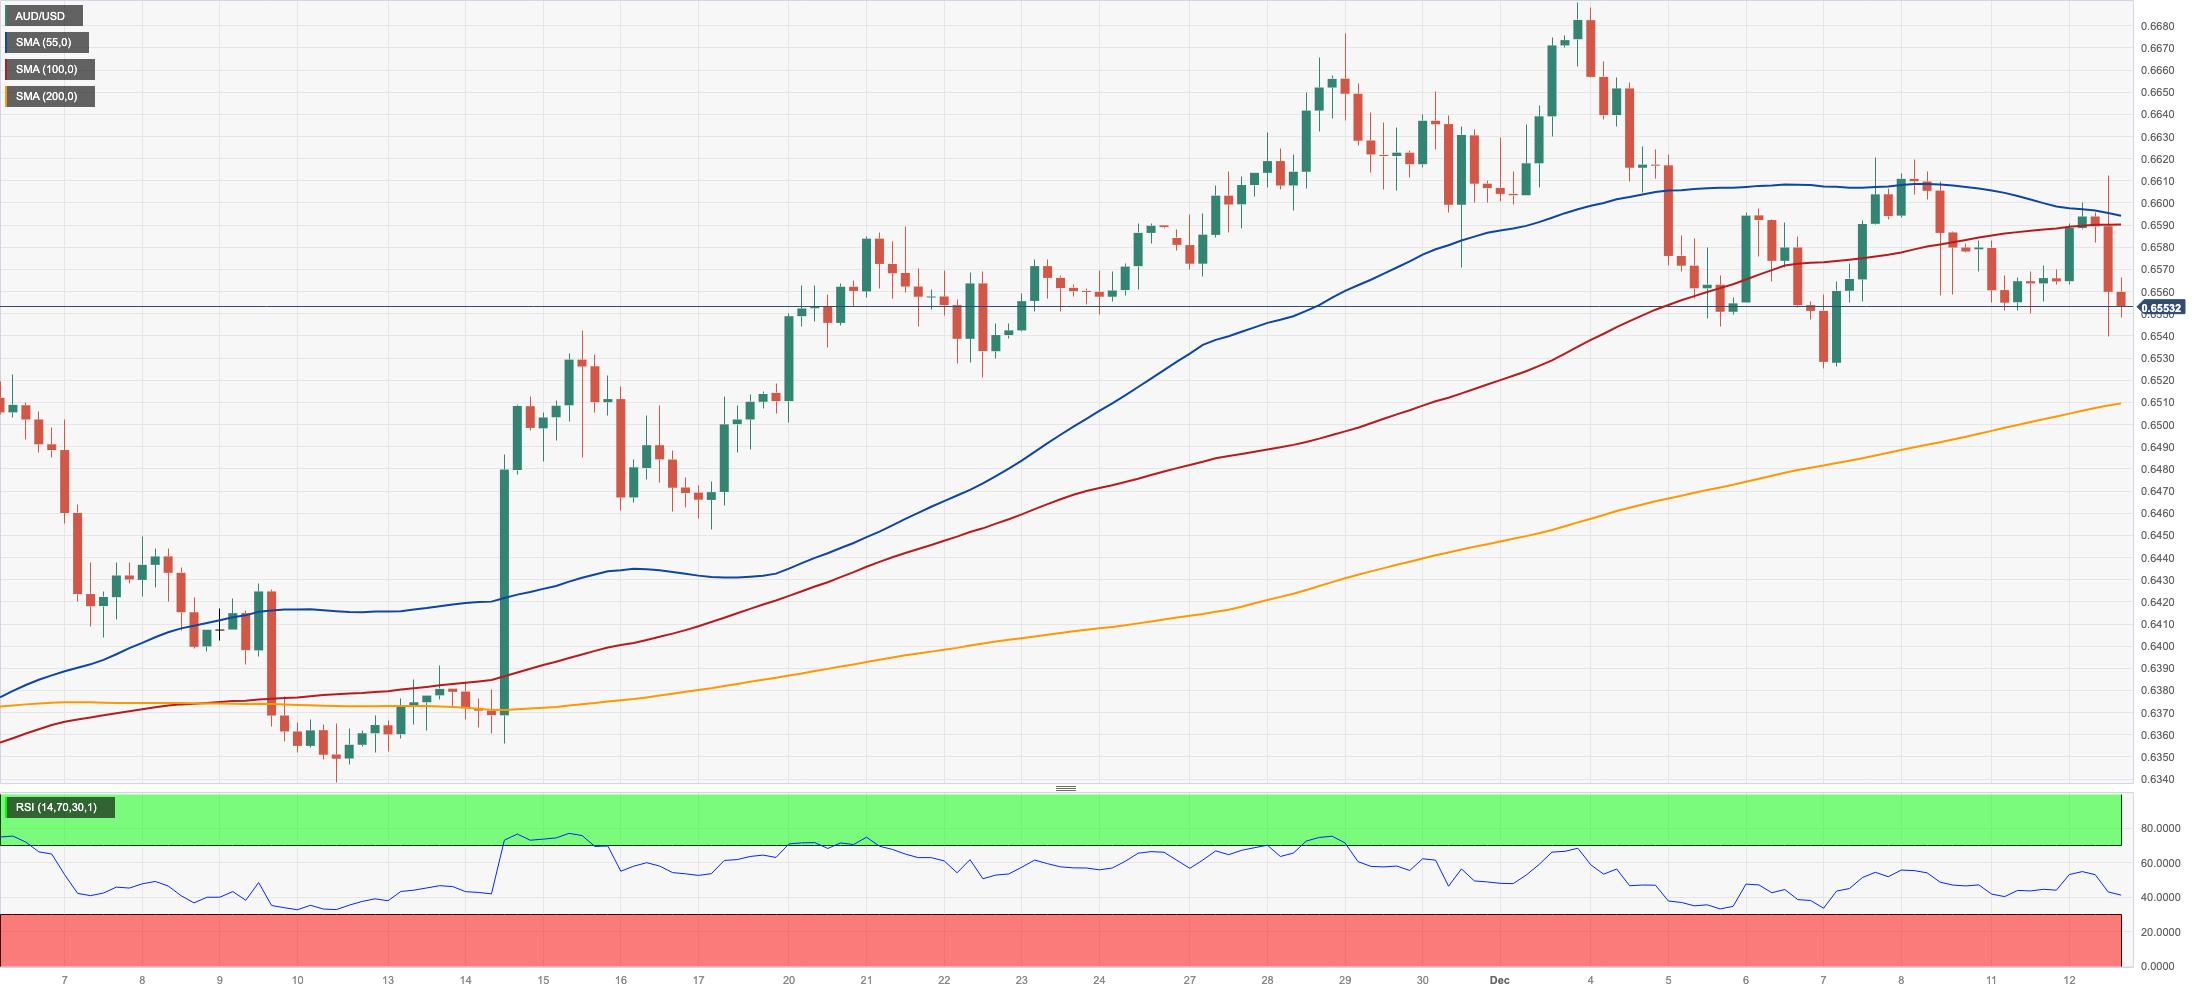
AUD/USD extended further the bearish momentum and revisited the 0.6550/40 band once again on Tuesday, flirting at the same time with the key 200-day SMA around 0.6575.
In the meantime, the pair’s decline appeared unchanged despite the corrective knee-jerk in the greenback, which managed to regain some balance in the wake of the release of US inflation figures, nonetheless.
In addition, the mixed performance of the commodity complex failed to lend some sustainable support to the Aussie dollar after copper prices advanced marginally and iron ore dropped slightly.
Data-wise, in Oz, Westpac’s Consumer Sentiment Index improved to 82.1 for the current month.
If the AUD/USD goes below the December low of 0.6525 (December 7), it may retest the temporary 100-day and 55-day SMAs of 0.6460 and 0.6446, respectively. If the latter is breached, a move to the 2023 bottom of 0.6270 (October 26) before the round level of 0.6200 and the 2022 low of 0.6169 (October 13) might emerge on the horizon. Instead, the next resistance level occurs at the December high of 0.6690 (December 4) prior to the July top of 0.6894 (July 14), which is just ahead of the June peak of 0.6899 (June 16) and the critical 0.7000 level. The daily RSI dropped to the vicinity of 52.
Resistance levels: 0.6620 0.6690 0.6739 (4H chart)
Support levels: 0.6525 0.6452 0.6347 (4H chart)
GOLD
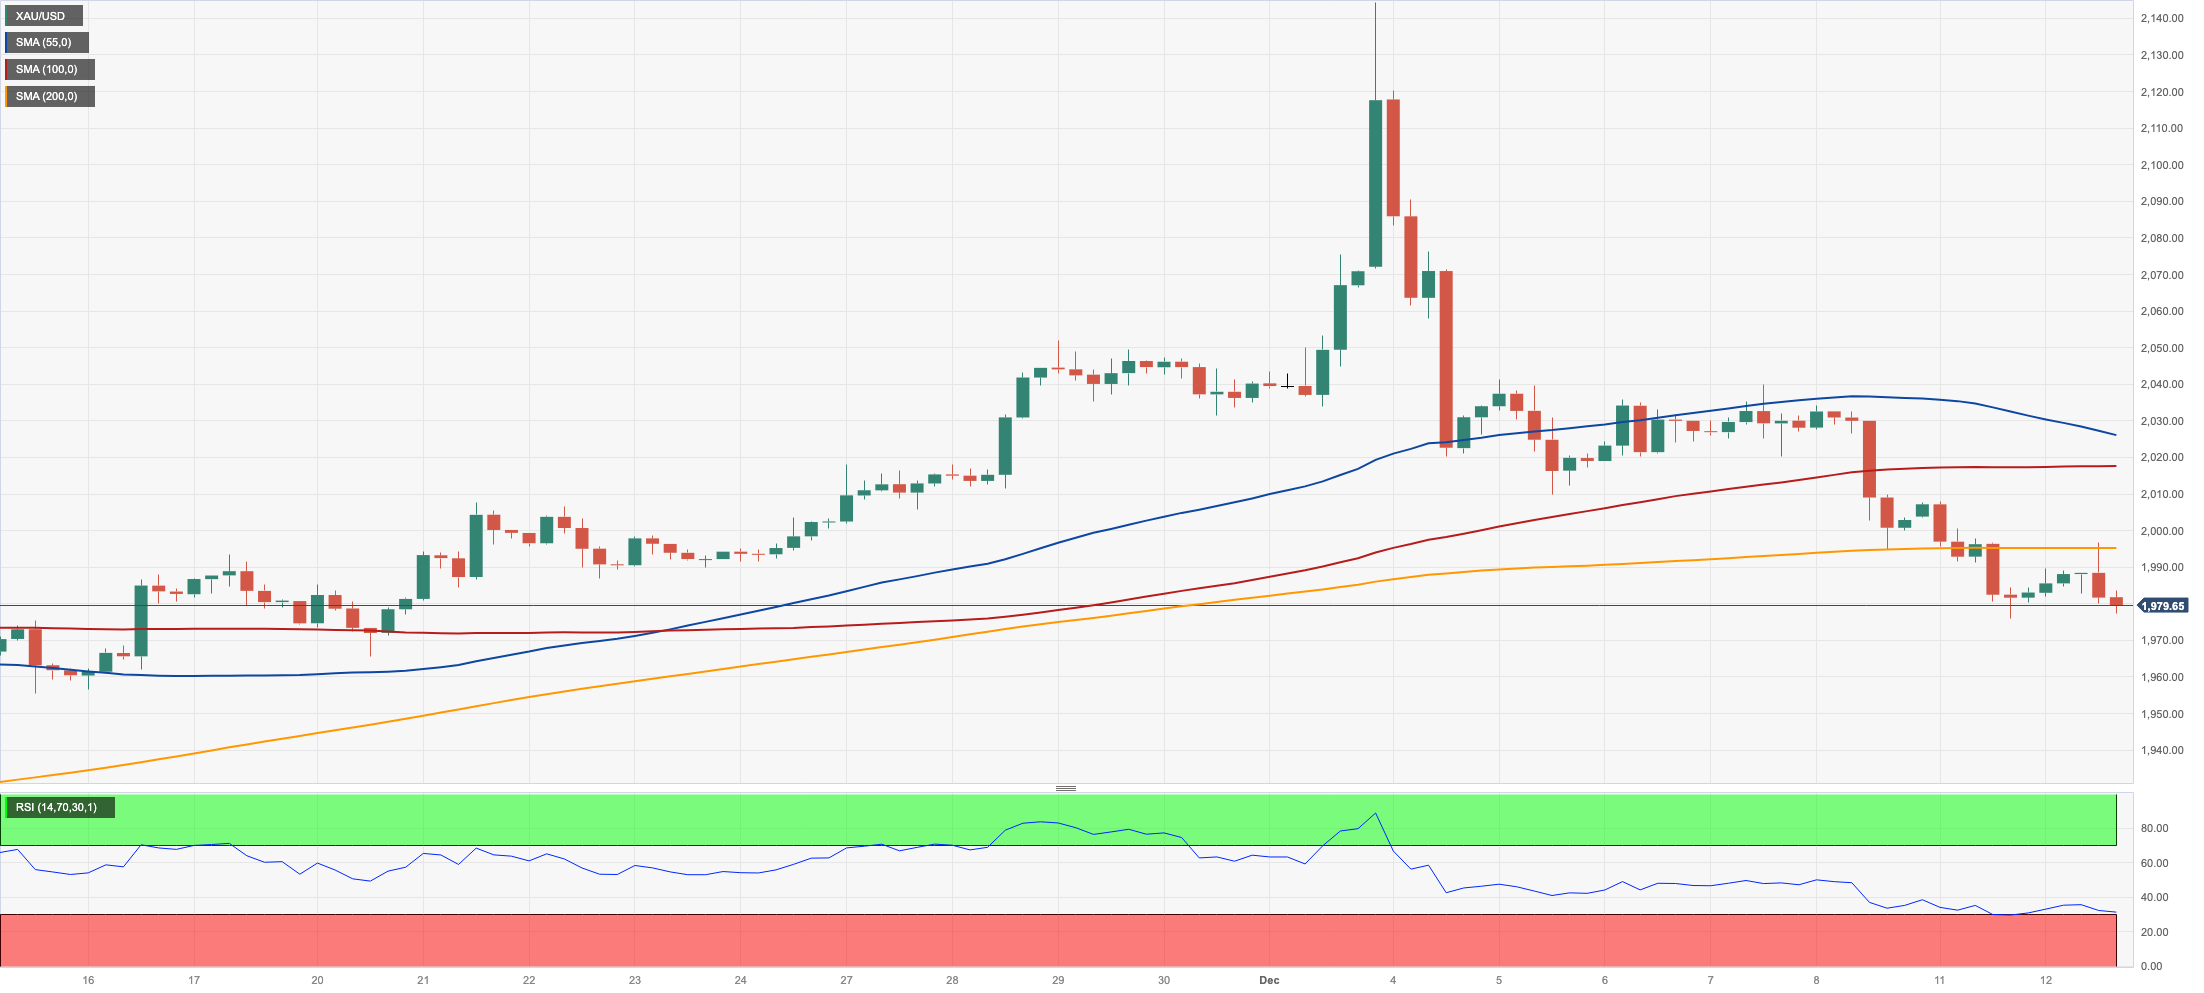
Further weakness saw prices of the yellow metal retreat slightly and revisit the $1980 region per troy ounce on Tuesday.
The daily pullback in bullion came in contrast with the modest decline in the greenback and directionless US yields, all following the release of US inflation figures tracked by the CPI, where headline consumer prices kept the southward trend unchanged vs. persistent stickiness from the core reading.
Later in the week, the precious metal is expected to remain under scrutiny in light of the imminent FOMC gathering, where the Fed is widely anticipated to keep rates on hold.
The potential for additional losses in gold needs to clear the December low of $1975 (December 11). Down from here emerges the crucial 200-day SMA of $1952 before the November low of $1931 (November 13). If this level is breached, the October low of $1810 (October 6) may become relevant, followed by the 2023 low of $1804 (February 28), and then the crucial $1800 contention zone. In case bulls regain the initiative, the immediate target is seen at the all-time high of $2150 (December 4).
Resistance levels: $2016 $2041 $2149 (4H chart)
Support levels: $1975 $1965 $1931 (4H chart)
CRUDE WTI
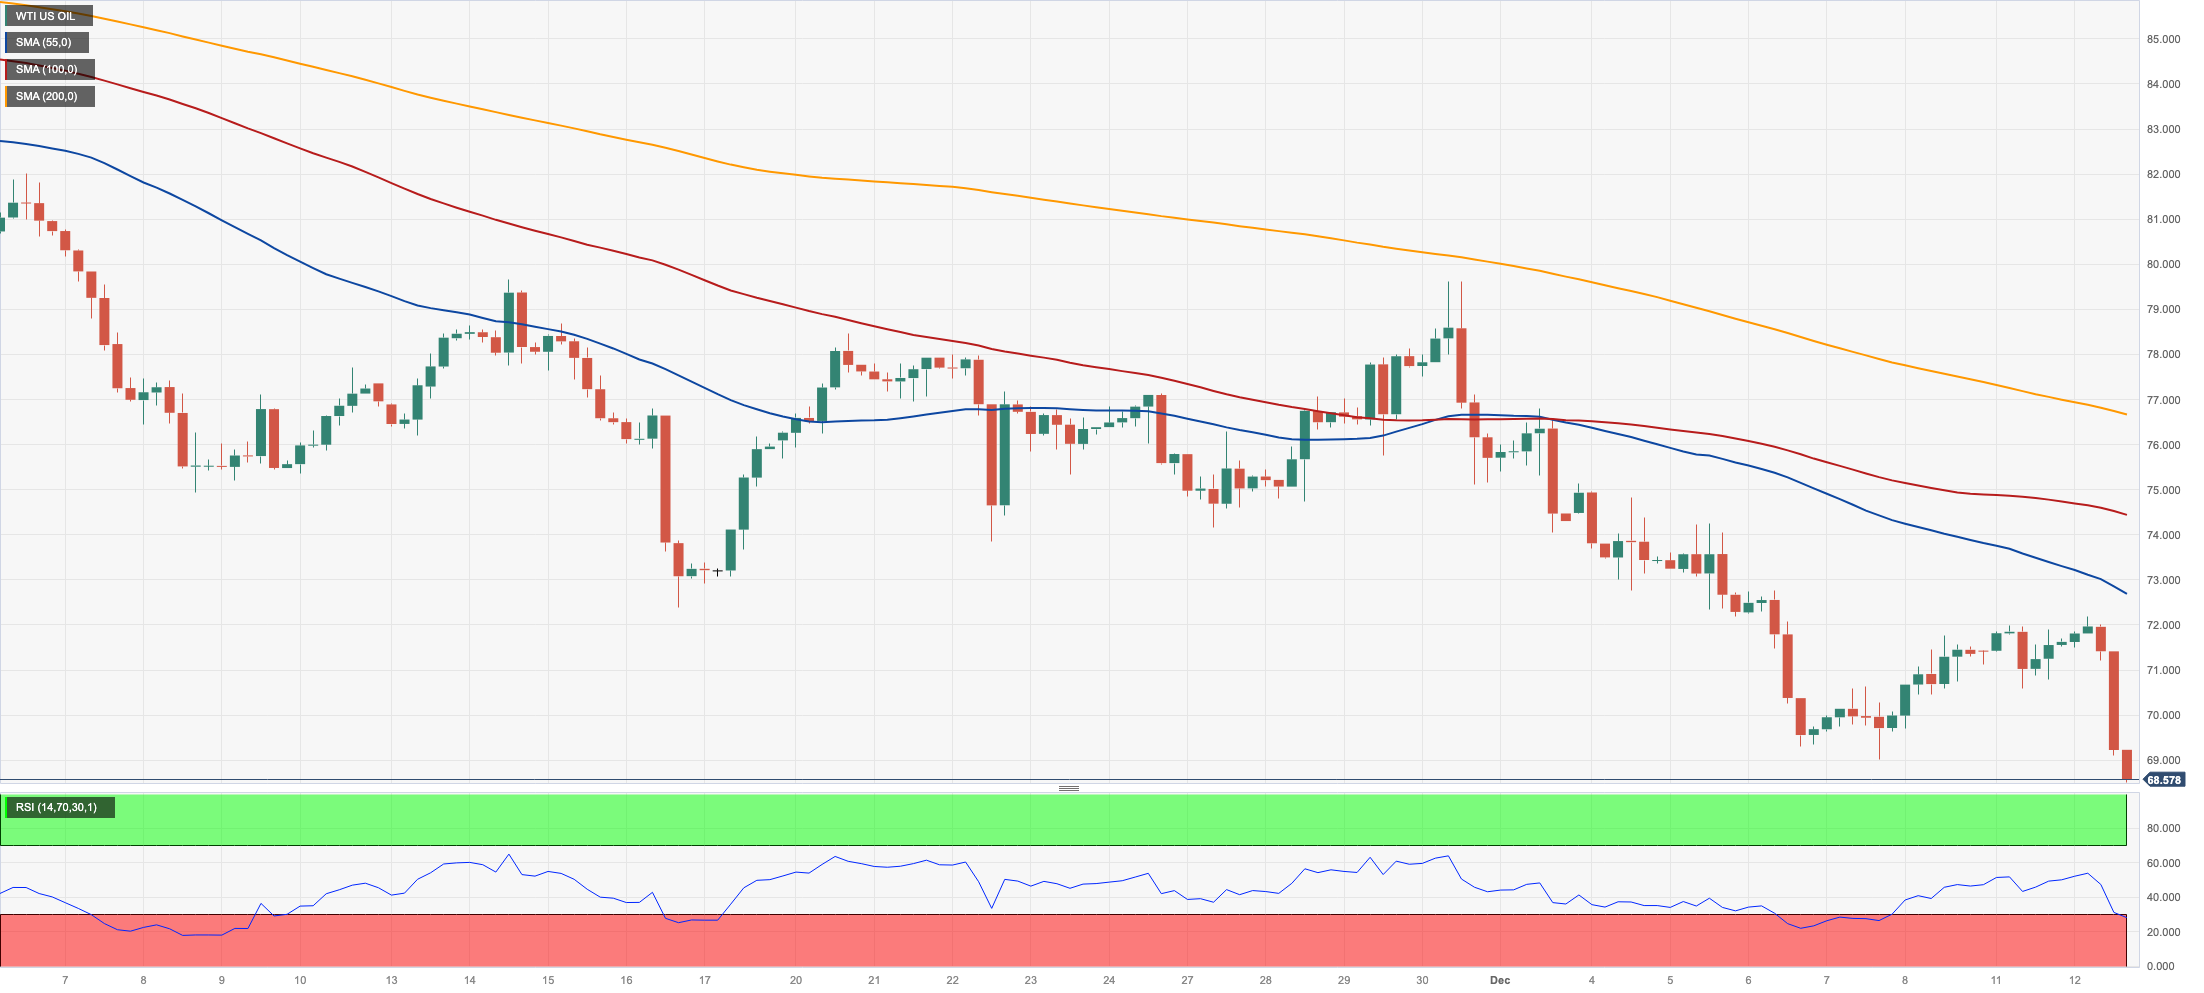
Prices of WTI plummeted to levels last seen in late June near the $68.00 mark per barrel, reversing at the same time a three-day recovery on Tuesday.
As usual in past sessions, sentiment among traders’ remained sour on the back of the oversupply narrative coupled with demand concerns, while the recently published US inflation figures added to worries that the Federal Reserve might keep its restrictive stance for a longer period.
On the geopolitical front, the attack on a Norwegian oil tanker by Iran-backed Houthi rebels did nothing to spark a rebound in the commodity.
If WTI breaks through the December low of $68.27 (December 12), it may dispute the 2023 low of $63.61 (May 4) before reaching the important $60.00 yardstick. Having said that, a break above the 200-day SMA at $77.84, might resurrect a challenge to the important $80.00 level, which would be swiftly followed by the November high of $80.15 (November 3). Further increases from here might restore the market to its weekly top of $89.83 (October 18), seconded by a the 2023 peak of $94.99 (September 28). The August 2022 high of $97.65 (August 30) comes next, followed by the psychological $100.00 mark.
Resistance levels: $71.92 $76.72 $79.56 (4H chart)
Support levels: $68.27 $67.01 $66.77 (4H chart)
DOW JONES
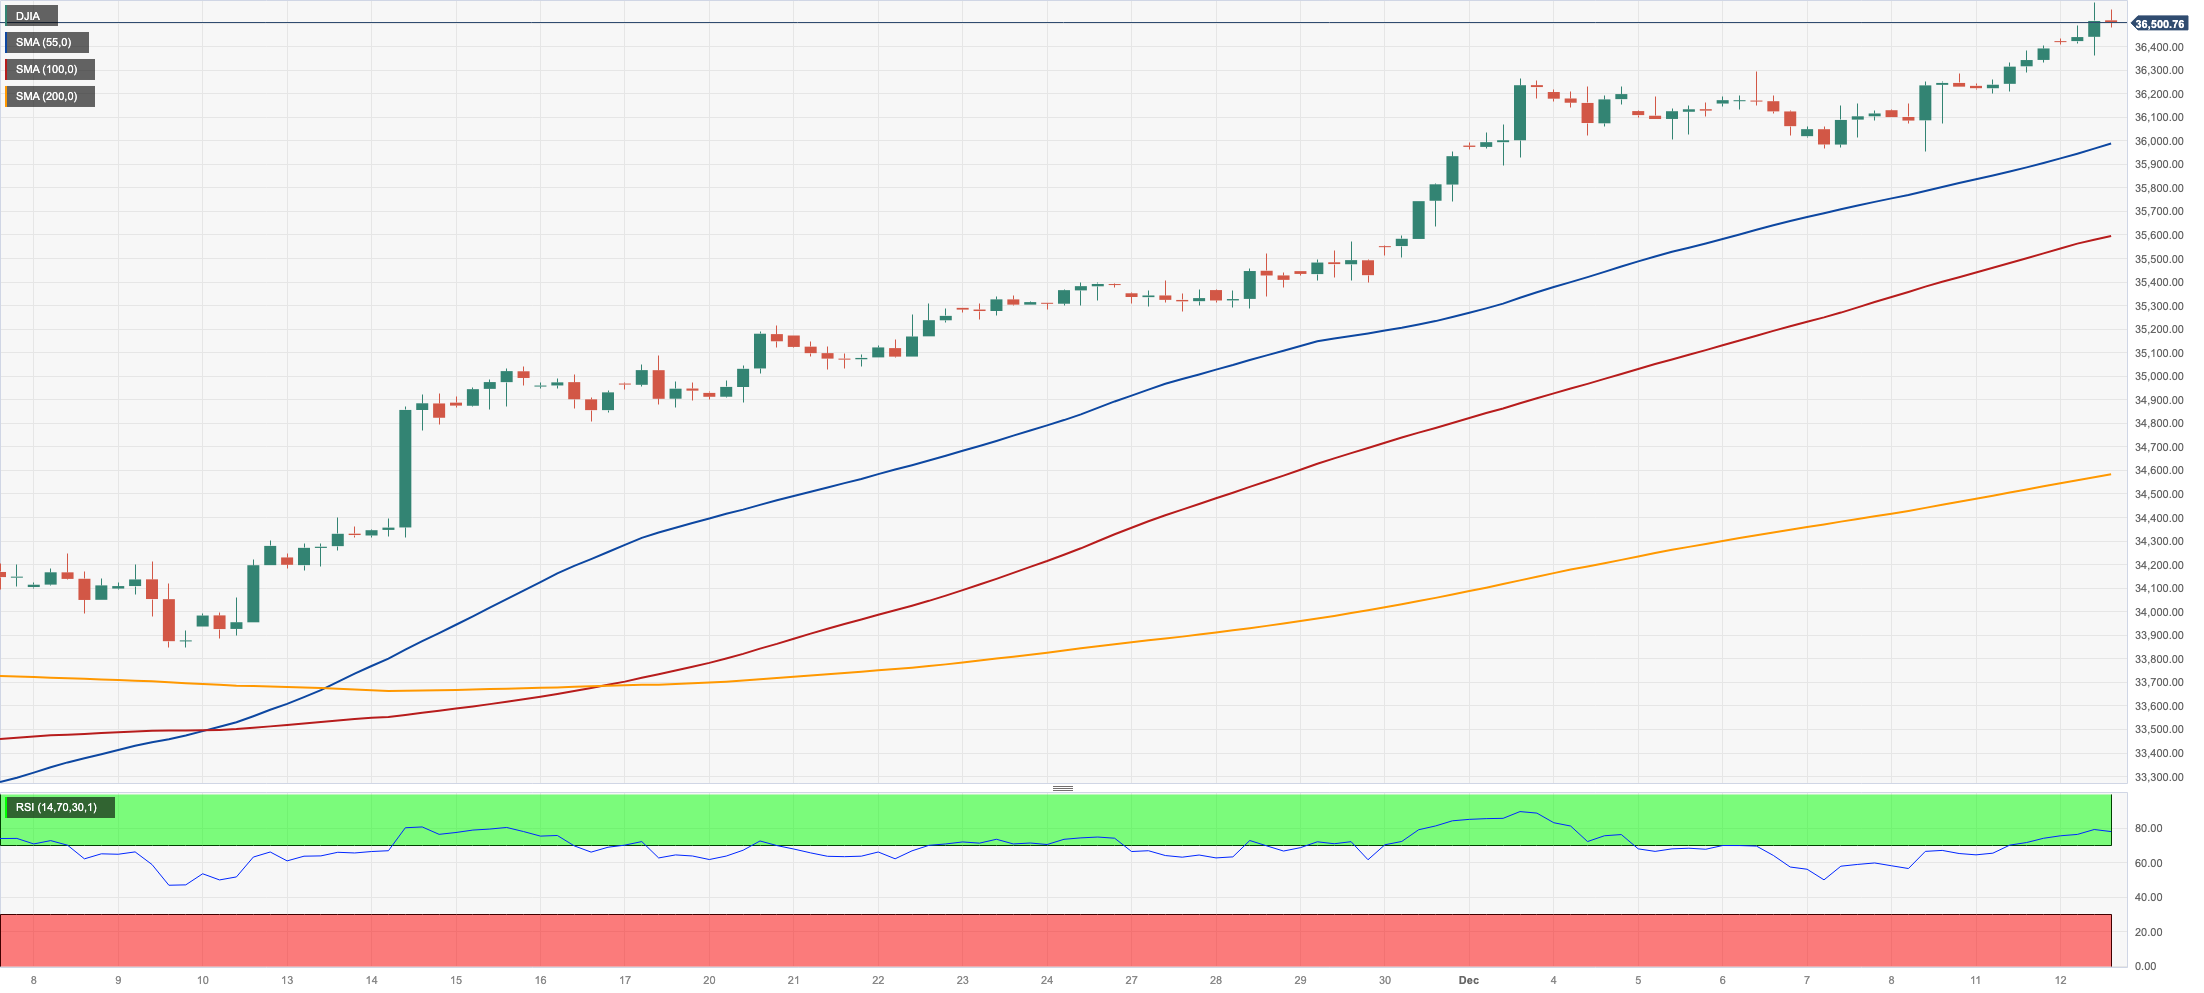
The continuation of the strong upside bias in US stocks led the benchmark Dow Jones to a new YTD peak near the 36600 level on Tuesday.
In light of this price action, the index clinched its third consecutive daily advance and entered its seventh straight week in the positive zone.
In the meantime, investors continued to expect the Fed to leave its interest rates unchanged at its event on Wednesday, a view that appears to have been reinforced by November’s inflation readings published earlier on Tuesday.
On the whole, the Dow Jones rose 0.33% to 36525, the S&P500 advanced 0.19% to 4631, and the tech-reference Nasdaq Composite gained 0.31% to 14476.
If the Dow Jones exceeds the 2023 high of 36567 (December 12), it may reach the all-time top of 36952 (January 5, 2022) before reaching the round level of 37000. On the contrary, the 200-day SMA of 34007 and the weekly low of 33859 should give support (November 7) ahead of the October low of 32327 (October 27). The breakdown of the latter might open the way for a move to the 2023 bottom of 31429 (March 15), which would come before the 2022 low of 28660 (October 13). The daily RSI rose over 79, remaining well in the overbought zone.
Top Performers: Walgreen Boots, Salesforce Inc, American Express
Worst Performers: Chevron, Intel, Dow
Resistance levels: 36567 36952 (4H chart)
Support levels: 35123 34529 33859 (4H chart)
MACROECONOMIC EVENTS

All Information & Updates provided by:

All information relating to the financial markets available on this page has been prepared and issued by FXStreet (Forexstreet SL, Spain, Reg: B62498233) on the basis of publicly available information and all information believed to be reliable and does not conflict with Kuwaiti local laws, and all necessary care has been taken to before the company to ensure that the facts mentioned are correct from the source.
NCM Investment nor any of its directors or employees shall in any way be held responsible for the contents of this news, and the information contained on this page is intended only to provide clients with publicly available information and should not be construed as investment advice, report or analysis and/or constitute an offer or invitation to buy or sell financial instruments of any kind.
RISK WARNING: Forex and CFDs are highly risky leveraged products, as losses can exceed deposits. Please ensure you understand all the risks and take independent advice if necessary. NCM will segregate the clients based on the criteria of the regulator and its bylaws. NCM does not provide any advisory service; the material published does not constitute advice or a recommendation for a transaction in any financial instrument. NCM accepts no responsibility for any use of the content presented and any consequences of that use. Anyone acting on the information provided does so at their own risk.