
- Contact Us:
-

-

-

-


Daily Market Updates
14 Dec 2023
EURUSD
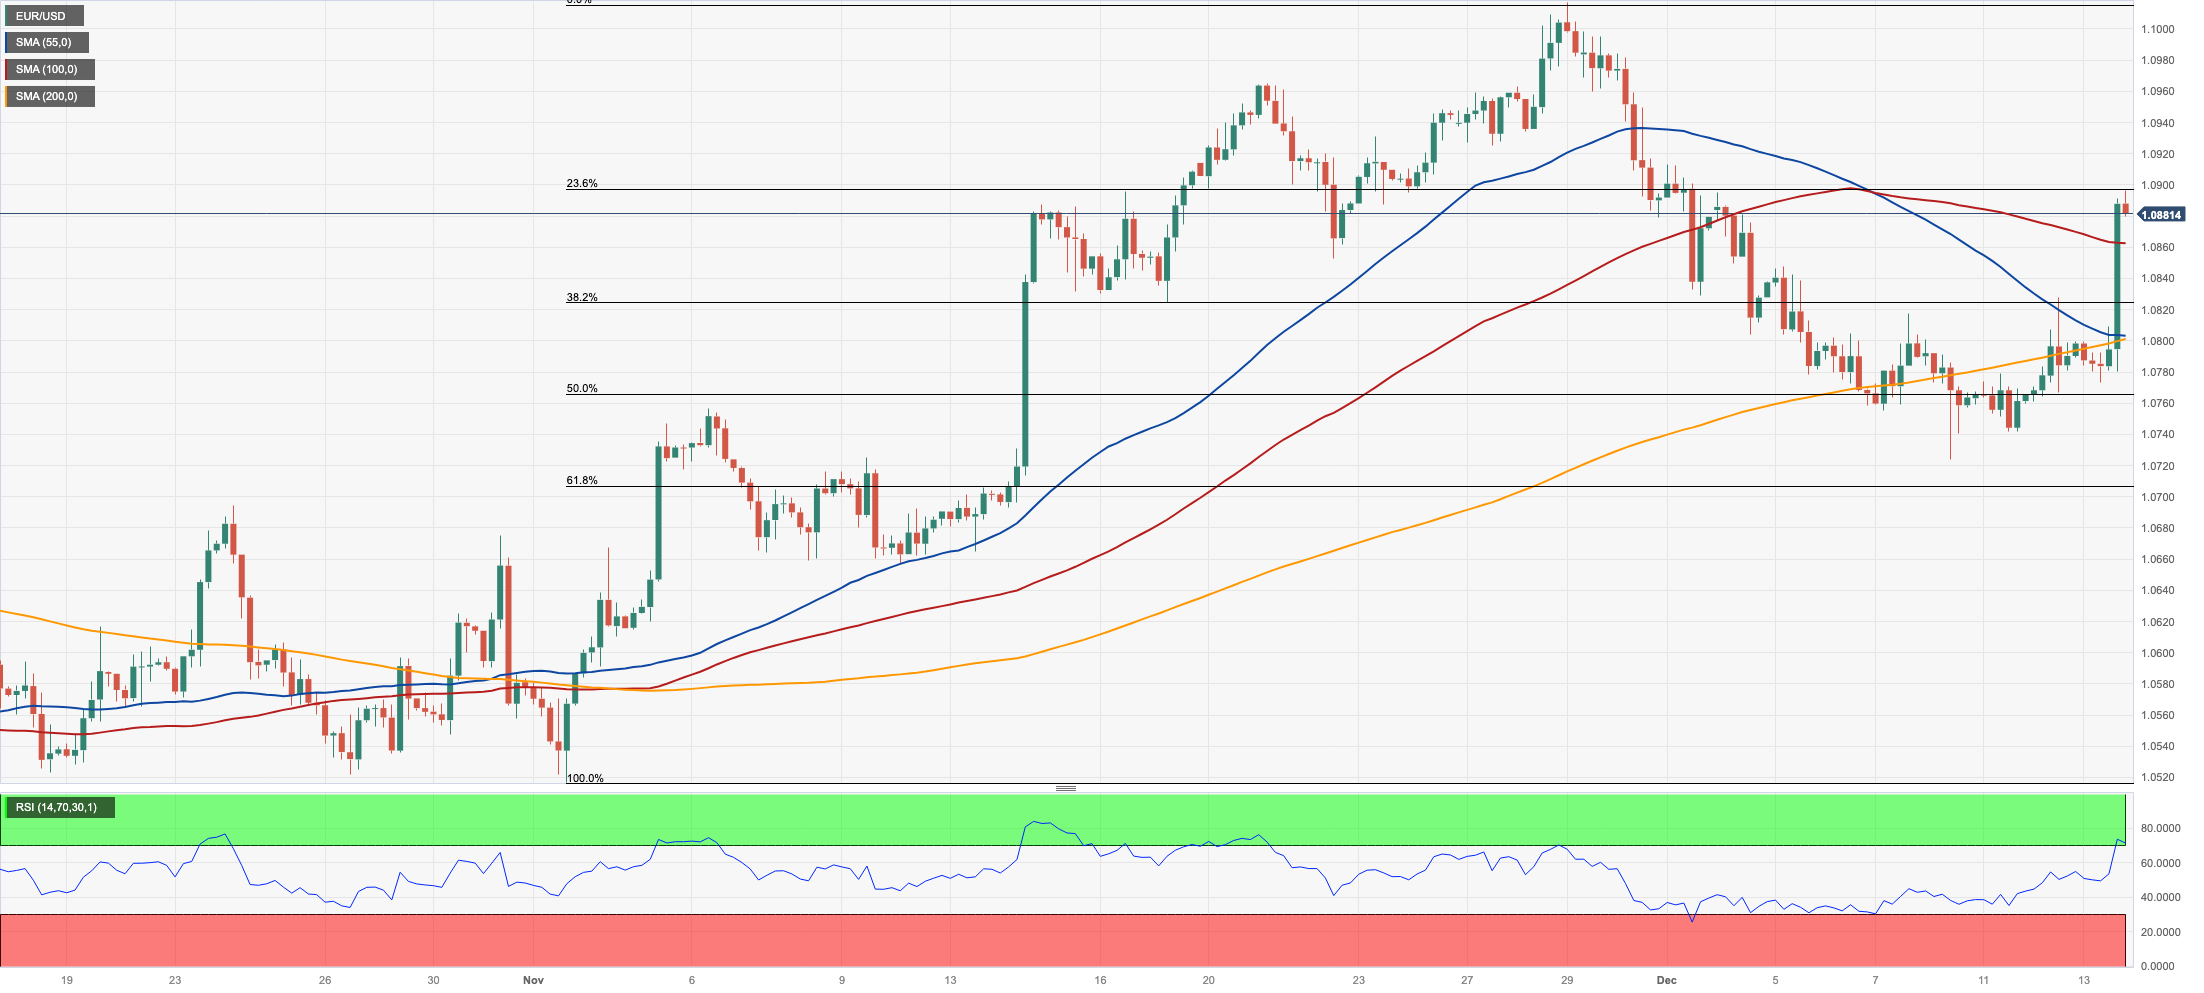
The sharp Fed-driven drop in the greenback sponsored the resumption of the bid bias in EUR/USD, which managed to rapidly approach the 1.0900 hurdle on Wednesday.
On the other side of the coin, the USD Index (DXY) retreated to weekly lows in the sub-103.00 zone in the wake of the dovish hold by the Federal Reserve, all against the backdrop of an intense decline in US yields across different maturities pari passu with rising expectations of an interest rate cut by the Fed in May 2024.
In fact, and as anticipated, the Fed unanimously kept its interest rates unchanged at 5.25%-5.50% at its event on Wednesday. From the statement, the median 2024 growth projection is now at 1.4% (from 1.5%), while inflation is still deemed as elevated. On the latter, the Committee see inflation at 2.4% next year and around the bank’s target in 2026.
Regarding the updated dots plot, officials see the interest rate at 4.6% by end of the next year, 3.6% by end-2025 and 2.9% by end of 2026.
From Powell’s press conference, he mentioned that due to the progress achieved and existing uncertainties, they were being cautious in their approach. He highlighted the tightening labor market, which was gradually finding a more balanced state. Additionally, Powell noted the anticipation that reaching a 2% inflation target would require a considerable amount of time. Despite their belief that the policy rate might be nearing its peak for this particular cycle, he acknowledged past surprises and emphasized their commitment to maintaining a restrictive policy until they were assured of progressing toward the 2% inflation target. Powell emphasized that policymakers were hesitant to rule out the possibility of further rate hikes.
On the data front, Industrial Production in the euro bloc contracted 6.6% YoY in October.
Across the pond, Mortgage Applications rose by 7.4% in the week ended on December 8, while Producer Prices came in flat on a monthly basis in November and rose 0.9% from a year earlier.
Further gains in EUR/USD are now expected to challenge of the November top of 1.1017 (November 29). After that, the August peak of 1.1064 (August 10) and the weekly high of 1.1149 (July 27) are possible, all of which precede the 2023 peak of 1.1275 (July 18). If the pair drops below the December low of 1.0723 (December 8), it will almost surely target the temporary 55-day SMA at 1.0702. The loss of the latter might put a test of the weekly low of 1.0495 (October 13) back on the radar prior to the 2023 low of 1.0448 (October 3) and the round level of 1.0400. The daily RSI improved north of 57.
Resistance levels: 1.0896 1.0912 1.1017 (4H chart)
Support levels: 1.0723 1.0656 1.0516 (4H chart)
USDJPY
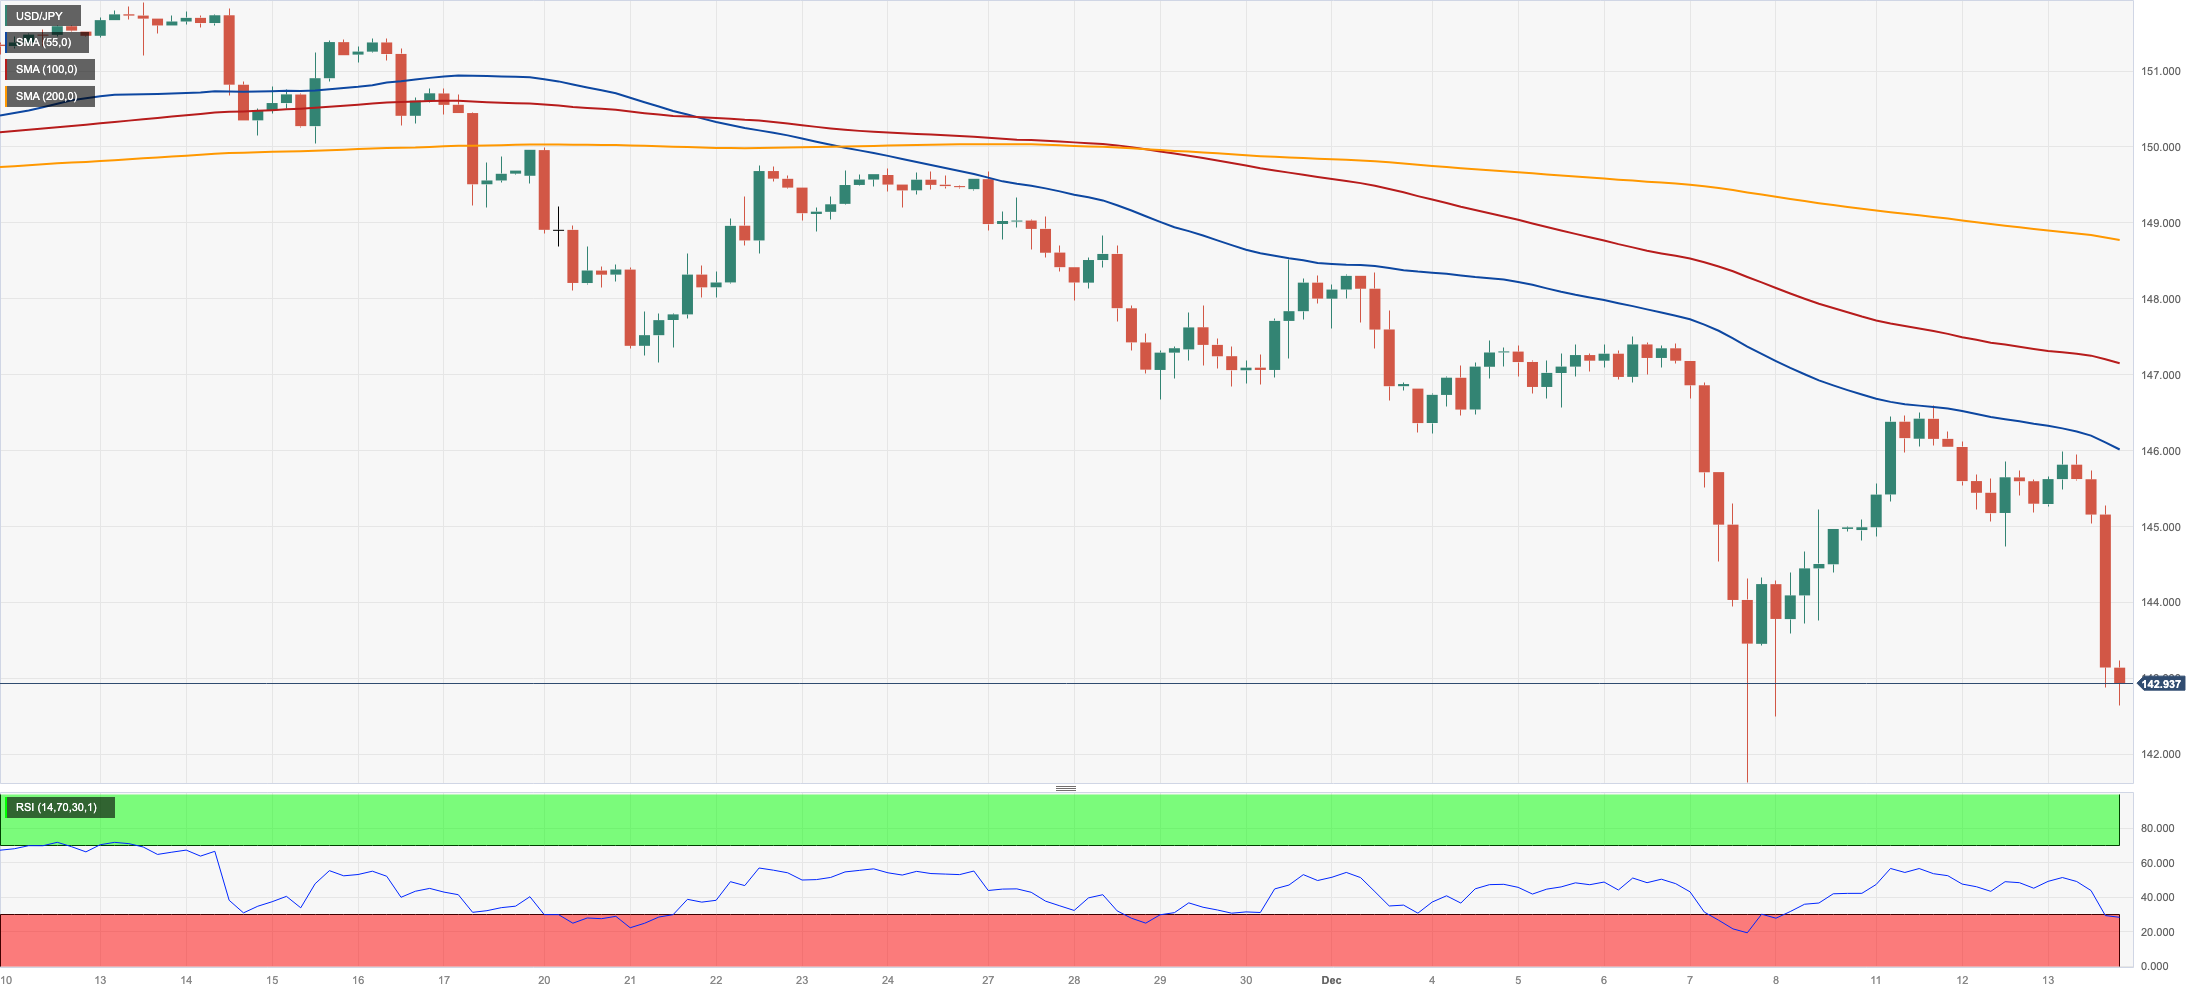
USD/JPY added to Tuesday’s decline and broke below the 143.00 contention zone on Wednesday, or new weekly lows.
The daily retracement in spot came on the back of the intense retracement in the greenback after the Fed widely matched consensus by leaving its interest rates intact, while declining US and Japanese yields also accompanied the move south in the pair.
Furthermore, the Japanese yen derived extra strength from auspicious prints from the Tankan survey for the October–December period. On this, the Tankan Large All Industry Capex increased by 13.4%, the Tankan Large Manufacturers Index improved to 12, the Tankan Large Manufacturing Outlook receded to 8, and the Tankan Large Non-Manufacturing Index climbed to 30.
If sellers seize control, there will be a first conflict zone around the critical 200-day SMA of 142.45, prior to the December low of 141.60 (December 7). The loss of the latter might pave the way for a visit to the August low of 141.50 (August 7), which comes before the July low of 137.23 (July 14). On the other hand, the 55-day SMA at 149.07 is expected to provide transitory resistance ahead of the 2023 high of 151.90 (November 13) and the 2022 top of 151.94 (October 21), all of which are before the round number of 152.00. The RSI deflated to the 31 area.
Resistance levels: 146.58 147.23 148.52 (4H chart)
Support levels: 142.63 141.41 138.05 (4H chart)
GBPUSD
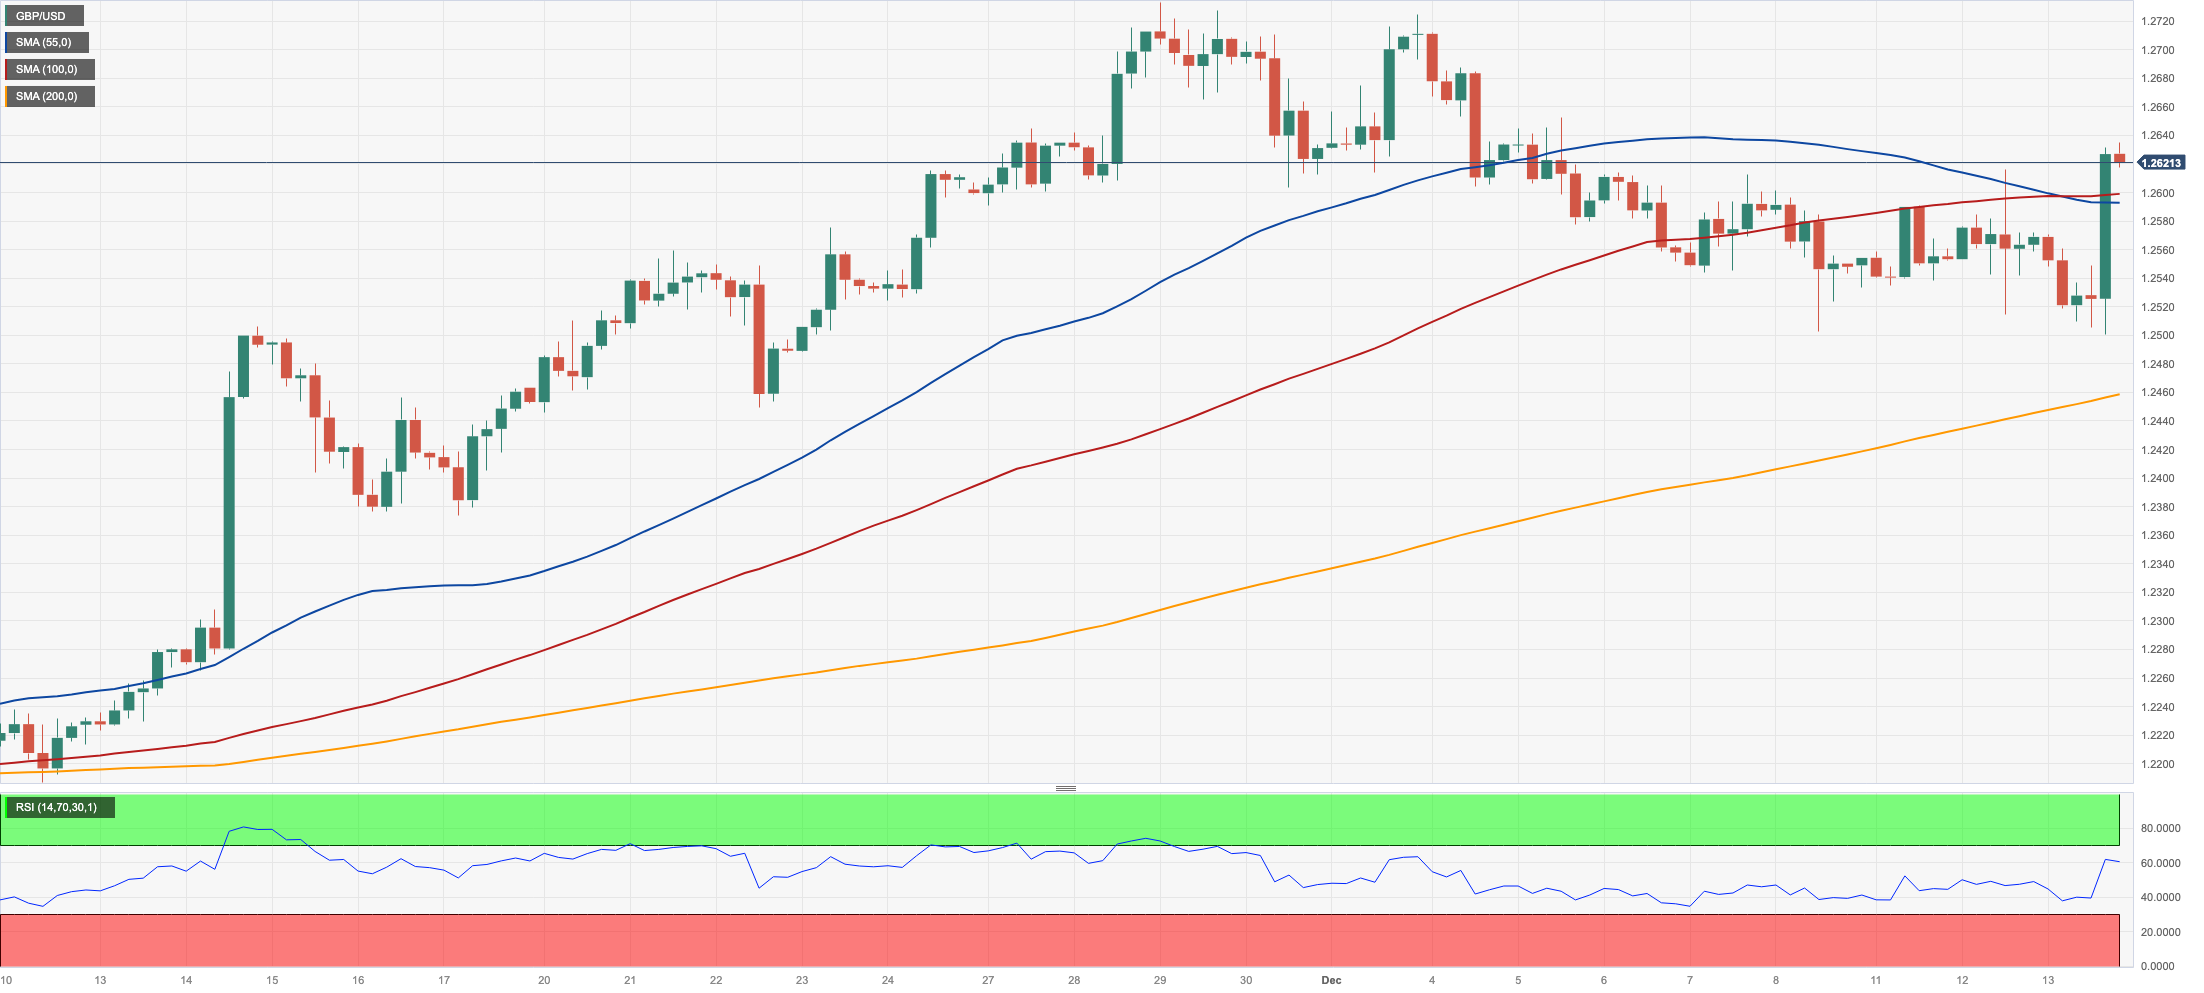
The continuation of the bullish trend around the British pound prompted GBP/USD to add to recent gains and trespass the key 1.2600 the figure midweek.
In fact, Cable gathered renewed upside traction soon after the Fed’s decision to keep rates unchanged ignited a strong sell-off in the dollar, which in turn eroded the initial pessimism surrounding the quid on the back of disheartening prints from the UK docket.
On the latter, UK’s GDP 3-Month Average came in flat in October and the GDP YoY expanded 0.3%. Further results for the month of October saw the trade deficit widen to £17.032B, Construction Output expand 1.1% over the last twelve months, Industrial Production increase by 0.4% YoY and Manufacturing Production gain 0.8% on a yearly basis. Finally, the NIESR Monthly GDP Tracker contracted by 0.1% in November.
The key 200-day SMA at 1.2494 is presently ahead of the interim 55-day SMA at 1.2344 and the weekly low of 1.2187 (November 10). From here, the October low of 1.2037 (October 3), the critical 1.2000 level, and the 2023 bottom of 1.1802 (March 8) are all aligned down. On the contrary, the immediate up-barrier is at the November peak of 1.2733 (November 29) seconded by weekly highs of 1.2746 (August 30), 1.2818 (August 10), and 1.2995 (July 27), all ahead of the crucial 1.3000 hurdle. The daily RSI advanced north of the 59 level.
Resistance levels: 1.2634 1.2715 1.2733 (4H chart)
Support levels: 1.2502 1.2448 1.2373 (4H chart)
AUDUSD
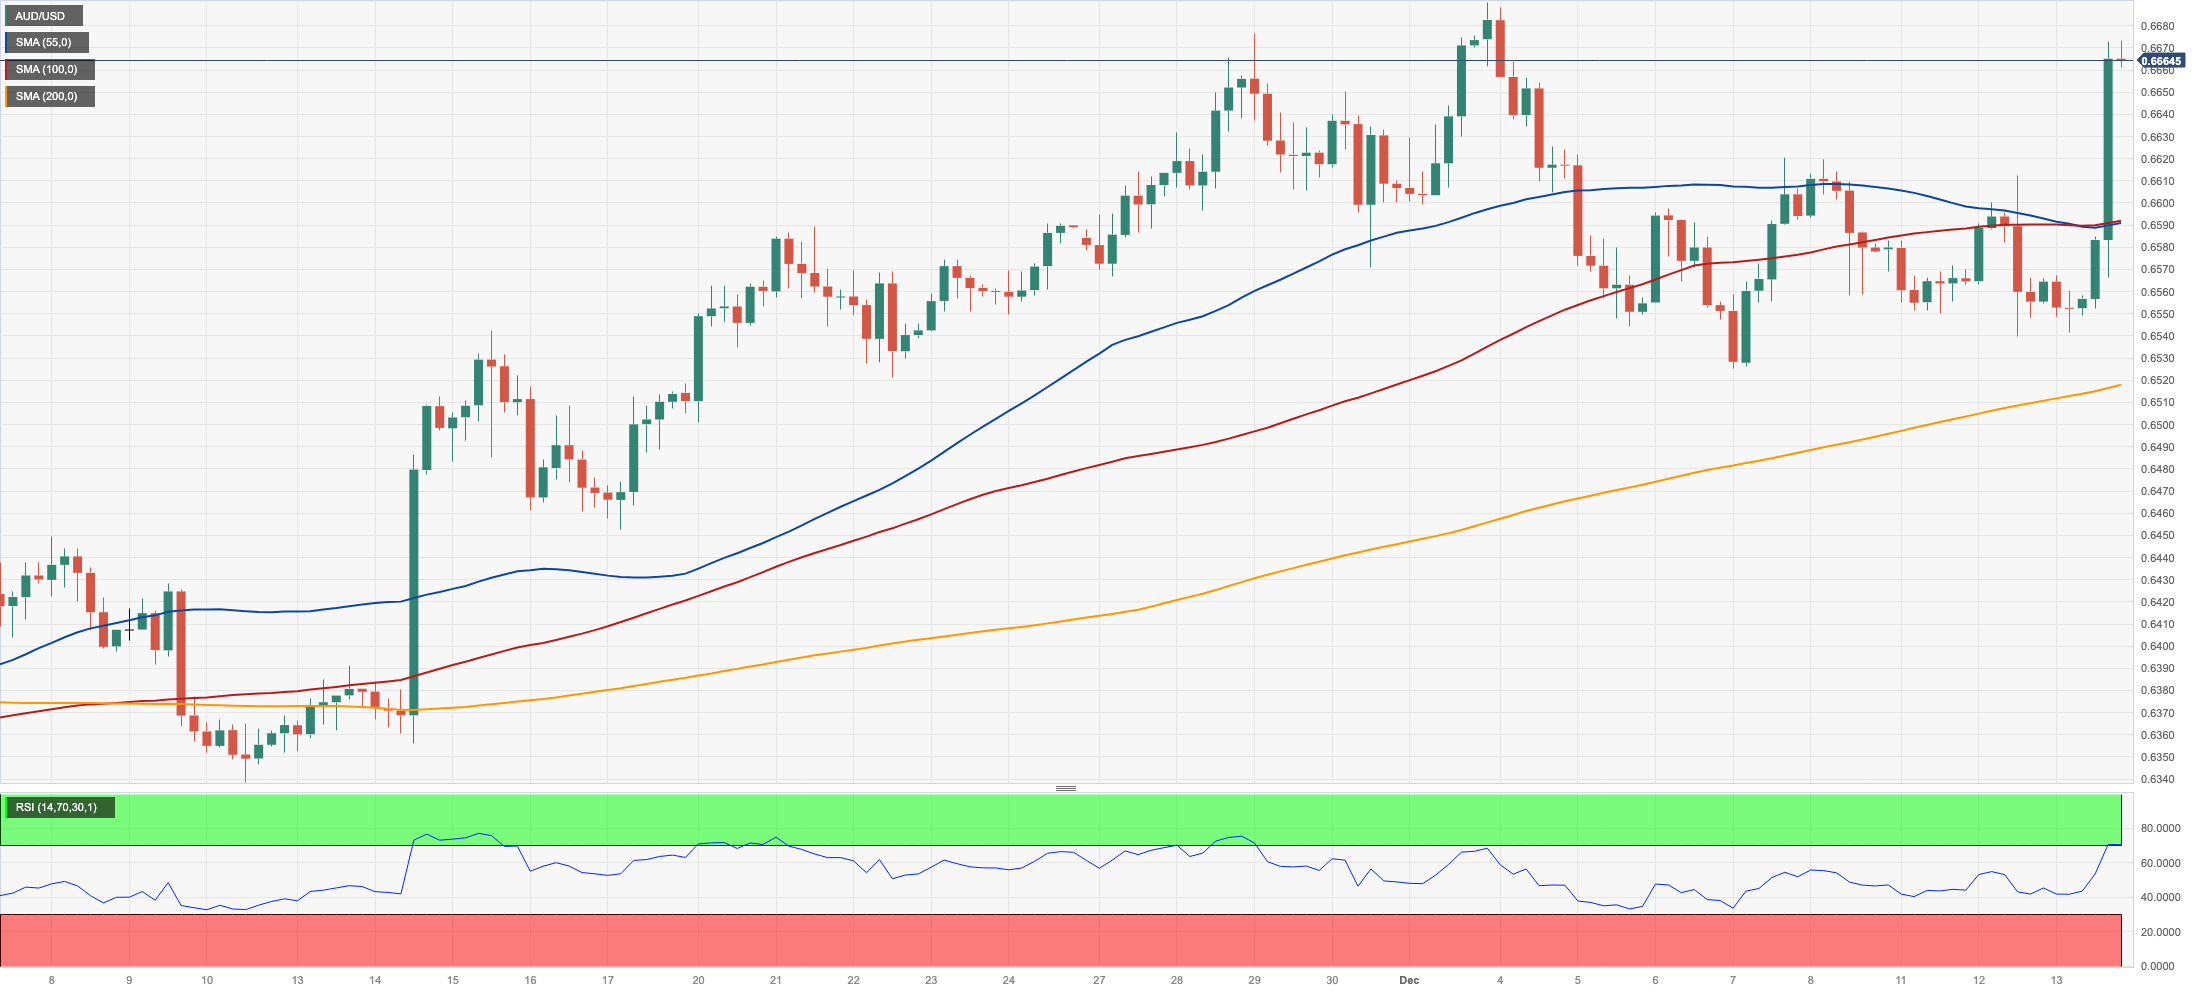
Following three consecutive daily pullbacks, AUD/USD managed to chart a robust comeback, exceeding the key 0.6600 hurdle to print multi-day highs on Wednesday.
The pair’s uptick was in tandem with the marked decline in the greenback, while the continuation of the rally in prices of iron ore appeared to have bolstered the Aussie dollar amidst the otherwise mixed tone in the broader commodity complex.
There were no data releases scheduled in Australia on Wednesday.
If the AUD/USD falls below the December low of 0.6525 (December 7), it may retest the interim 100-day and 55-day SMAs of 0.6458 and 0.6451, respectively. The breakdown of the latter could allow for a move to the 2023 bottom of 0.6270 (October 26) before the round level of 0.6200 and the 2022 low of 0.6169 (October 13). Instead, the next resistance level is at the December top of 0.6690 (December 4), which is just ahead of the July peak of 0.6894 (July 14), and the June high of 0.6899 (June 16), all prior to the significant 0.7000 threshold. The daily RSI rose past the 62 yardstick.
Resistance levels: 0.6673 0.6690 0.6739 (4H chart)
Support levels: 0.6525 0.6452 0.6347 (4H chart)
GOLD
Gold prices attempted a firm recovery and reclaimed the area above the critical $2000 region per troy ounce on Wednesday, bouncing off recent lows near $1970.
Strong gains in the precious metal came amidst an intense drop in the greenback and an equally strong decline in US yields, all after the Federal Reserve kept its interest rates unchanged at its event earlier in the session, as largely anticipated.
Still around the Fed, Chair Powell mentioned that their ongoing focus revolved around assessing whether the rates had reached an adequate level. He indicated that further rate hikes were improbable. Additionally, policymakers were deliberating and discussing the timing for a potential rate cut.
Further weakness in gold faces an immediate contention at the December low of $1973 (December 13). Once this region is cleared, the precious metal could embark on a probable visit to the key 200-day SMA of $1952 and the November low of $1931 (November 13). If this level is breached, the October low of $1810 (October 6) may become significant, followed by the 2023 bottom of $1804 (February 28), and finally the critical $1800 contention zone. If the bulls retake control, the immediate goal is the all-time top of $2150 (December 4).
Resistance levels: $2021 $2041 $2149 (4H chart)
Support levels: $1973 $1965 $1931 (4H chart)
CRUDE WTI
WTI prices managed to regain some balance and flirted with the key $70.00 mark per barrel soon after hitting a new six-month low near $67.70 on Wednesday.
In fact, crude oil prices charted marked gains on the back of a larger-than-expected drop in US crude oil supplies, as reported by the EIA for the week ended on December 8. In addition, the strong decline in the greenback and the dovish tilt at the Fed’s event added to the recovery in the commodity.
Also helping crude oil prices gain some strength resurged geopolitical concerns in response to another attack on an oil tanker in the Red Sea, which further reinforced the case of potential supply disruptions.
Back to the EIA, the agency reported that US crude oil inventories dropped by 4.259M barrels, while supplies at Cushing increased by 1.228M barrels, Weekly Distillate Stocks went up by 1.494M barrels and gasoline stockpiles climbed by 0.408M barrels.
If WTI breaches the December low of $67.74 (December 13), it may confront the 2023 bottom of $63.61 (May 4) before hitting the critical $60.00 threshold. The other way around, a break above the 200-day SMA at $77.78 might reignite a challenge to the crucial $80.00 level, which would be quickly followed by the November high of $80.15 (November 3). Further gains from here might return the market to its weekly top of $89.83 (October 18), seconded by the 2023 peak of $94.99 (September 28). Further up aligns the August 2022 high of $97.65 (August 30), before the psychological $100.00 threshold.
Resistance levels: $71.92 $76.72 $79.56 (4H chart)
Support levels: $67.68 $67.01 $66.77 (4H chart)
DOW JONES
Further gains propelled the US benchmark Dow Jones to a new all-time peak past the key 37000 threshold on Wednesday.
Indeed, the blue-chip accelerated its uptrend after the Fed left the key FFTR unchanged within the 5.25% to 5.5% band at its gathering.
In addition, policymakers projected lowering rates on three occasions during 2024, a more dovish guidance than previously relayed to the public. The revisions signaled a potential easing of the restrictive policy stance should economic conditions warrant such action in the coming year.
All in all, the Dow Jones gained 1.15% to 36998, the S&P500 rose 1.14% to 4697, and the tech-benchmark Nasdaq Composite advanced 1.11% to 14695.
The Dow Jones clinched a new record high of 37057 on December 13. On the downside, the 200-day SMA of 34029 emerges as the immediate support prior to the weekly low of 33859 (November 7). Once the latter is cleared, a potential test of the October low of 32327 (October 27) could return to the radar ahead of the 2023 low of 31429 (March 15) and the 2022 low of 28660 (October 13). The daily RSI increased past 83, indicating that the market is still severely overbought.
Top Performers: Walgreen Boots, Home Depot, Goldman Sachs
Worst Performers: Verizon, IBM, J&J
Resistance levels: 37057 (4H chart)
Support levels: 35291 34549 33859 (4H chart)
MACROECONOMIC EVENTS
All Information & Updates provided by:

All information relating to the financial markets available on this page has been prepared and issued by FXStreet (Forexstreet SL, Spain, Reg: B62498233) on the basis of publicly available information and all information believed to be reliable and does not conflict with Kuwaiti local laws, and all necessary care has been taken to before the company to ensure that the facts mentioned are correct from the source.
NCM Investment nor any of its directors or employees shall in any way be held responsible for the contents of this news, and the information contained on this page is intended only to provide clients with publicly available information and should not be construed as investment advice, report or analysis and/or constitute an offer or invitation to buy or sell financial instruments of any kind.
RISK WARNING: Forex and CFDs are highly risky leveraged products, as losses can exceed deposits. Please ensure you understand all the risks and take independent advice if necessary. NCM will segregate the clients based on the criteria of the regulator and its bylaws. NCM does not provide any advisory service; the material published does not constitute advice or a recommendation for a transaction in any financial instrument. NCM accepts no responsibility for any use of the content presented and any consequences of that use. Anyone acting on the information provided does so at their own risk.