
- Contact Us:
-

-

-

-


Daily Market Updates
15 Dec 2023
EURUSD
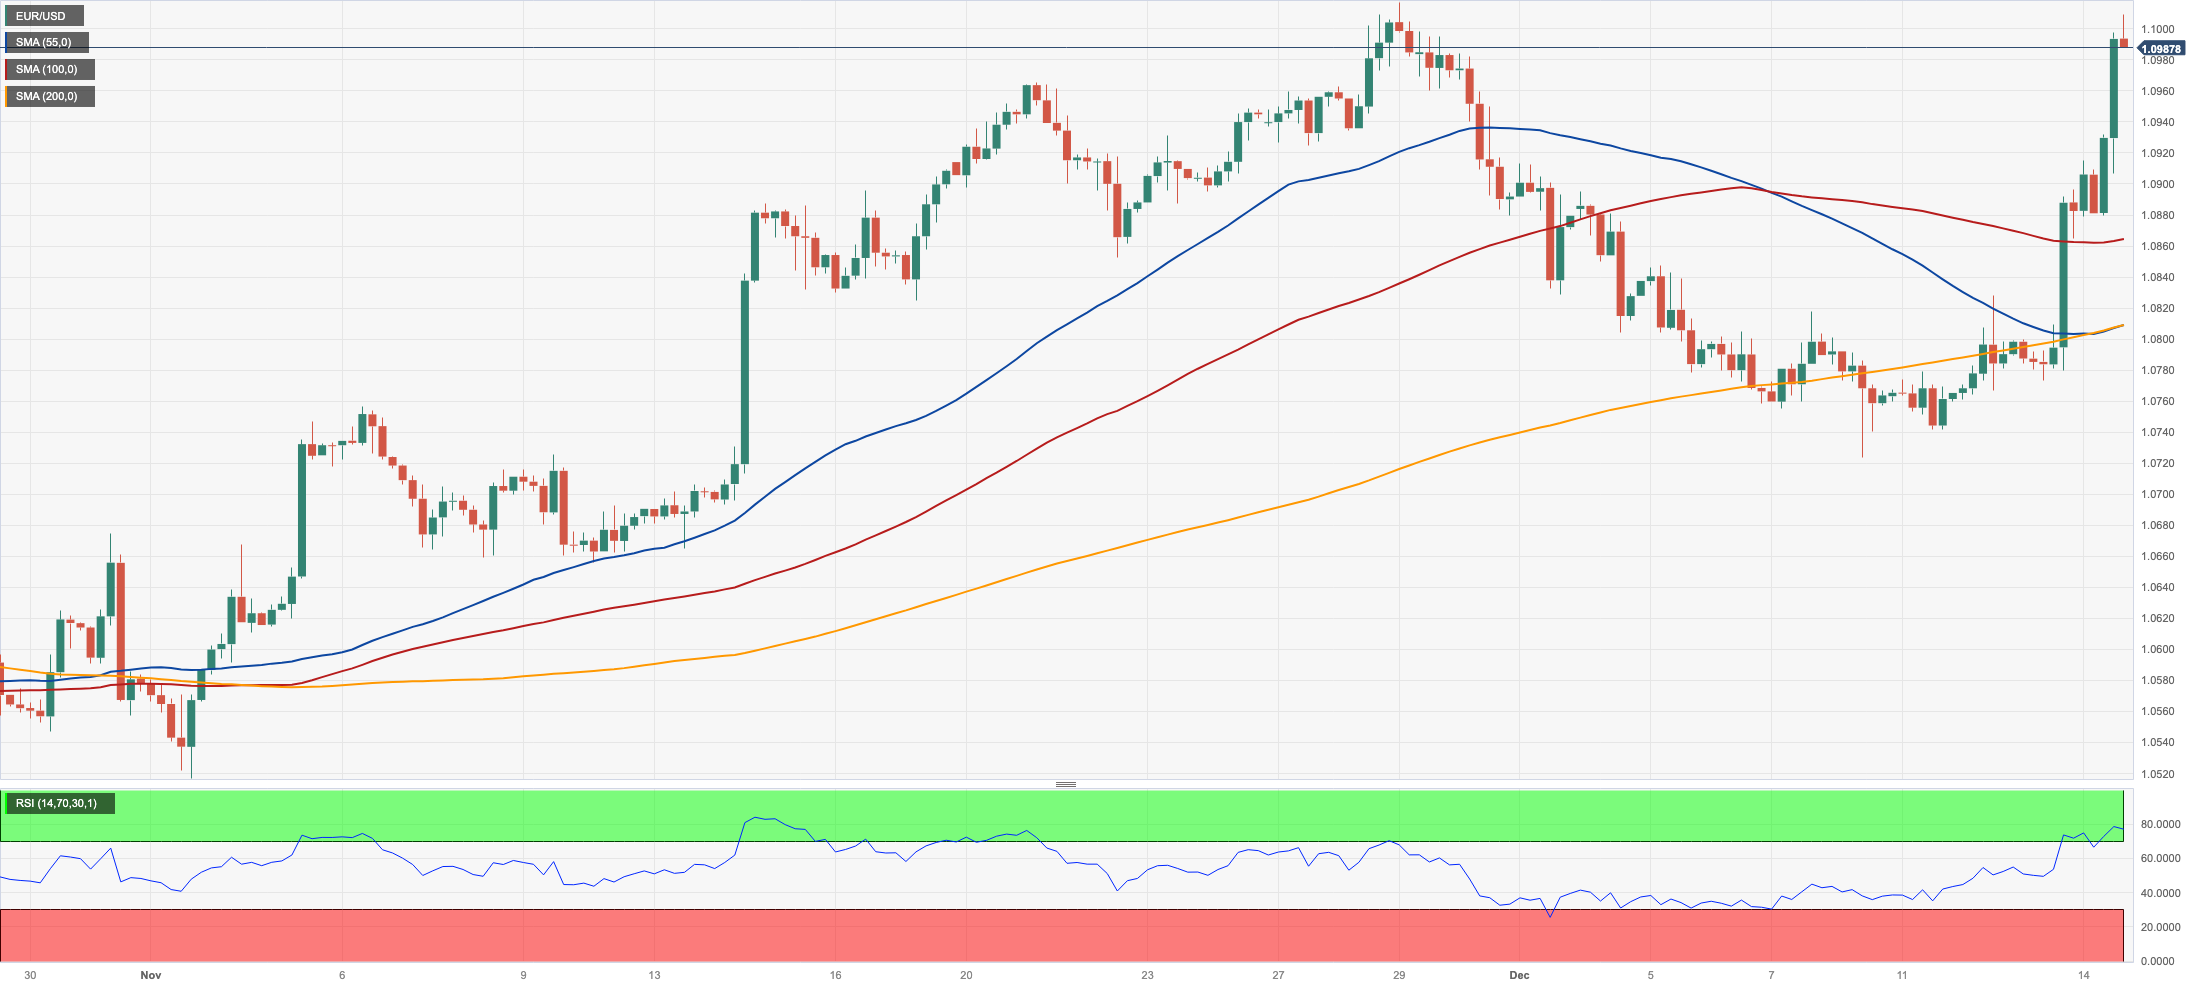
The march north in EUR/USD remained unabated on Thursday, when the pair managed to revisit the area beyond the psychological 1.1000 barrier. Indeed, gains in the European currency accelerated in the wake of the slightly hawkish tilt at the ECB gathering past midday on the old continent.
On the latter, as widely anticipated, the ECB maintained its policy rates today, keeping the deposit rate at 4.00%. The significant change announced was regarding the pace of PEPP reinvestments in 2024, which will now decrease to an average of €15B per month during the latter half of the next year, ultimately ceasing entirely by year-end. While this reduction in PEPP reinvestments in the second half of 2024 leans slightly towards a more hawkish stance, this was somewhat balanced by downward adjustments to growth and inflation forecasts.
At her subsequent press conference, President C. Lagarde resisted expectations for early rate cuts, contributing to the strengthening of the EUR.
Against this backdrop, the greenback plummeted markedly and briefly pierced the key contention zone at 102.00 when tracked by the USD Index (DXY) for the first time since early August, amidst the persistent weakness in US yields across the curve.
On the US docket, Retail Sales expanded at a monthly 0.3% in November, while usual weekly Initial Claims increased by 202K in the week to December 9, and Business Inventories contracted by 0.1% in October vs. the previous month.
Further EUR/USD increases are now projected to target the November high of 1.1017 (November 29). The August top of 1.1064 (August 10) and the weekly peak of 1.1149 (July 27) are both feasible after that, all of which precede the 2023 high of 1.1275 (July 18). Having said that, if the pair falls below the December low of 1.0723 (December 8), it will almost certainly target the interim 55-day SMA of 1.0711. The loss of the latter might reintroduce a challenge of the weekly low of 1.0495 (October 13) before the 2023 low of 1.0448 (October 3) and the round level of 1.0400. The daily RSI improved past 65.
Resistance levels: 1.1009 1.1017 1.1064 (4H chart)
Support levels: 1.0802 1.0723 1.0656 (4H chart)
USDJPY
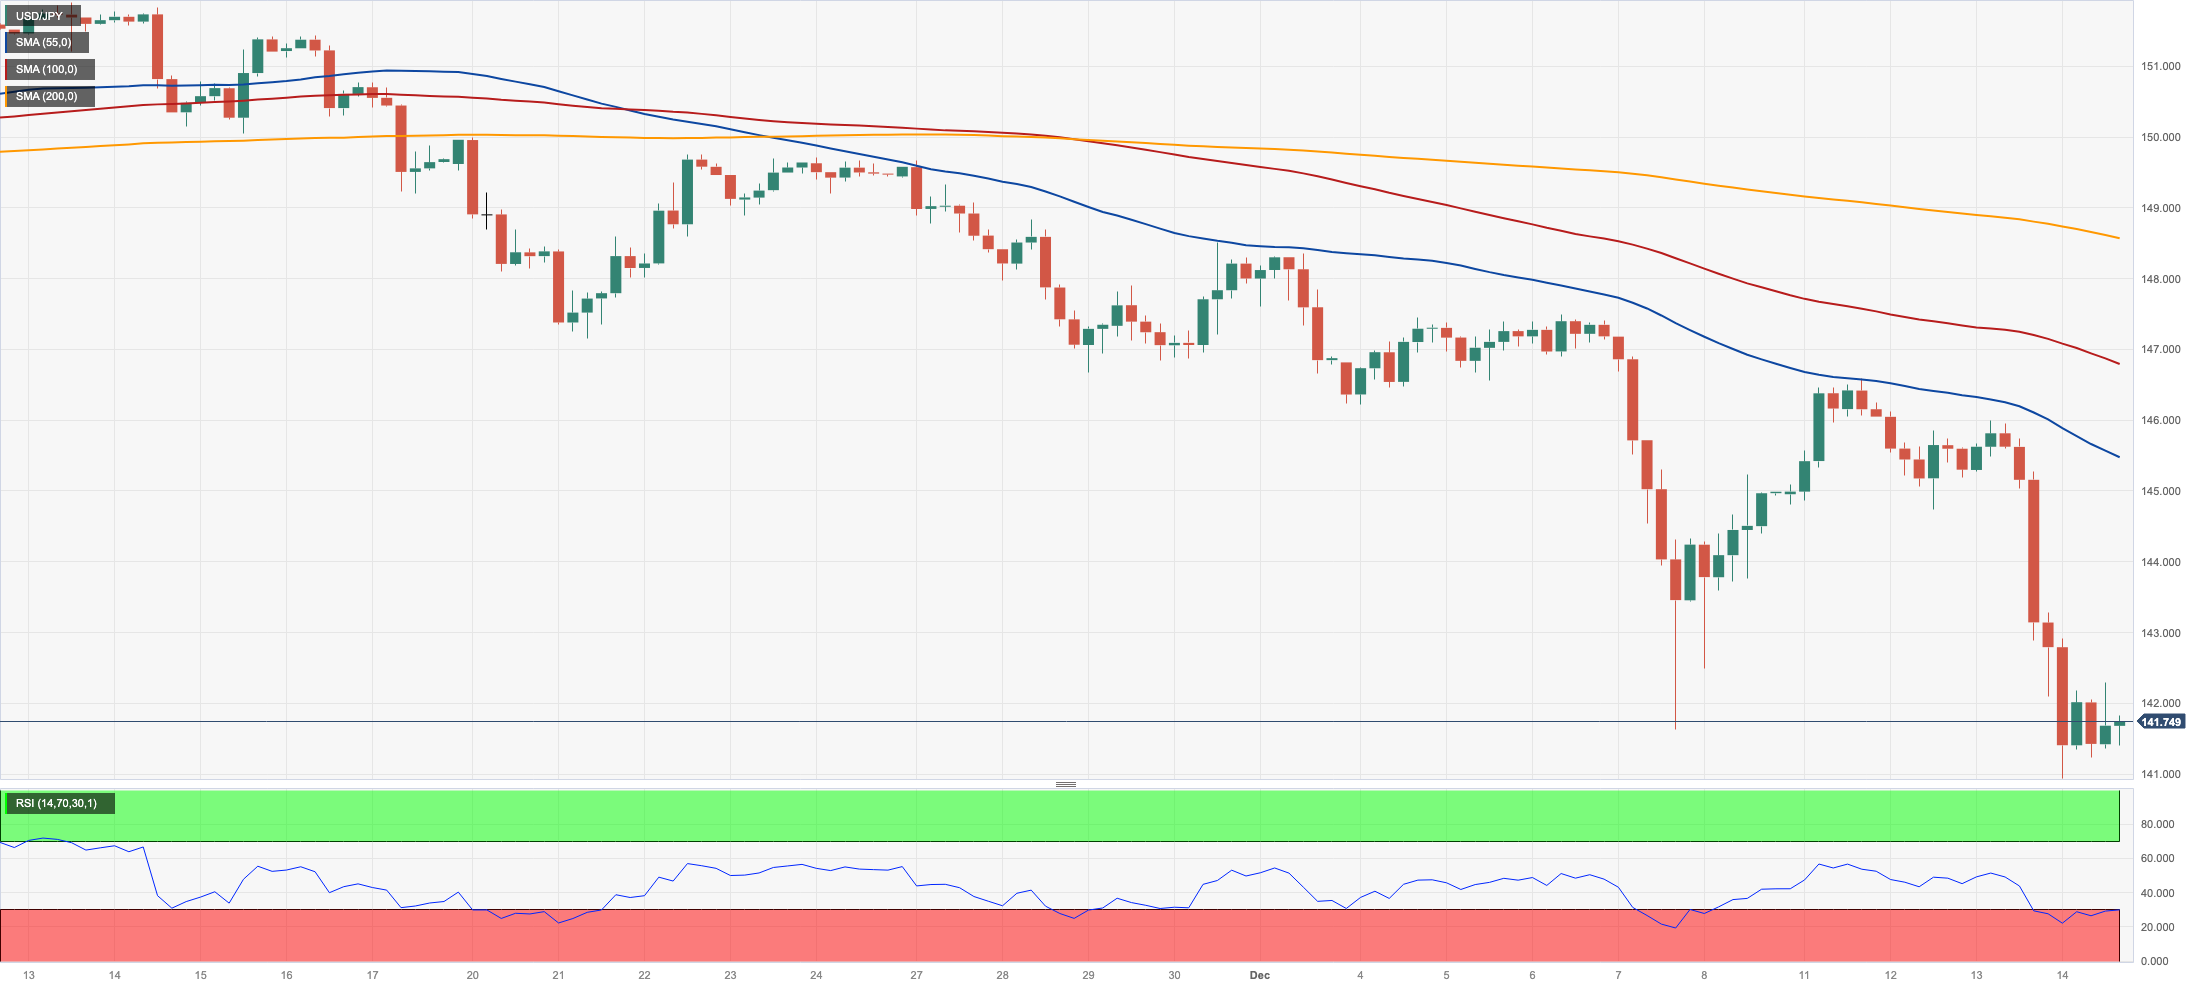
The multi-week corrective decline in USD/JPY remained well in place for yet another session on Thursday. That said, the pair slipped back below the 141.00 region to print new five-month lows, breaching at the same time the critical 200-day SMA (142.46).
The sharp retracement in the greenback coupled with the persistent downward bias in US yields across different timeframes accompanied another negative session in spot, while JGB 10-year yields retreated for the fourth session in a row below 0.70%.
In Japan, Foreign Bond Investment shrank by ¥1080B in the week to December 9, Machinery Orders contracted 2.2% in the year to October, and Industrial Production expanded at an annualized 1.1% in the same month.
If sellers maintain control, a first conflict zone will form around the December low of 140.94 (December 14). The loss of the latter exposes a probable test of the round level of 140.00 prior to the July low of 137.23 (July 14). On the flip side, the 55-day SMA at 148.88 is projected to provide temporary resistance ahead of the 2023 high of 151.90 (November 13) and the 2022 top of 151.94 (October 21), all of which are before the round number of 152.00. The RSI collapsed to the oversold zone near 28.
Resistance levels: 146.58 147.49 148.52 (4H chart)
Support levels: 140.94 138.05 137.23 (4H chart)
GBPUSD
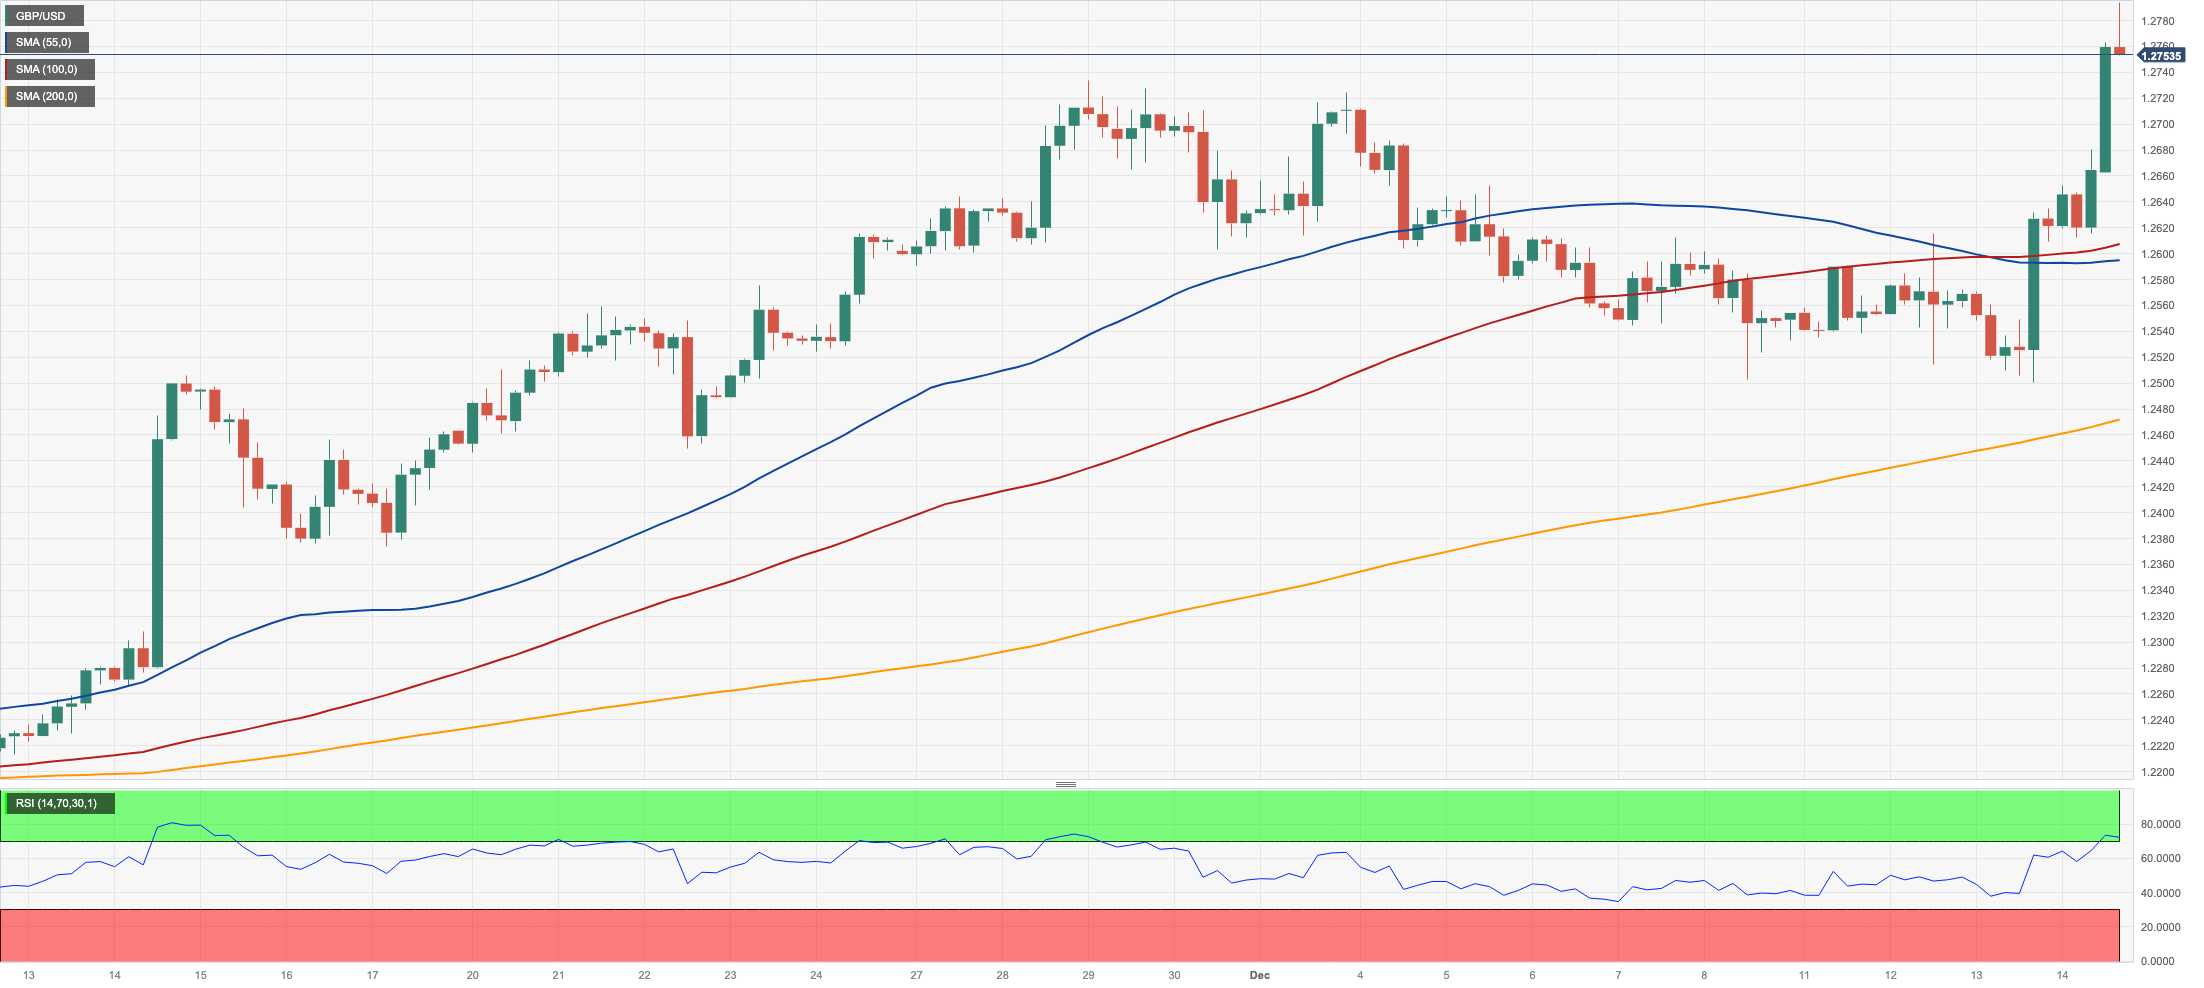
The continuation of the sharp sell-off in the greenback lent extra legs to the risk-associated universe, pushing GBP/USD to levels just shy of 1.2800 the figure for the first time since mid-August.
In fact, investors continued to sell the dollar against the backdrop of the somewhat hawkish messages at both the ECB and the BoE monetary policy meetings on Thursday.
As anticipated, the BoE left its policy rate unchanged in its newest decision. The outcome aligns closely with November's meeting, as the same three dissenting members again voted in favour of an increase. The accompanying Monetary Policy Report also largely mirrored November’s, with the MPC reiterating that "further tightening of monetary policy may be warranted if persistent inflationary pressures emerge."
While holding rates steady as forecast, the central bank kept its hawkish cues regarding a bias towards tightening. References to higher rates remaining in place for the foreseeable future, coupled with concern over stubborn service inflation and wage growth, underpinned the bullish tone in the quid. This contrasted favourably against the dovish tone struck by the Fed at its recent meeting on Wednesday and bolstered further the weekly uptrend in Cable.
The continuation of the uptrend could now see GBP/USD revisit the weekly tops of 1.2818 (August 10) and 1.2995 (July 27), all ahead of the psychological 1.3000 barrier. On the contrary, the initial support emerges at the 200-day SMA at 1.2498 ahead of the provisional 55-day SMA at 1.2356 and the weekly low of 1.2187 (November 10). The October low of 1.2037 (October 3), the crucial 1.2000 level, and the 2023 bottom of 1.1802 (March 8) are all aligned down from here. The daily RSI rose to the proximity of 68.
Resistance levels: 1.2793 1.2800 1.2995 (4H chart)
Support levels: 1.2500 1.2448 1.2373 (4H chart)
AUDUSD
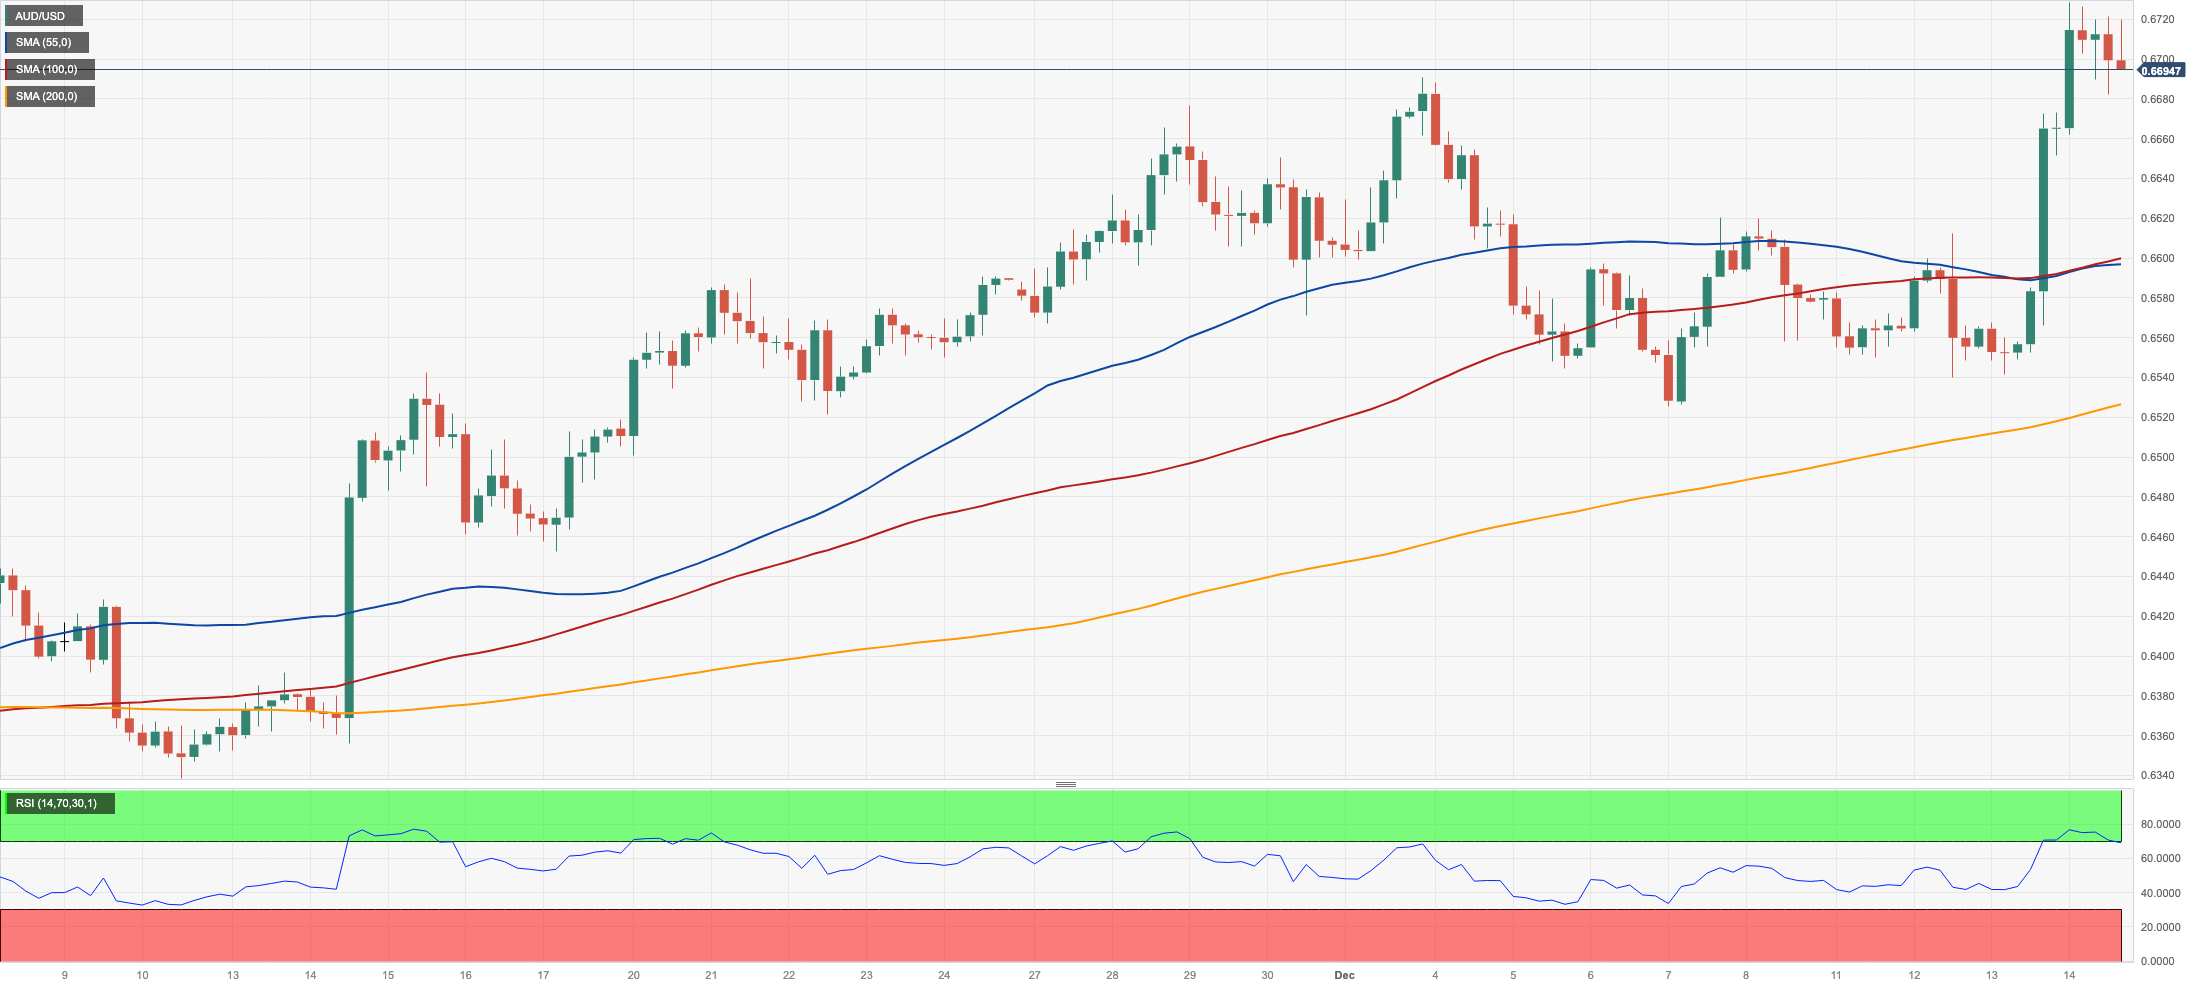
AUD/USD added to Wednesday’s advance and trespassed the key 0.6700 barrier on Thursday, clocking at the same time fresh five-month peaks.
Further weakness in the greenback in combination with the broad-based strong performance of the commodity galaxy lent extra wings to the Aussie dollar and propelled spot further north.
Also adding to the upside bias in the pair, the Australian labour market report came in on a firm note in November after the Employment Change increased by 61.5K individuals, although the jobless rate ticked higher to 3.9%. Further data saw Consumer Inflation Expectations ease to 4.5% in December.
Extra gains could now lift AUD/USD to the round level of 0.6800 ahead of the July high of 0.6894 (July 14) and the June top of 0.6899 (June 16), all prior to the crucial 0.7000 yardstick. By contrast, the 200-day SMA at 0.6575 should offer decent initial contention ahead of the December low of 0.6525 (December 7). South from here emerges the 2023 bottom of 0.6270 (October 26) before the round level of 0.6200 and the 2022 low of 0.6169 (October 13). The daily RSI advanced beyond 64.
Resistance levels: 0.6728 0.6739 0.6821 (4H chart)
Support levels: 0.6525 0.6452 0.6347 (4H chart)
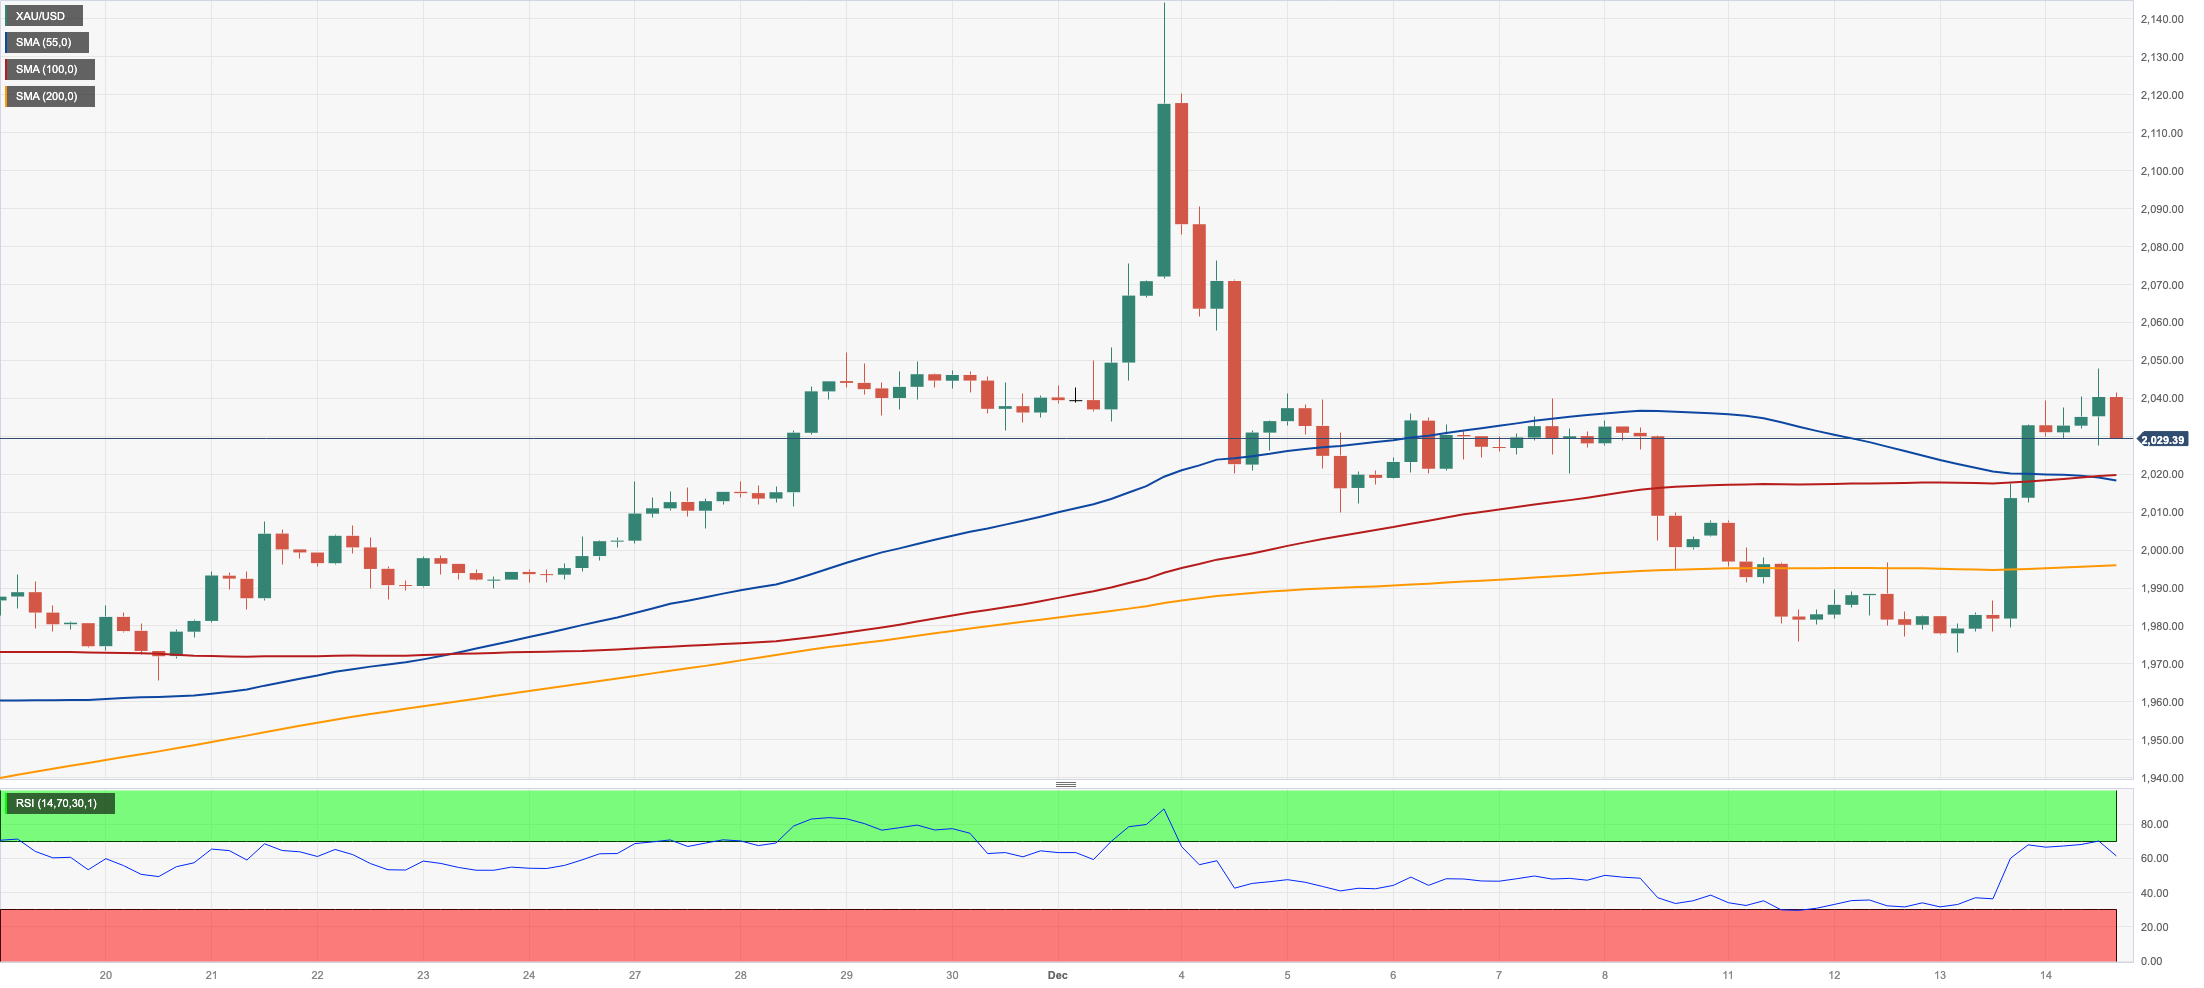
GOLD
Prices of the yellow metal extended further north after the recent breakout of the critical $2000 mark per troy ounce on Thursday.
Further gains in the precious metal came in response to the strong pullback in the greenback along with an extra decline in US yields across the board, all amidst further repricing of interest rate cuts by the Federal Reserve at some point in H1 2024.
This sentiment was reinforced following the FOMC event on Wednesday, during which the Federal Reserve opted to keep interest rates unchanged. Chief Powell also indicated that the likelihood of further rate hikes was low, while policymakers were actively deliberating and discussing the timing for a potential rate cut.
The continuation of the upside momentum in gold could see the all-time top of $2150 (December 4) revisited in the short-term horizon. On the downside, further retracement confronts immediate opposition around the December low of $1973 (December 13). Once this area is cleared, bullion is likely to make a trip to the important 200-day SMA of $1954 ahead of the November low of $1931 (November 13). Down from here comes the October low of $1810 (October 6) seconded by the 2023 bottom of $1804 (February 28), and lastly the vital $1800 contention zone.
Resistance levels: $2047 $2149 (4H chart)
Support levels: $1995 $1973 $1965 (4H chart)
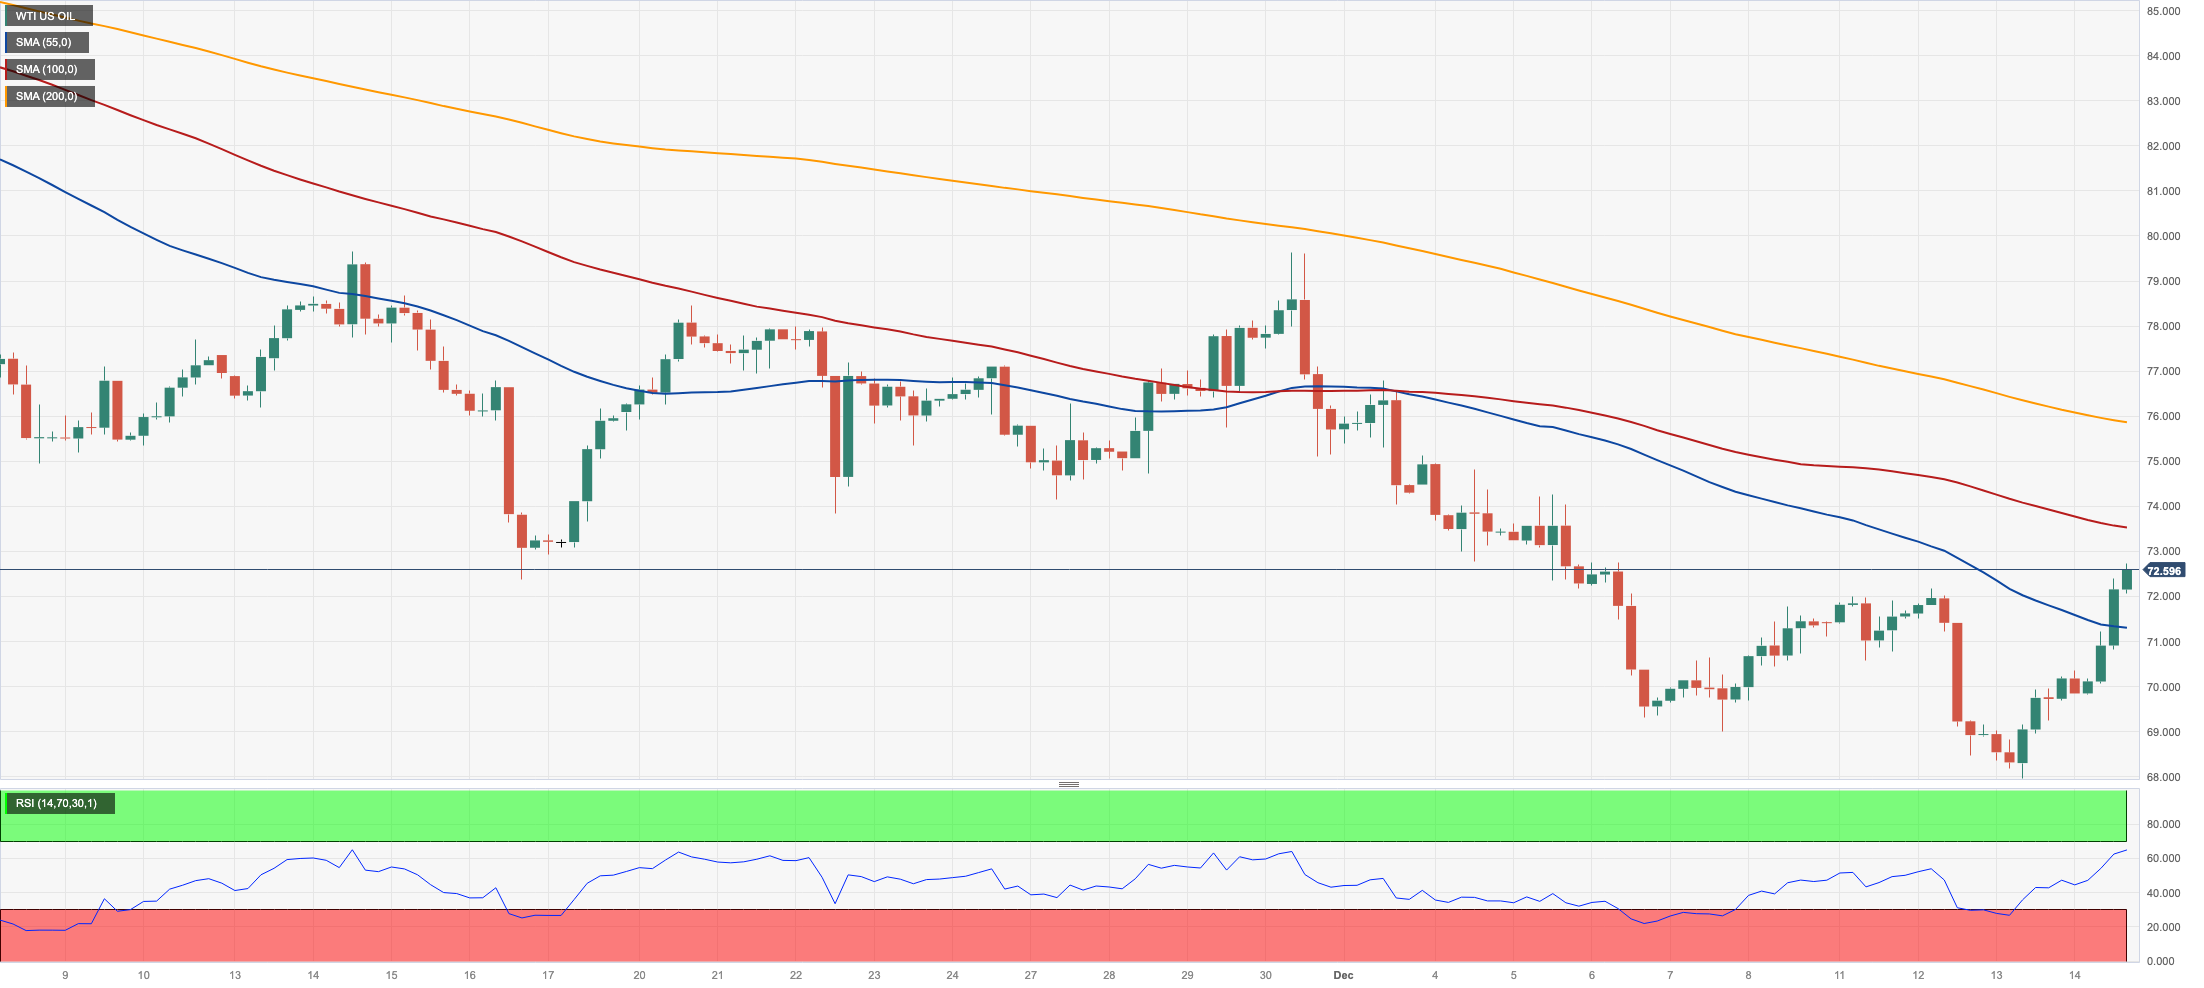
CRUDE WTI
Prices of the American reference for the sweet light crude oil extended their recovery and climbed to multi-session highs past the $72.00 mark per barrel on Thursday.
In fact, WTI saw its upside momentum gather extra steam on the back of the pronounced pullback in the dollar, while an upbeat report by the IEA also lifted spirits around the commodity.
On the latter, the IEA stated that global oil demand is projected to increase by 1.1 mbpd in 2024, exceeding by 130 kbpd its previous forecast. The IEA attributed this upward revision to an improved outlook for the US and lower oil prices.
Also bolstering the mood was Wednesday’s larger-than-expected weekly drop in US crude oil supplies, as reported by the EIA.
Next on the upside for WTI aligns the 200-day SMA at $77.76 prior to the important $80.00 level, which would be shortly followed by the November high of $80.15 (November 3). Further increases from here might restore the market to its weekly top of $89.83 (October 18), followed by the YTD peak of $94.99 (September 28). North from here comes the August 2022 high of $97.65 (August 30) before the psychological $100.00 mark. The other way around, a break below the December low of $67.74 (December 13) may face the 2023 low of $63.61 (May 4) before reaching the key $60.00 level.
Resistance levels: $72.42 $76.72 $79.56 (4H chart)
Support levels: $67.68 $67.01 $66.77 (4H chart)
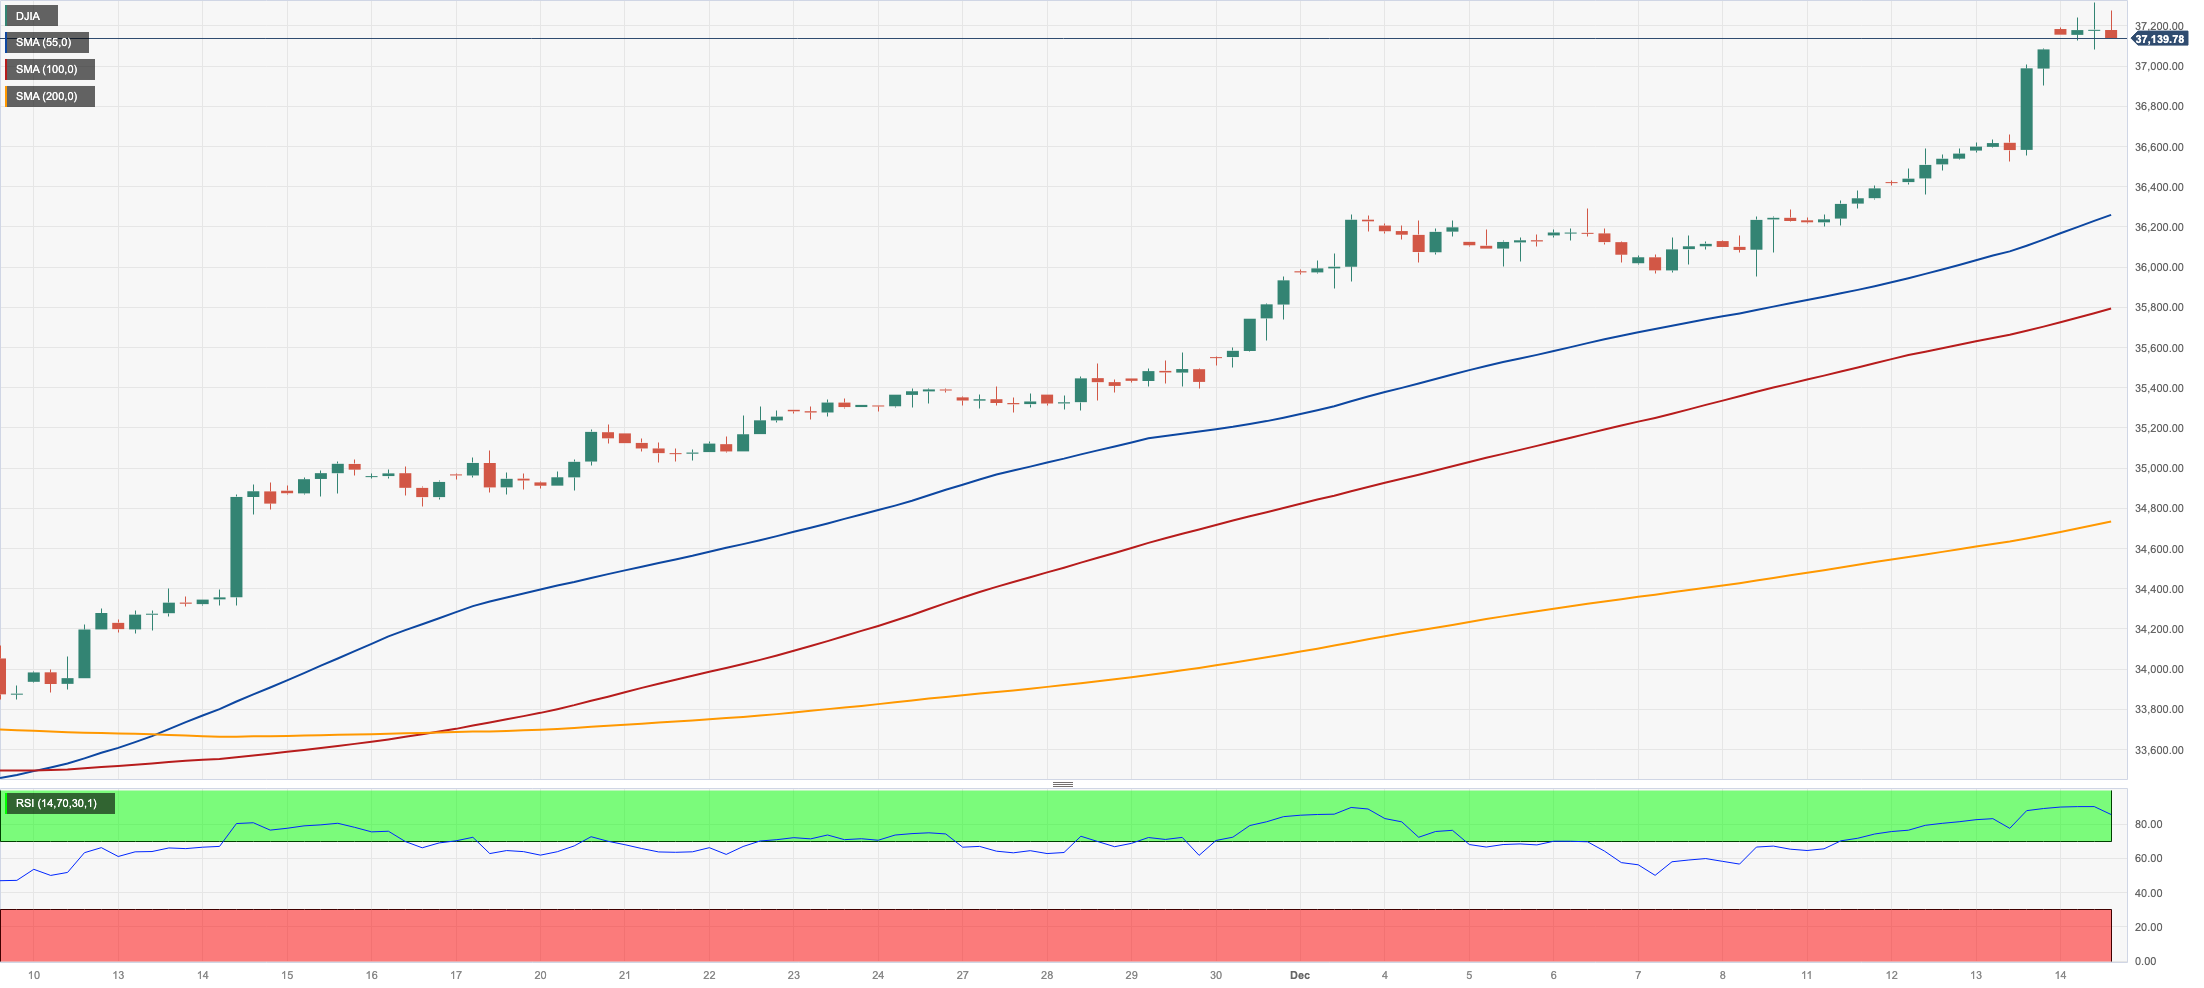
DOW JONES
The rally in US equities remained well and sound for the fifth session in a row on Thursday, this time lifting the blue-chip reference Dow Jones to another all-time top near the 37300 zone.
Extra gains in the index were propped up by the persistent optimism among market participants, which was in turn reinforced by expectations of interest rate reductions by the Federal Reserve around May 2024.
Contributing to this positive environment also emerged the auspicious prints from US Retail Sales for the month of November.
Overall, the Dow Jones advanced 0.19% to 37161, the S&P500 gained 0.08% to 4710, and the tech-heavy Nasdaq Composite dropped 0.24% to 14697.
The Dow Jones reached a new record high of 37276 on December 14. In opposition, the 100-day SMA at 34566 should offer interim support ahead of the more relevant 200-day SMA at 34053 and the weekly low of 33859 (November 7). After that, a potential test of the October bottom of 32327 (October 27) might return to the radar, ahead of the 2023 low of 31429 (March 15) and the 2022 low of 28660 (October 13). The daily RSI rose to the 85 zone, suggesting that the market remained highly overbought.
Top Performers: Goldman Sachs, Caterpillar, Walgreen Boots
Worst Performers: UnitedHealth, Microsoft, McDonald’s
Resistance levels: 37276 (4H chart)
Support levels: 36021 35350 34559 (4H chart)
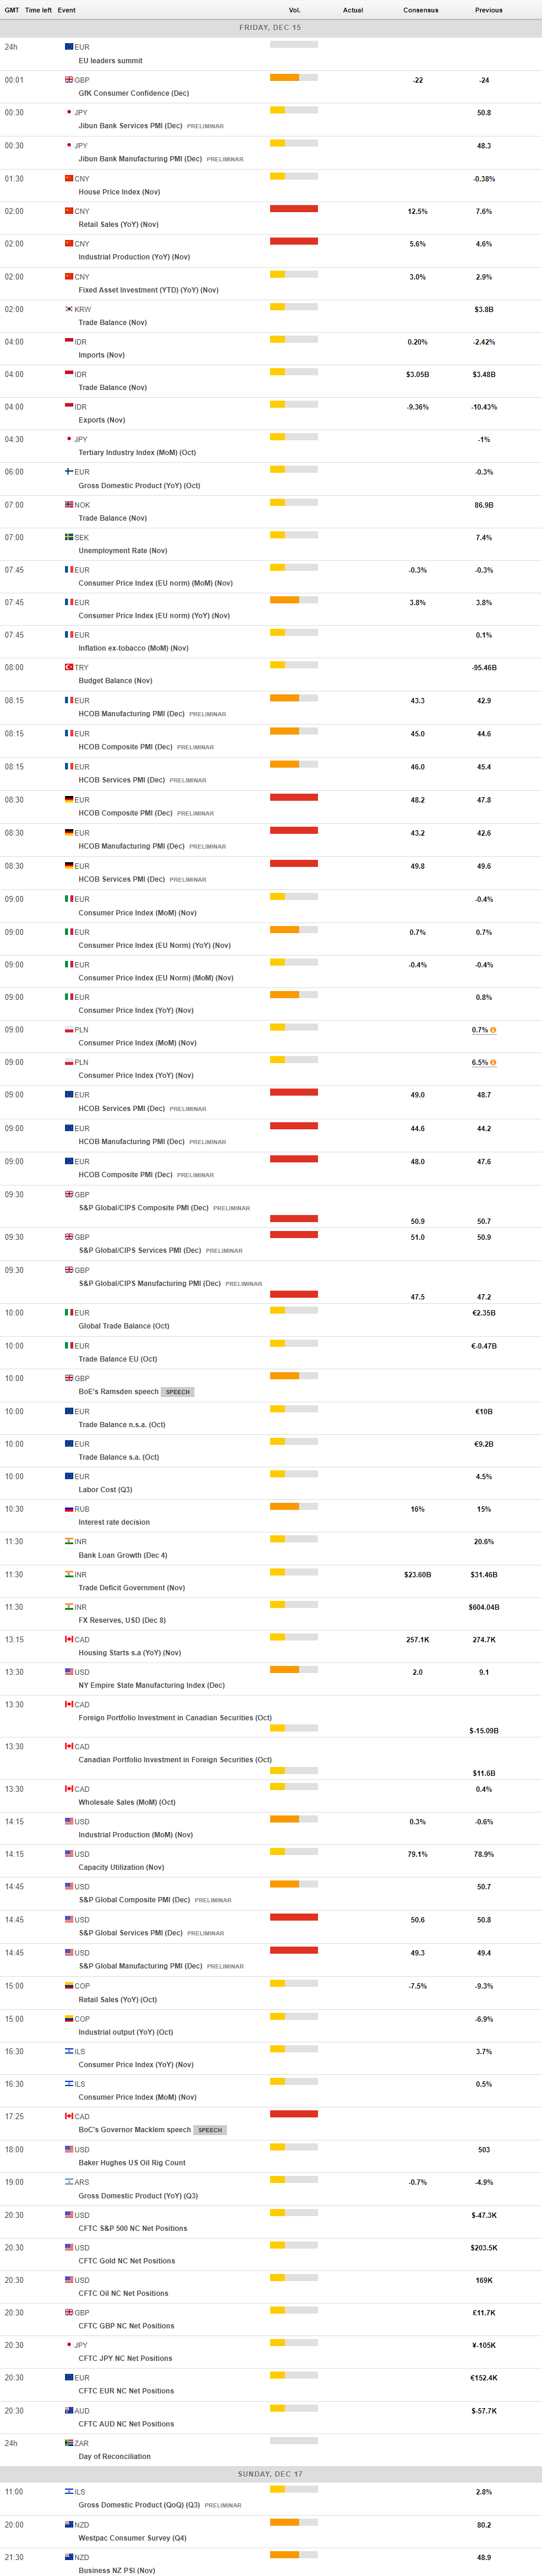
MACROECONOMIC EVENTS
All Information & Updates provided by:

All information relating to the financial markets available on this page has been prepared and issued by FXStreet (Forexstreet SL, Spain, Reg: B62498233) on the basis of publicly available information and all information believed to be reliable and does not conflict with Kuwaiti local laws, and all necessary care has been taken to before the company to ensure that the facts mentioned are correct from the source.
NCM Investment nor any of its directors or employees shall in any way be held responsible for the contents of this news, and the information contained on this page is intended only to provide clients with publicly available information and should not be construed as investment advice, report or analysis and/or constitute an offer or invitation to buy or sell financial instruments of any kind.
RISK WARNING: Forex and CFDs are highly risky leveraged products, as losses can exceed deposits. Please ensure you understand all the risks and take independent advice if necessary. NCM will segregate the clients based on the criteria of the regulator and its bylaws. NCM does not provide any advisory service; the material published does not constitute advice or a recommendation for a transaction in any financial instrument. NCM accepts no responsibility for any use of the content presented and any consequences of that use. Anyone acting on the information provided does so at their own risk.