
- Contact Us:
-

-

-

-


Daily Market Updates
19 Dec 2023
EURUSD
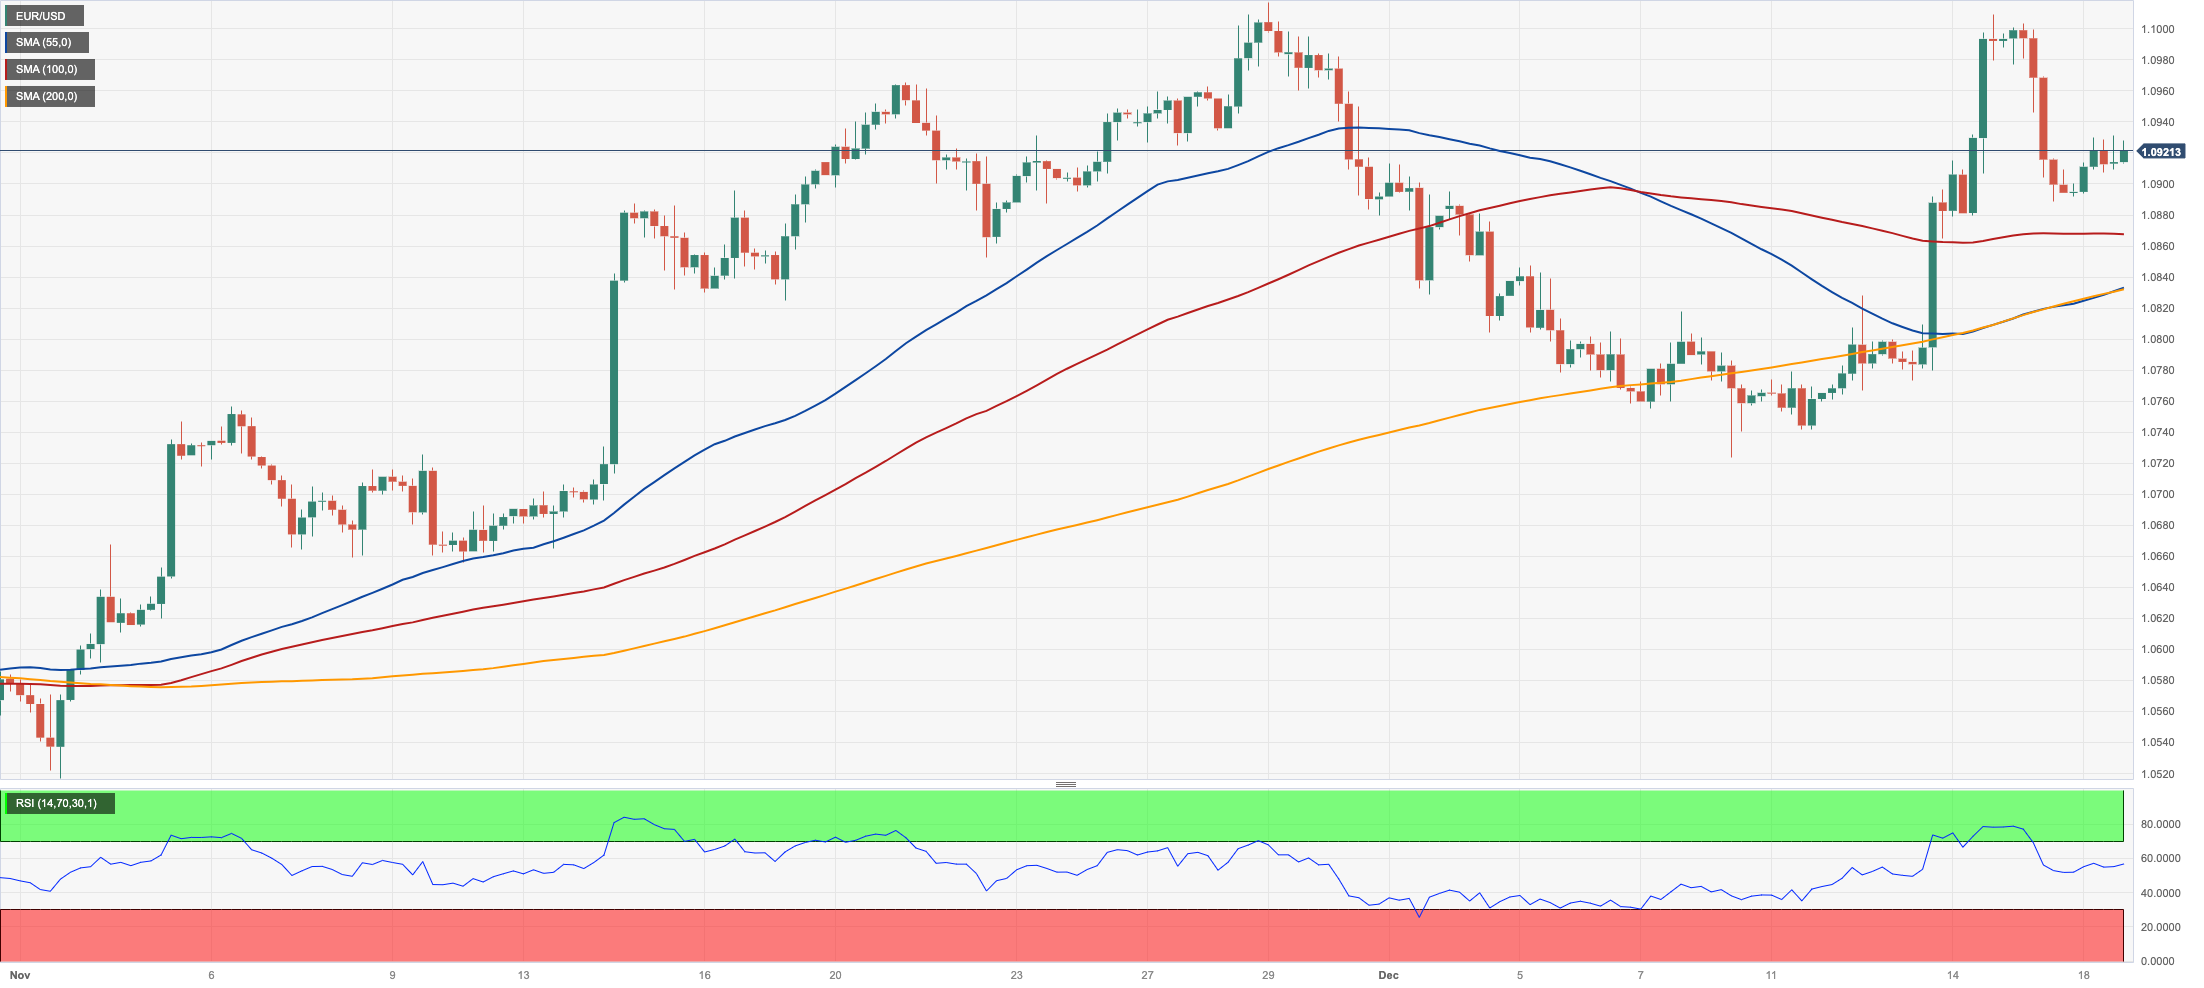
EUR/USD managed to regain the smile and charted a decent bounce past the 1.0900 hurdle at the beginning of the week, so far extending the positive momentum from the previous week.
The pair’s recovery came in response to an inconclusive session in the greenback, which prompted the USD Index (DXY) to maintain a narrow range in the mid-102.00s against the backdrop of a small rebound in US yields across the curve as well as in the German 10-year bund yields.
Contributing to the somewhat selling bias in the dollar at the beginning of the week came comments from R. Bostic (Atlanta Fed), who informed that he foresees two instances of interest rate reductions in 2024. However, he anticipates that these cuts will likely occur in the third quarter rather than earlier. In a different statement, A. Goolsbee (Chicago Fed) expressed his opinion on Sunday that it would be an exaggeration to consider reducing rates until authorities have confidence that inflation is steadily moving towards its target.
In the domestic calendar, the Business Climate in Germany eased marginally to 86.4 in December.
In the US, the NAHB Housing Market Index improved to 37 for the current month, in what was the sole release on Monday.
Immediately to the upside for EUR/USD comes the December high of 1.1009 (December 14) before the November top of 1.1017. Following that, the August peak of 1.1064 (August 10) and the weekly high of 1.1149 (July 27) are both feasible, all of which are before to the 2023 top of 1.1275 (July 18). Having said that, if the pair falls below the 200-day SMA at 1.0829, it is likely to revisit the December low of 1.0723 (December 8), which looks to be supported by the preliminary 55-day SMA of 1.0726. The loss of the latter might resurrect a challenge to the weekly low of 1.0495 (October 13), which comes ahead of the 2023 low of 1.0448 (October 3) and the round level of 1.0400. The RSI on a daily basis advanced to the proximity of 58.
Resistance levels: 1.1009 1.1017 1.1064 (4H chart)
Support levels: 1.0888 1.0822 1.0723 (4H chart)
USDJPY
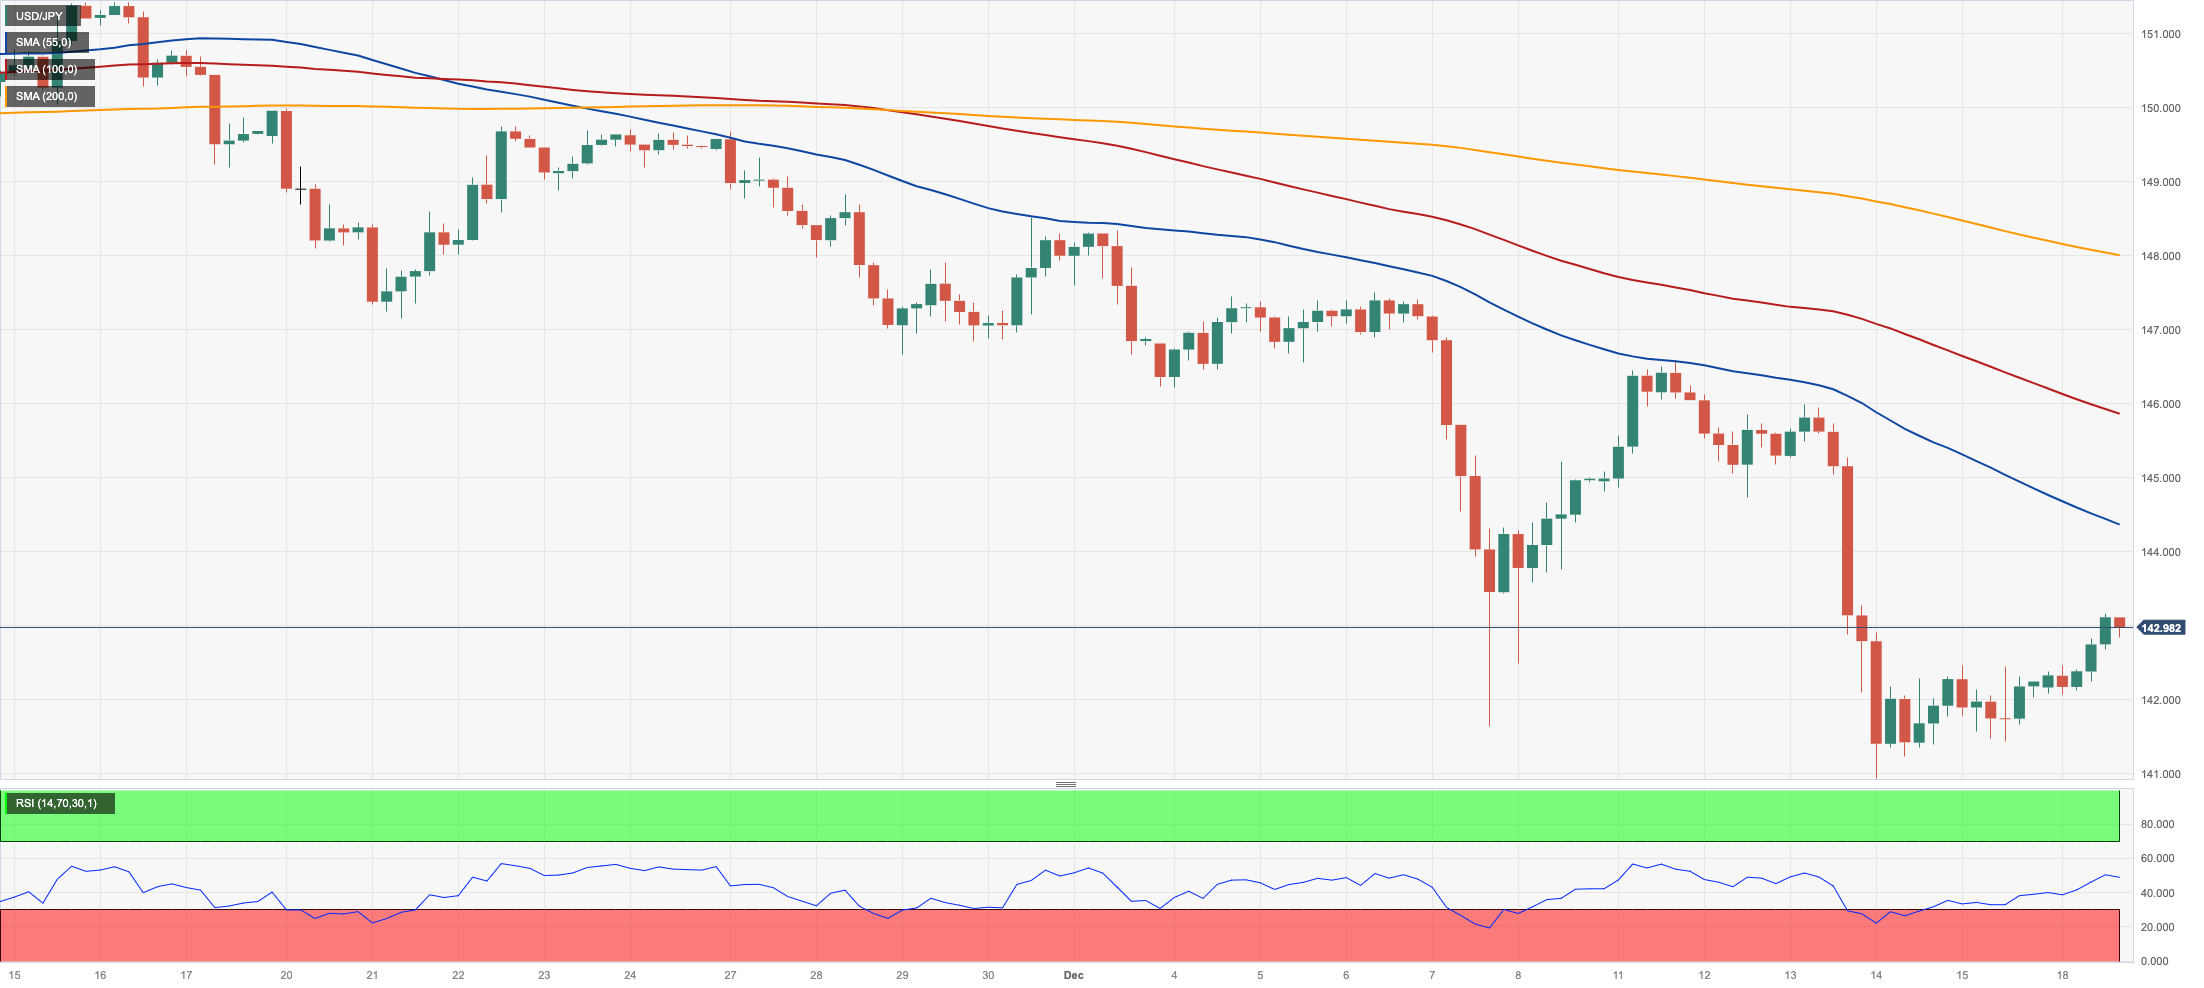
An auspicious start to the week prompted USD/JPY to add to Friday’s gains and reclaim the area beyond 143.00 the figure, surpassing at the same time the critical 200-day SMA (142.55).
Further gains in spot came in tandem with a somewhat bearish performance of the greenback in contrast with higher US yields across different maturities and a pullback in JGB 10-year yields.
There were no data releases or events scheduled in the Japanese docket on Monday.
Further recovery now targets the interim 55-day SMA at 148.63 ahead of the 2023 peak of 151.90 (November 13) and the 2022 high of 151.94 (October 21), all of which are prior to the round number of 152.00. On the flip side, initial support is expected at the December low of 140.94 (December 14). The latter's collapse opens the door to a test of the round level of 140.00 before the July low of 137.23 (July 14). The RSI rose to the vicinity of 35.
Resistance levels: 143.15 144.52 146.58 (4H chart)
Support levels: 140.94 138.05 137.23 (4H chart)
GBPUSD
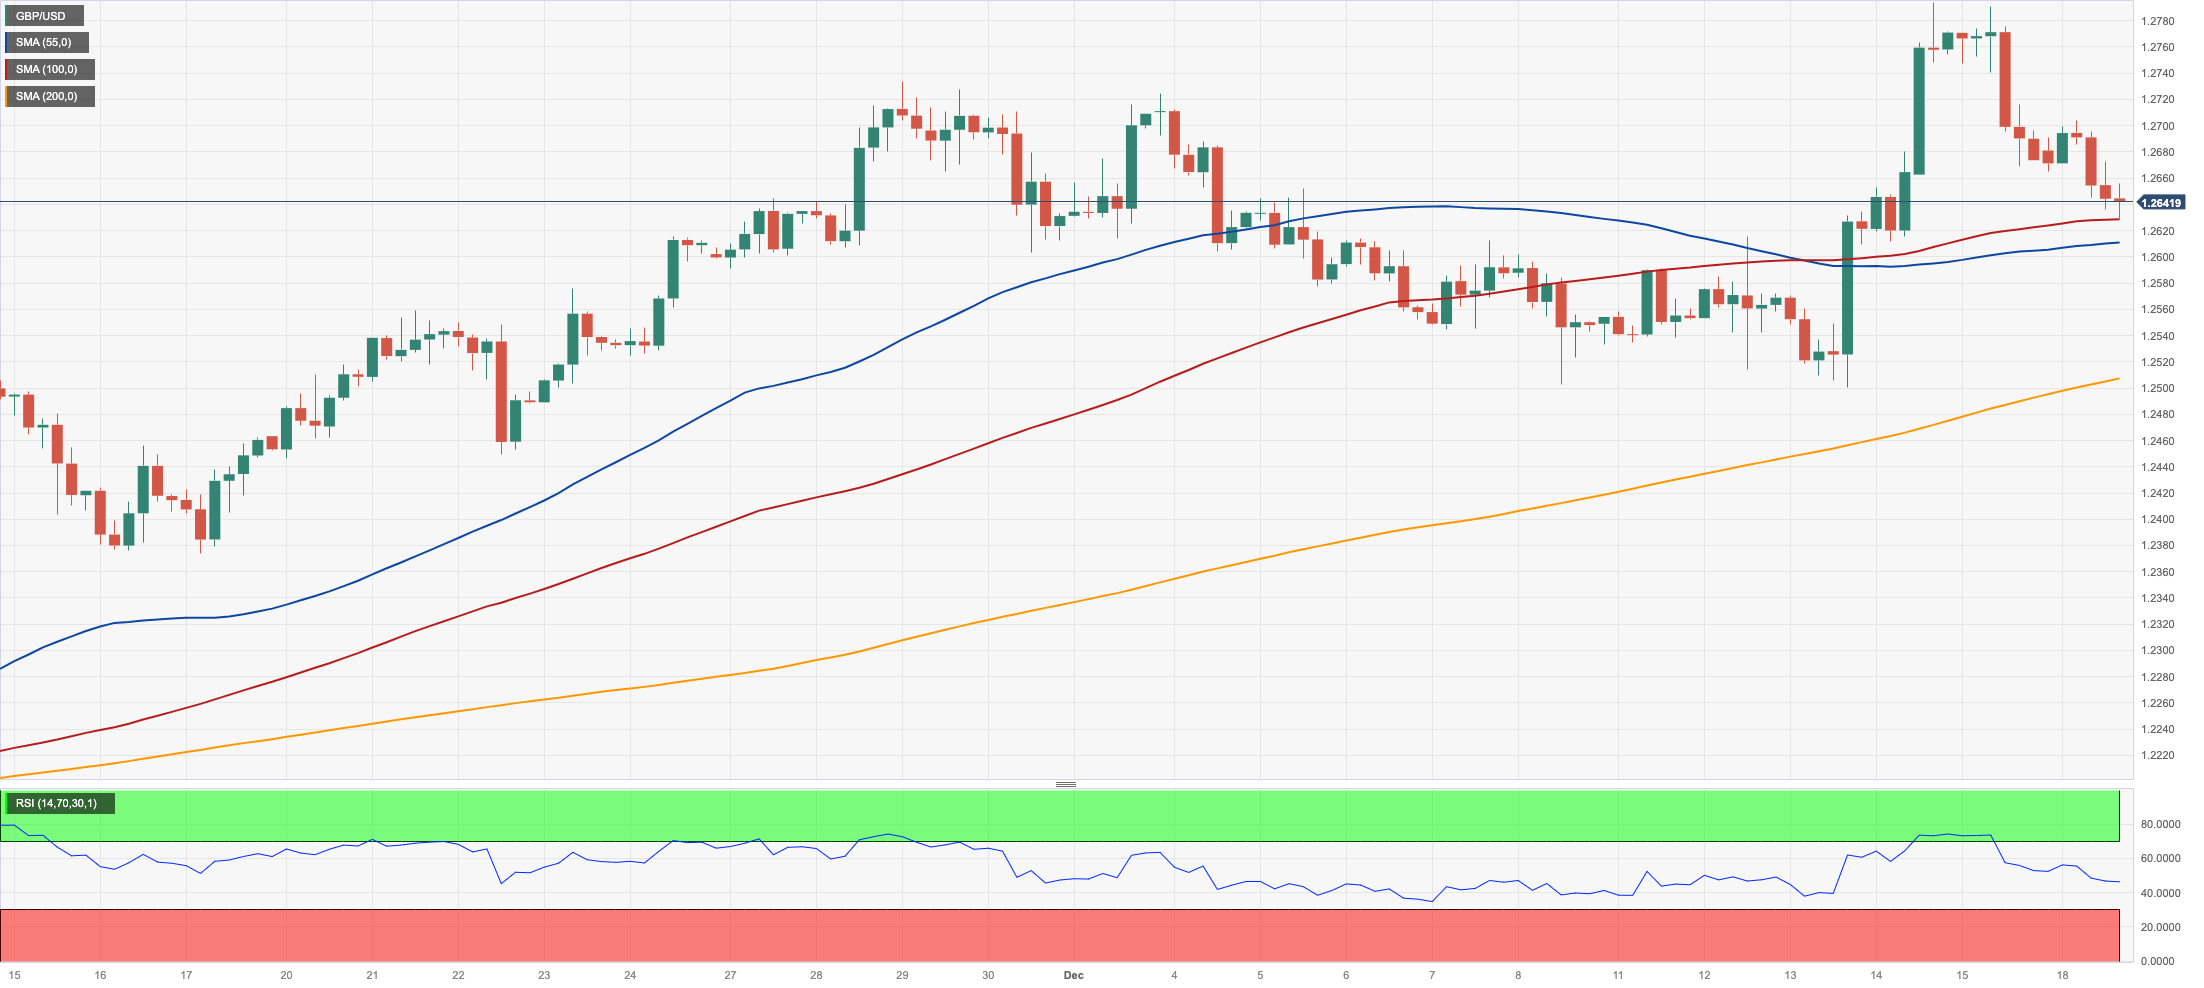
The British pound failed to capitalize on the absence of direction around the greenback and dragged GBP/USD to the 1.2630 region on Monday, adding to Friday’s losses.
Absent releases in the UK calendar, BoE’s MPC member Broadbent stated that the monetary policy committee will require evidence of a "more extended and more evident decrease" in inflation before it can confidently determine that a downward trend is occurring.
In the meantime, investors continued to digest the hawkish hold by the BoE at last week’s meeting amidst the increasingly stagnant outlook for the UK economy in the next quarters.
If sellers push harder, GBP/USD could revisit the 200-day SMA at 1.2504, just ahead of the December low of 1.2500 (December 13). The loss of the latter could shift the focus to the preliminary 55-day SMA at 1.2374 and the weekly low of 1.2187 (November 10). The October low of 1.2037 (October 3), the crucial 1.2000 level, and the 2023 bottom of 1.1802 (March 8) are all aligned down from here. On the upside, Cable should revisit the December high of 1.2793 (December 14), seconded by weekly tops of 1.2818 (August 10) and 1.2995 (July 27), both of which are ahead of the critical 1.3000 level. The daily RSI dropped back below the 57 mark.
Resistance levels: 1.2793 1.2800 1.2995 (4H chart)
Support levels: 1.2628 1.2500 1.2448 (4H chart)
AUDUSD
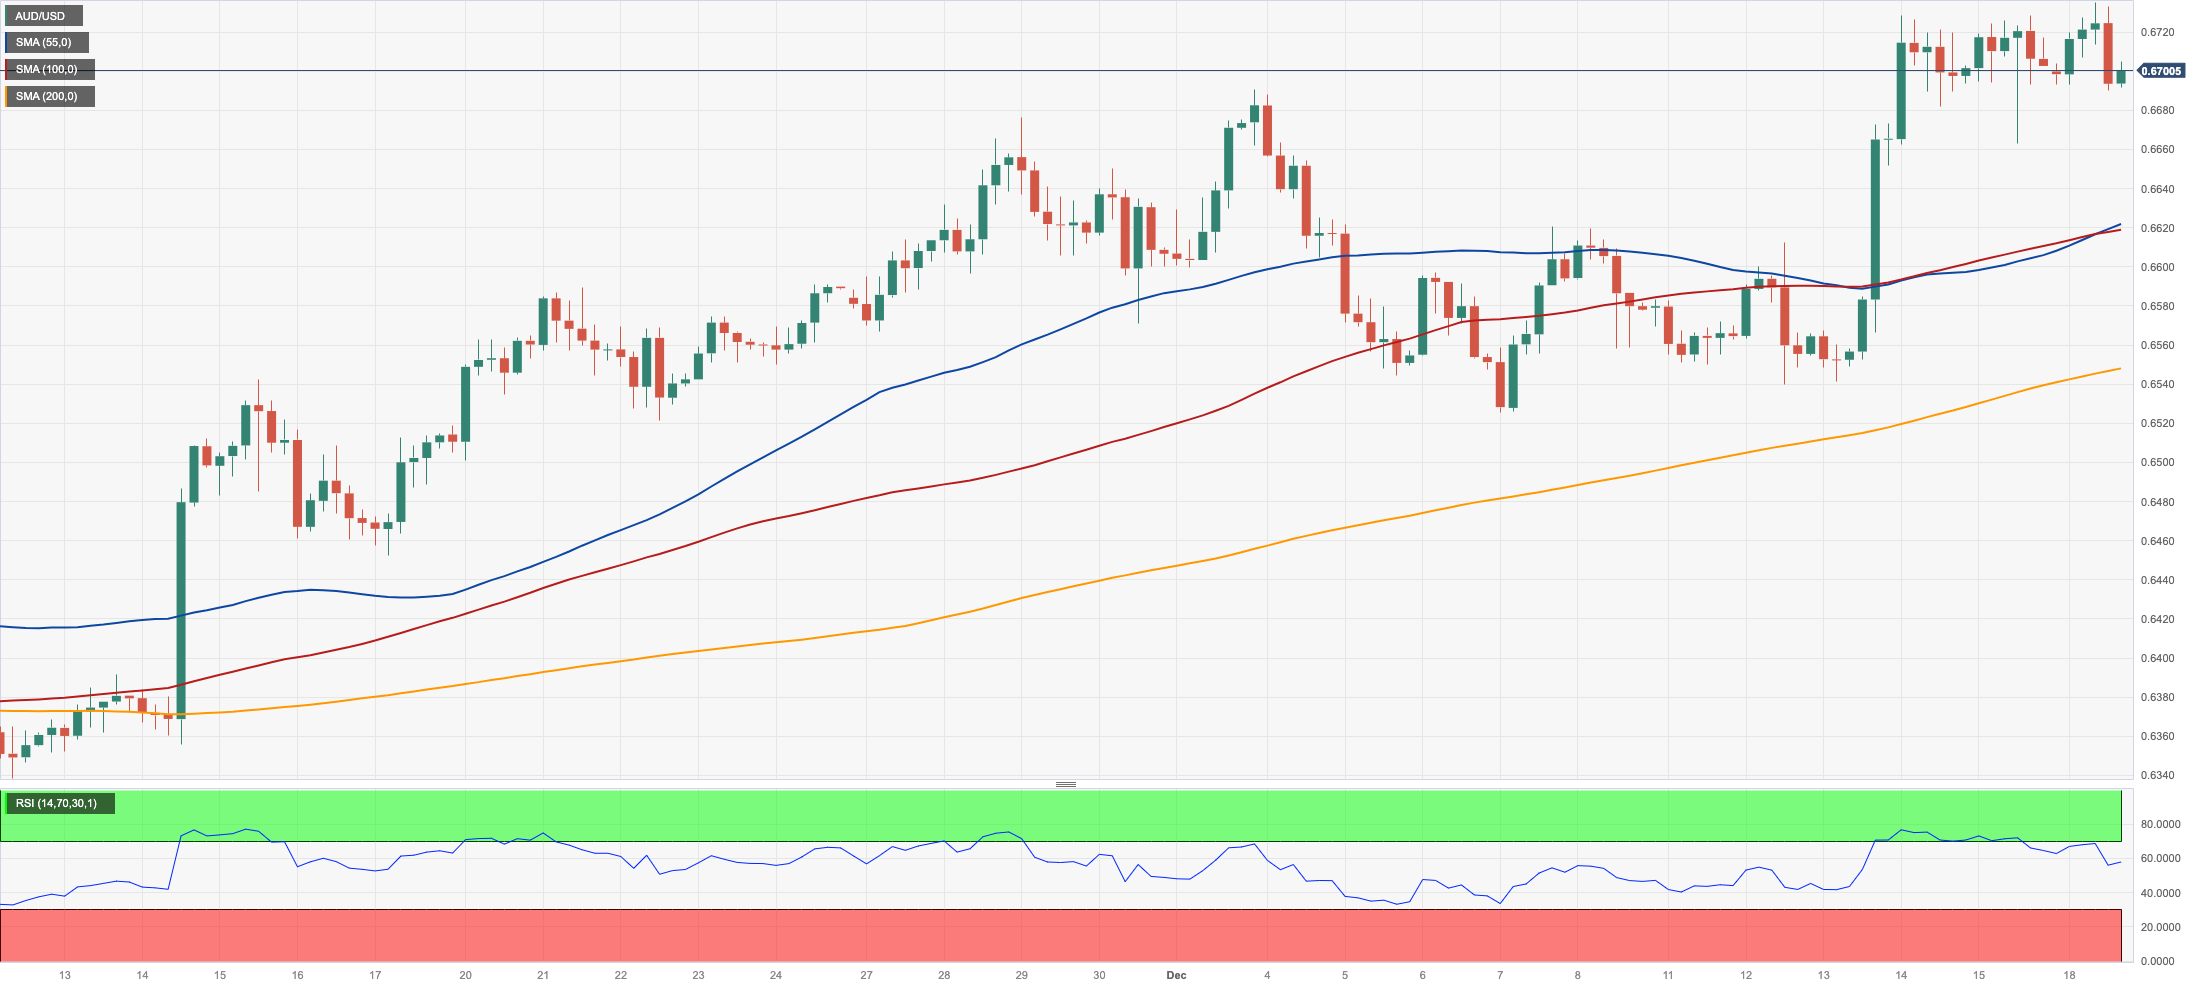
The optimism around the Aussie dollar remained well in place for the fourth session in a row at the beginning of the week.
That said, AUD/USD advanced to new five-month tops past 0.6730, although it surrendered some of those gains towards the end of the NA session on Monday.
The minimal advance in the pair was also accompanied by a poor session from both copper prices and iron ore, amidst the broad-based mixed tone in the commodity complex.
The Australian docket was empty on Monday.
The breach of the December high of 0.6735 (December 18) might pave the way for a trip to the July top of 0.6894 (July 14) and the June peak of 0.6899 (June 16), all of which are located before the important 0.7000 yardstick. In contrast, the AUD/USD is facing early support at the crucial 200-day SMA of 0.6575, just ahead of the December low of 0.6525 (December 7). The 2023 low of 0.6270 (October 26) develops south of here before the round level of 0.6200 and the 2022 low of 0.6169 (October 13). The daily RSI seems to be constant at 65.
Resistance levels: 0.6735 0.6821 0.6846 (4H chart)
Support levels: 0.6663 0.6541 0.6525 (4H chart)
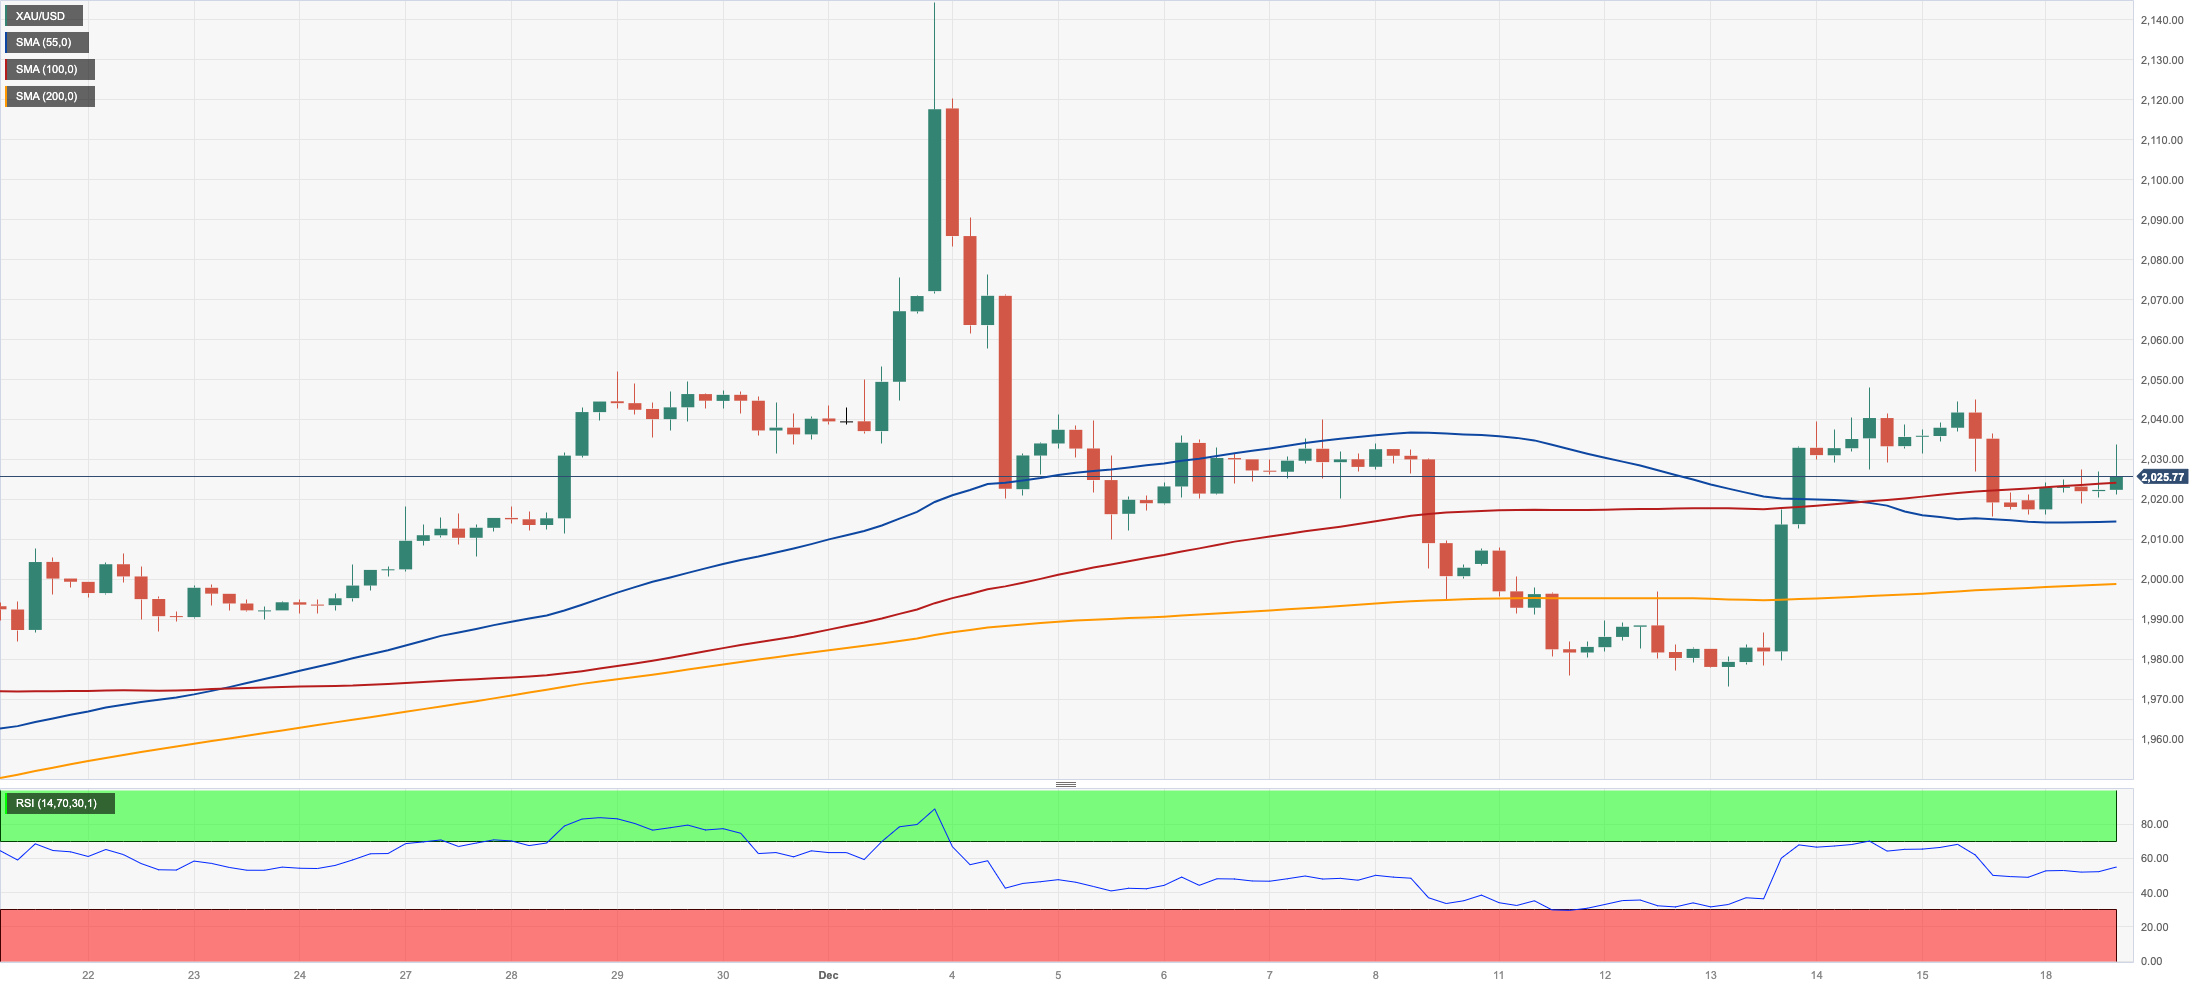
GOLD
Prices of the yellow metal started the week in a positive fashion, reversing Friday’s losses and revisiting the $2030 region per troy ounce.
Monday’s decent advance in bullion came against the backdrop of a small corrective decline in the greenback, while rising US yields across the board seem to have limited the metal’s upside potential somehow.
Meanwhile, market participants continued digesting the most recent Fed gathering (December 13), where the Committee opted to hold steady on current interest rates. Additionally, Chief Powell alluded to a low likelihood of further rate hikes, while policymakers actively debated the potential timing for a reduction in borrowing costs.
If gold continues to rise, the all-time high of $2150 (December 4) might be revisited soon. Just the opposite, further retracement will be met with immediate contention at the December low of $1973 (December 13). Once this level is cleared, bullion is expected to go to the 200-day SMA of $1956, ahead of the November low of $1931 (November 13). From here, the October low of $1810 (October 6), the 2023 bottom of $1804 (February 28), and eventually the important $1800 contention zone are all possible.
Resistance levels: $2047 $2149 (4H chart)
Support levels: $2015 $1998 $1973 (4H chart)
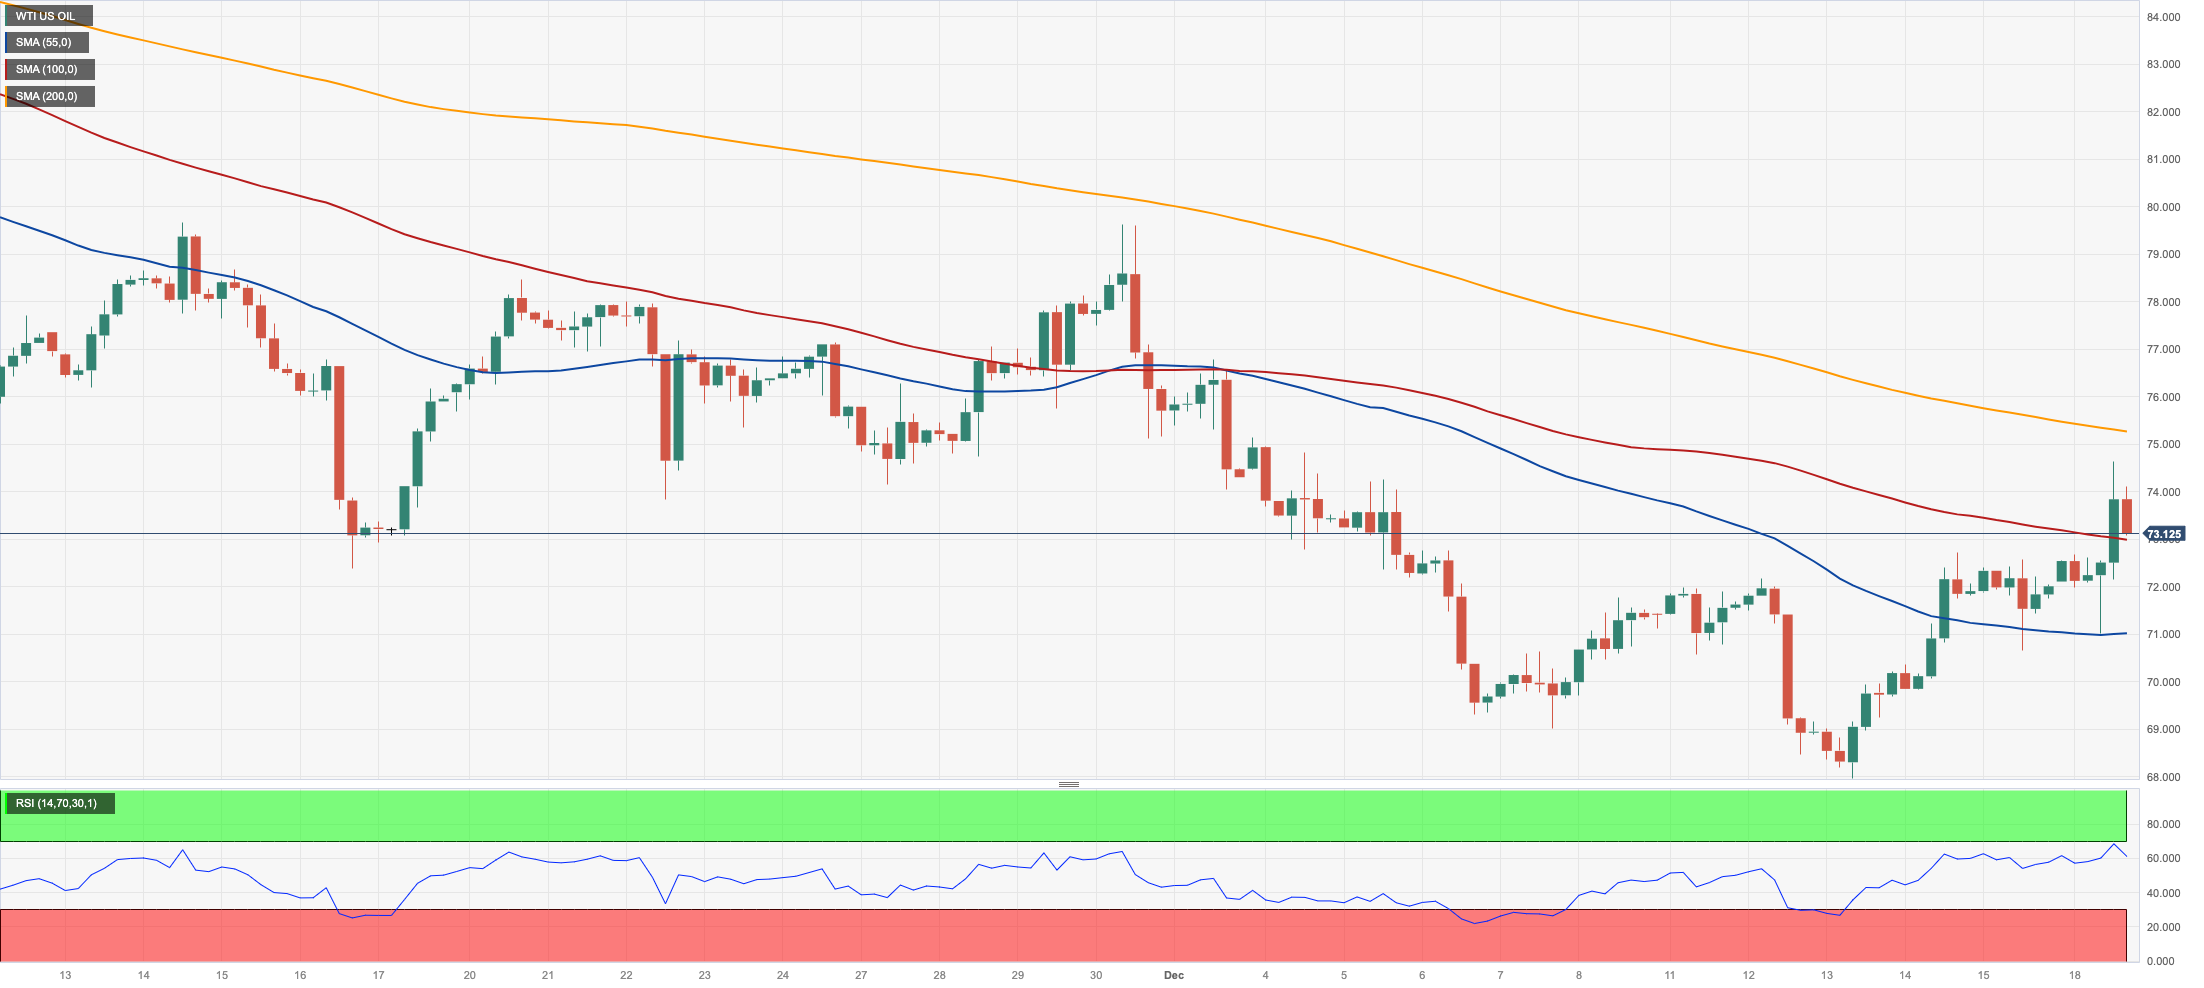
CRUDE WTI
Geopolitical concerns underpinned further the ongoing rebound in prices of the barrel of West Texas Intermediate (WTI) on Monday.
In fact, further attacks to oil tankers in the Red Sea by Houthi rebels reignited worries over supply disruptions among traders, exerting further upside pressure to crude oil prices, which rose to multi-day highs past the $74.00 mark at the beginning of the week.
Also collaborating with the continuation of the upward bias in prices of the commodity, Russia announced it will reduce further its exports of crude oil.
Next on the upside for WTI comes the 200-day SMA at $77.72 before the critical $80.00 level, which is followed by the November high of $80.15 (November 3). Further increases from here might restore the market to its weekly top of $89.83 (October 18), seconded by the 2023 peak of $94.99 (September 28) and the August 2022 high of $97.65 (August 30), all preceding the psychological $100.00 milestone. The other way around, a break below the December low of $67.74 (December 13) might spark a deeper drop to the 2023 bottom of $63.61 (May 4) before reaching the key $60.00 level.
Resistance levels: $74.58 $76.72 $79.56 (4H chart)
Support levels: $67.68 $67.01 $66.77 (4H chart)
All Information & Updates provided by:

All information relating to the financial markets available on this page has been prepared and issued by FXStreet (Forexstreet SL, Spain, Reg: B62498233) on the basis of publicly available information and all information believed to be reliable and does not conflict with Kuwaiti local laws, and all necessary care has been taken to before the company to ensure that the facts mentioned are correct from the source.
NCM Investment nor any of its directors or employees shall in any way be held responsible for the contents of this news, and the information contained on this page is intended only to provide clients with publicly available information and should not be construed as investment advice, report or analysis and/or constitute an offer or invitation to buy or sell financial instruments of any kind.
RISK WARNING: Forex and CFDs are highly risky leveraged products, as losses can exceed deposits. Please ensure you understand all the risks and take independent advice if necessary. NCM will segregate the clients based on the criteria of the regulator and its bylaws. NCM does not provide any advisory service; the material published does not constitute advice or a recommendation for a transaction in any financial instrument. NCM accepts no responsibility for any use of the content presented and any consequences of that use. Anyone acting on the information provided does so at their own risk.