
- Contact Us:
-

-

-

-


Daily Market Updates
20 Dec 2023
EURUSD
Further weakness in the greenback allowed EUR/USD to add to the auspicious start of the week and advance to the area just below the psychological 1.1000 threshold on turnaround Tuesday.
On the flip side, the USD Index (DXY) accelerated its losses and put the 102.00 contention zone to the test amidst the persistent improvement in the risk-linked universe, while declining US yields across the curve also accompanied the bearish performance of the buck.
There was no news from Fed speakers after T. Barkin (Richmond Fed) was reported as saying that, in his view, inflation appears to be more persistent than what the typical Fed official believes. He additionally noted that the Fed's position is well-suited given the projected path for the economy.
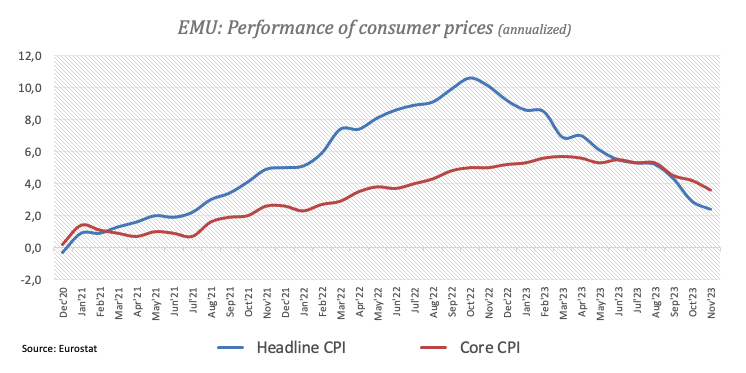
A glimpse at the euro docket showed the final inflation figures in the bloc matched the preliminary readings, where the headline CPI rose 2.4% in the year to November and 3.6% when it came to the Core CPI.
In the US, the housing sector took centre stage after Building Permits contracted at a monthly 2.5% in November (1.46M units) and Housing Starts expanded by 14.8% (1.56M units).
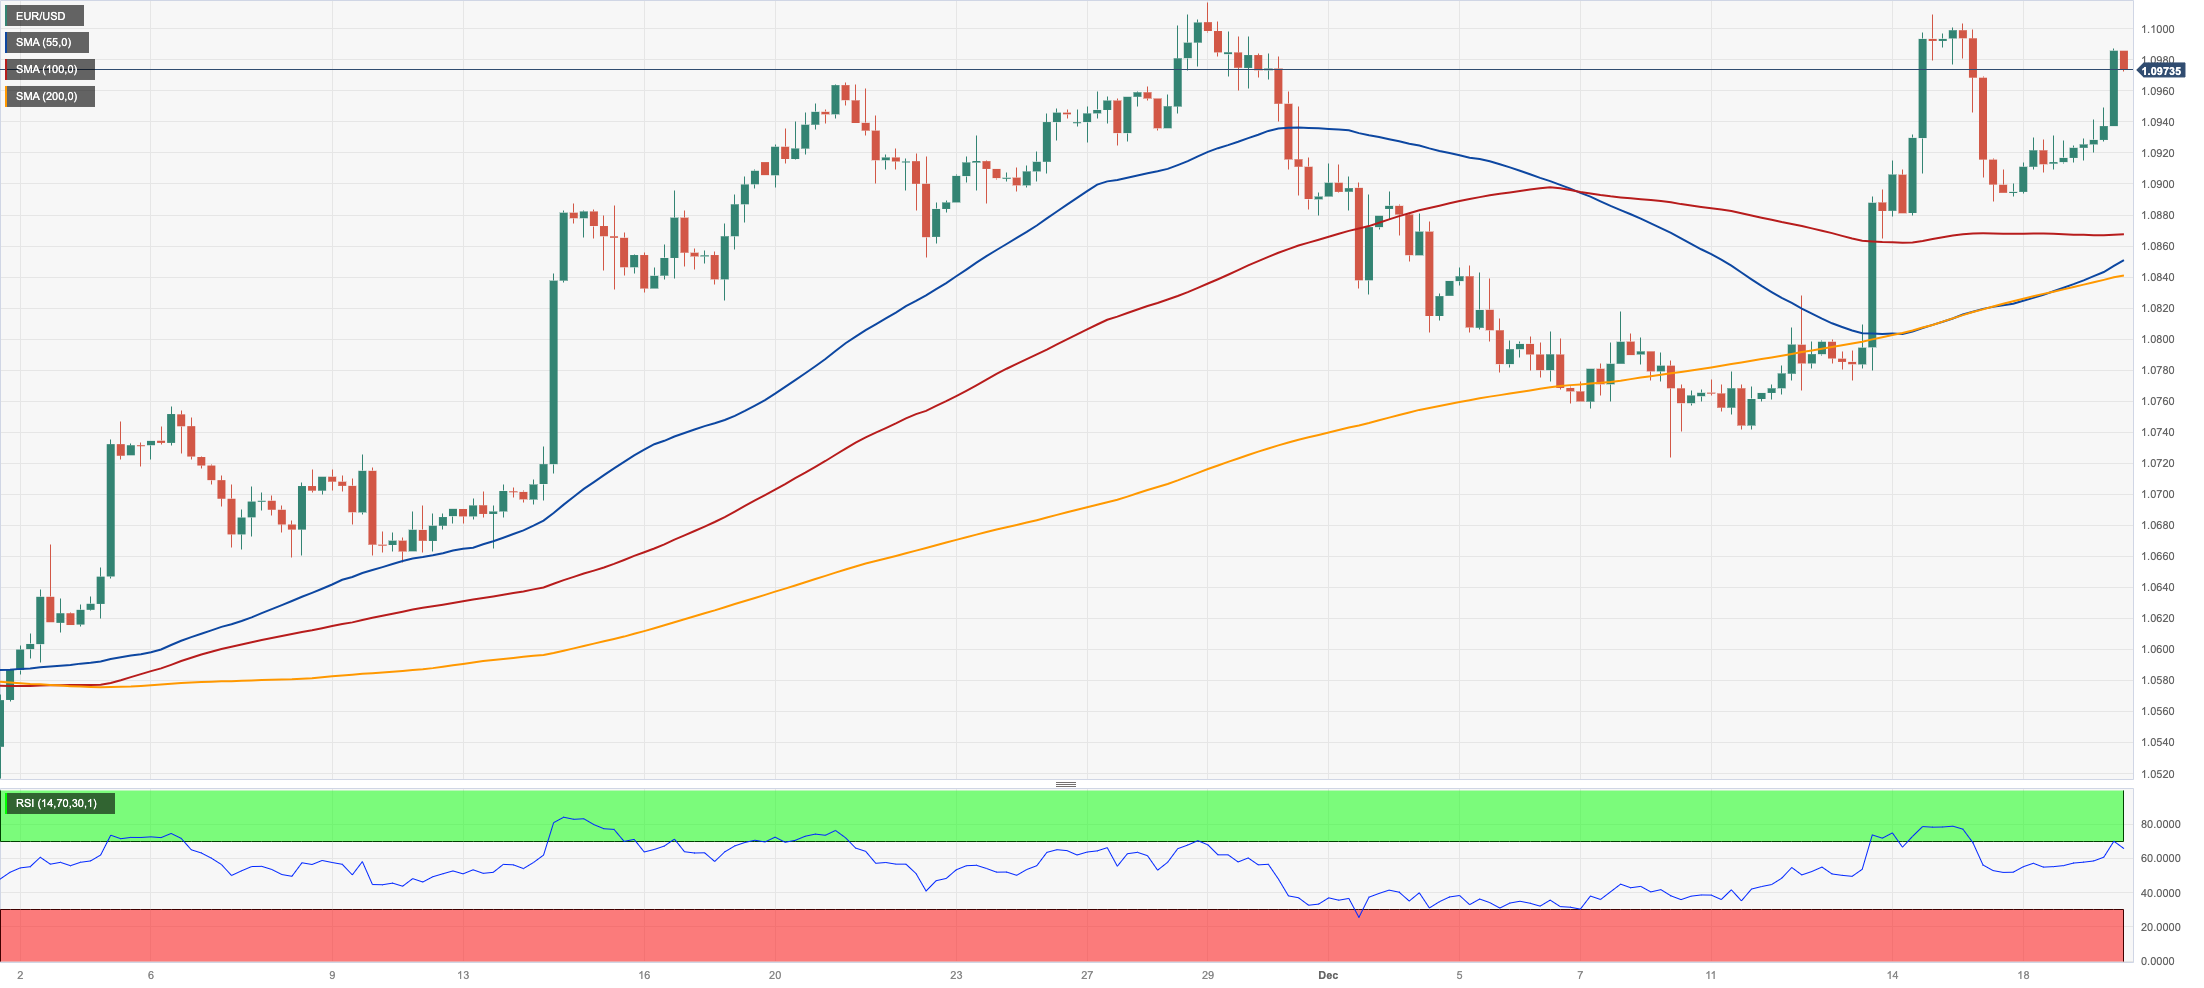
The December high of 1.1009 (December 14) comes immediately on the upside for EUR/USD before the November top of 1.1017. Following that, the August peak of 1.1064 (August 10) and the weekly high of 1.1149 (July 27) are both achievable, all before the 2023 top of 1.1275 (July 18). However, if the pair goes below the 200-day SMA at 1.0830, it could most likely revisit the December low of 1.0723 (December 8), which appears to be supported by the preliminary 55-day SMA of 1.0735. The loss of the latter might resuscitate a challenge to the weekly low of 1.0495 (October 13), prior to the 2023 low of 1.0448 (October 3) and the round level of 1.0400. The RSI on the daily chart surpassed the 61 yardstick.
Resistance levels: 1.1009 1.1017 1.1064 (4H chart)
Support levels: 1.0888 1.0833 1.0723 (4H chart)
USDJPY
The dovish hold by the BoJ at its event during early trade in combination with the prevailing risk-on sentiment weighed strongly on the Japanese yen and motivated USD/JPY to rise to multi-day highs near the 145.00 hurdle on Tuesday.
Indeed, extra weakness in the greenback favoured investors’ demand for riskier assets, while diminishing US and Japanese yields also accompanied the daily decline in spot.
Back to the BoJ, it unanimously opted to maintain the interest rates at -0.1% at its last meeting of the year. Simultaneously, it reaffirmed its commitment to the yield curve policy, which bases itself on the 1% upper limit for 10-year JGBs.
In addition, the BoJ anticipated a steady recovery in Japan's economy while noting a moderate increase in inflation expectations. Forecasts indicated that the CPI will surpass 2% over FY 2024. Additionally, the bank plans to meticulously scrutinize foreign exchange and market dynamics to evaluate their influence on the economy and price levels.
At his press conference, Governor K. Ueda was reported as saying that further examination is required to determine if a "positive" wage-inflation cycle has become entrenched. He added that any fundamental decrease in real wages won't hinder the normalization of monetary policy if wages are anticipated to increase and consumer price rises continue to slow, potentially turning real wages positive once more. He also stated that if they were to exit the negative rate, interest rates would increase slightly. However, he mentioned that inflation-adjusted real borrowing costs would stay low, ensuring sustained accommodative monetary conditions.
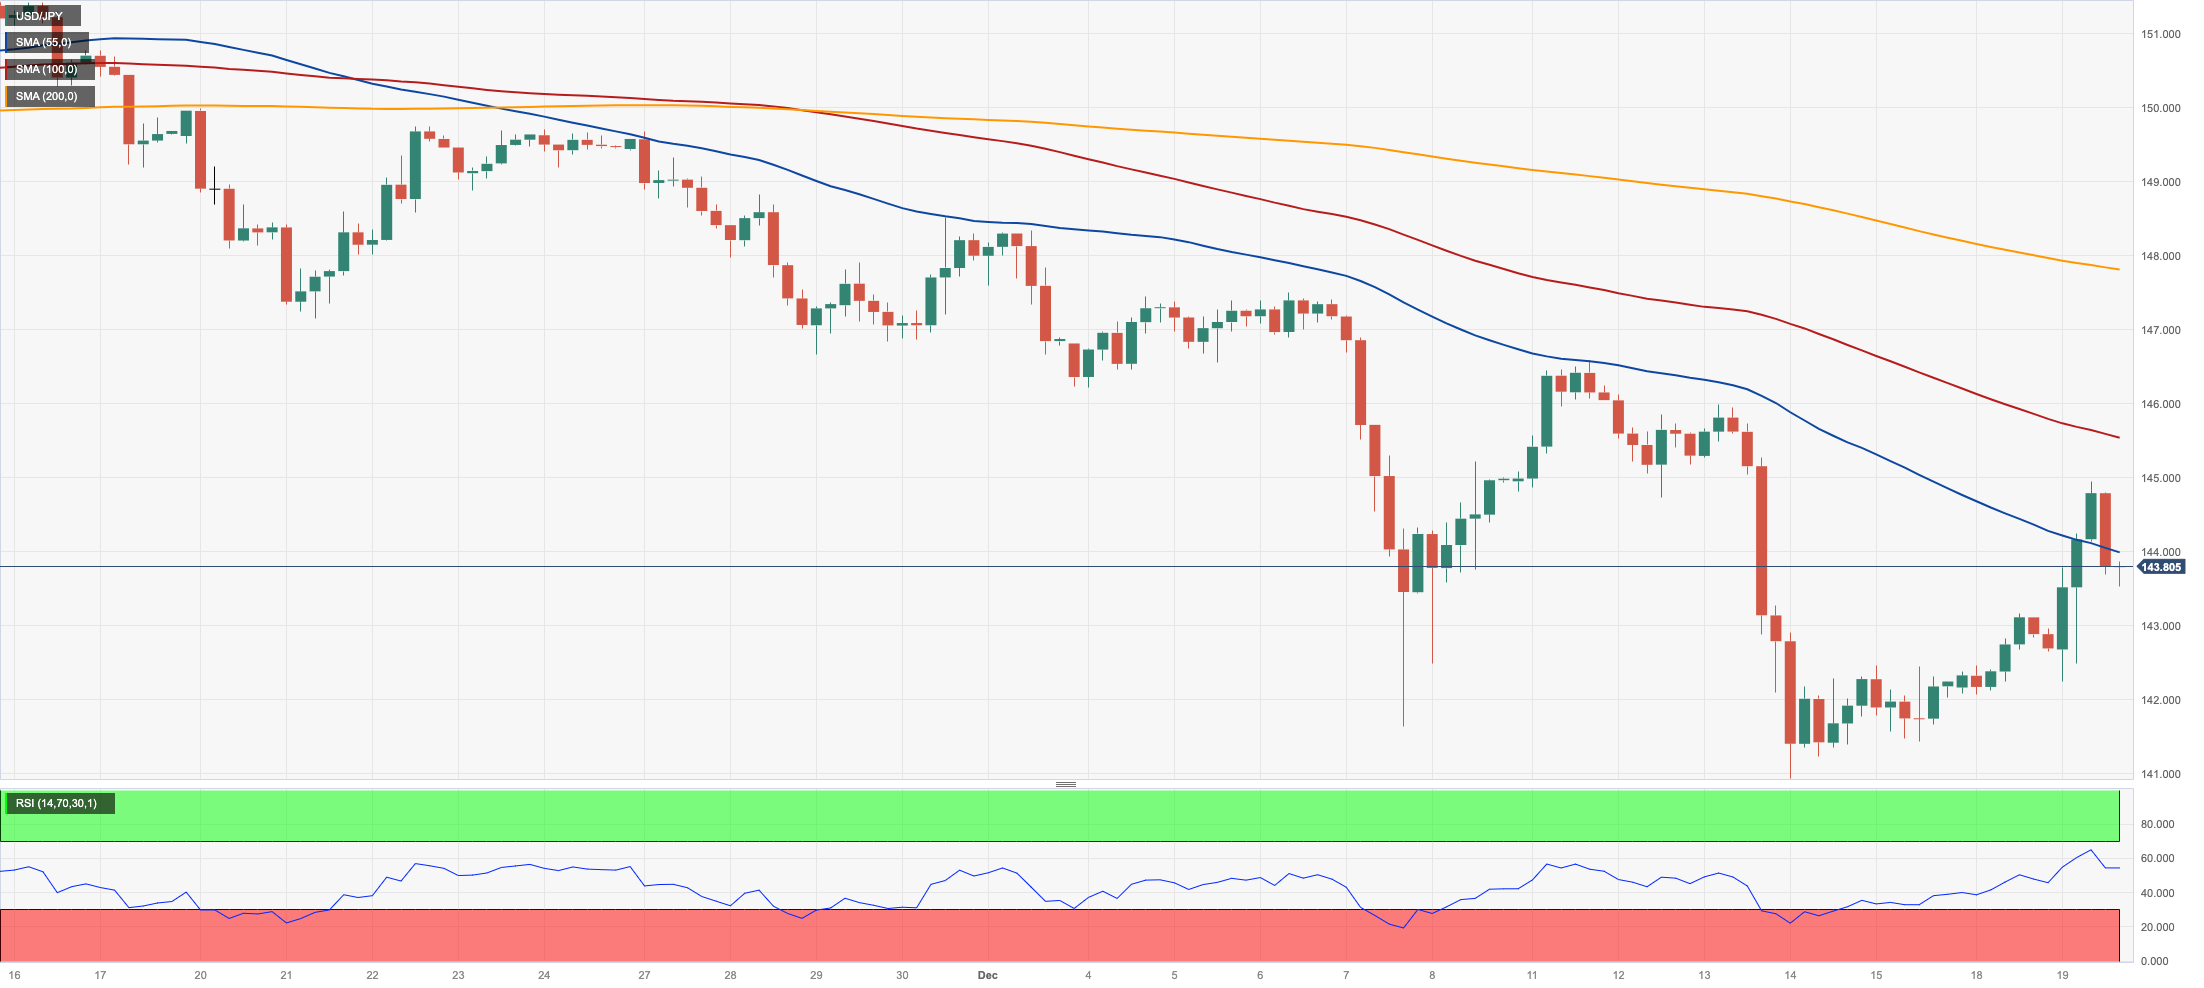
Further recovery currently aims for the transitory 55-day SMA of 148.53, which is ahead of the 2023 peak of 151.90 (November 13) and the 2022 high of 151.94 (October 21), all of which are prior to the round number of 152.00. On the other hand, the December low of 140.94 (December 14) is projected to provide early support. The breach of the latter allows for a test of the round level of 140.00 before the July low of 137.23 (July 14). The RSI increased to around 39.
Resistance levels: 144.95 146.58 147.90 (4H chart)
Support levels: 140.94 138.05 137.23 (4H chart)
GBPUSD
The resumption of buying interest in the risk complex helped the British pound leave behind two consecutive daily pullbacks vs. the dollar, propelling GBP/USD back above 1.2700 the figure on Tuesday.
Indeed, the persistent selling pressure in the greenback lent much-needed legs to the quid and sponsored a marked bounce in Cable, regaining the area north of 1.2700 despite UK 10-year gilt yields dropping to lows last seen in April near 3.60%.
In the UK, CBI Industrial Trends Orders improved to -23 in December (from -35).
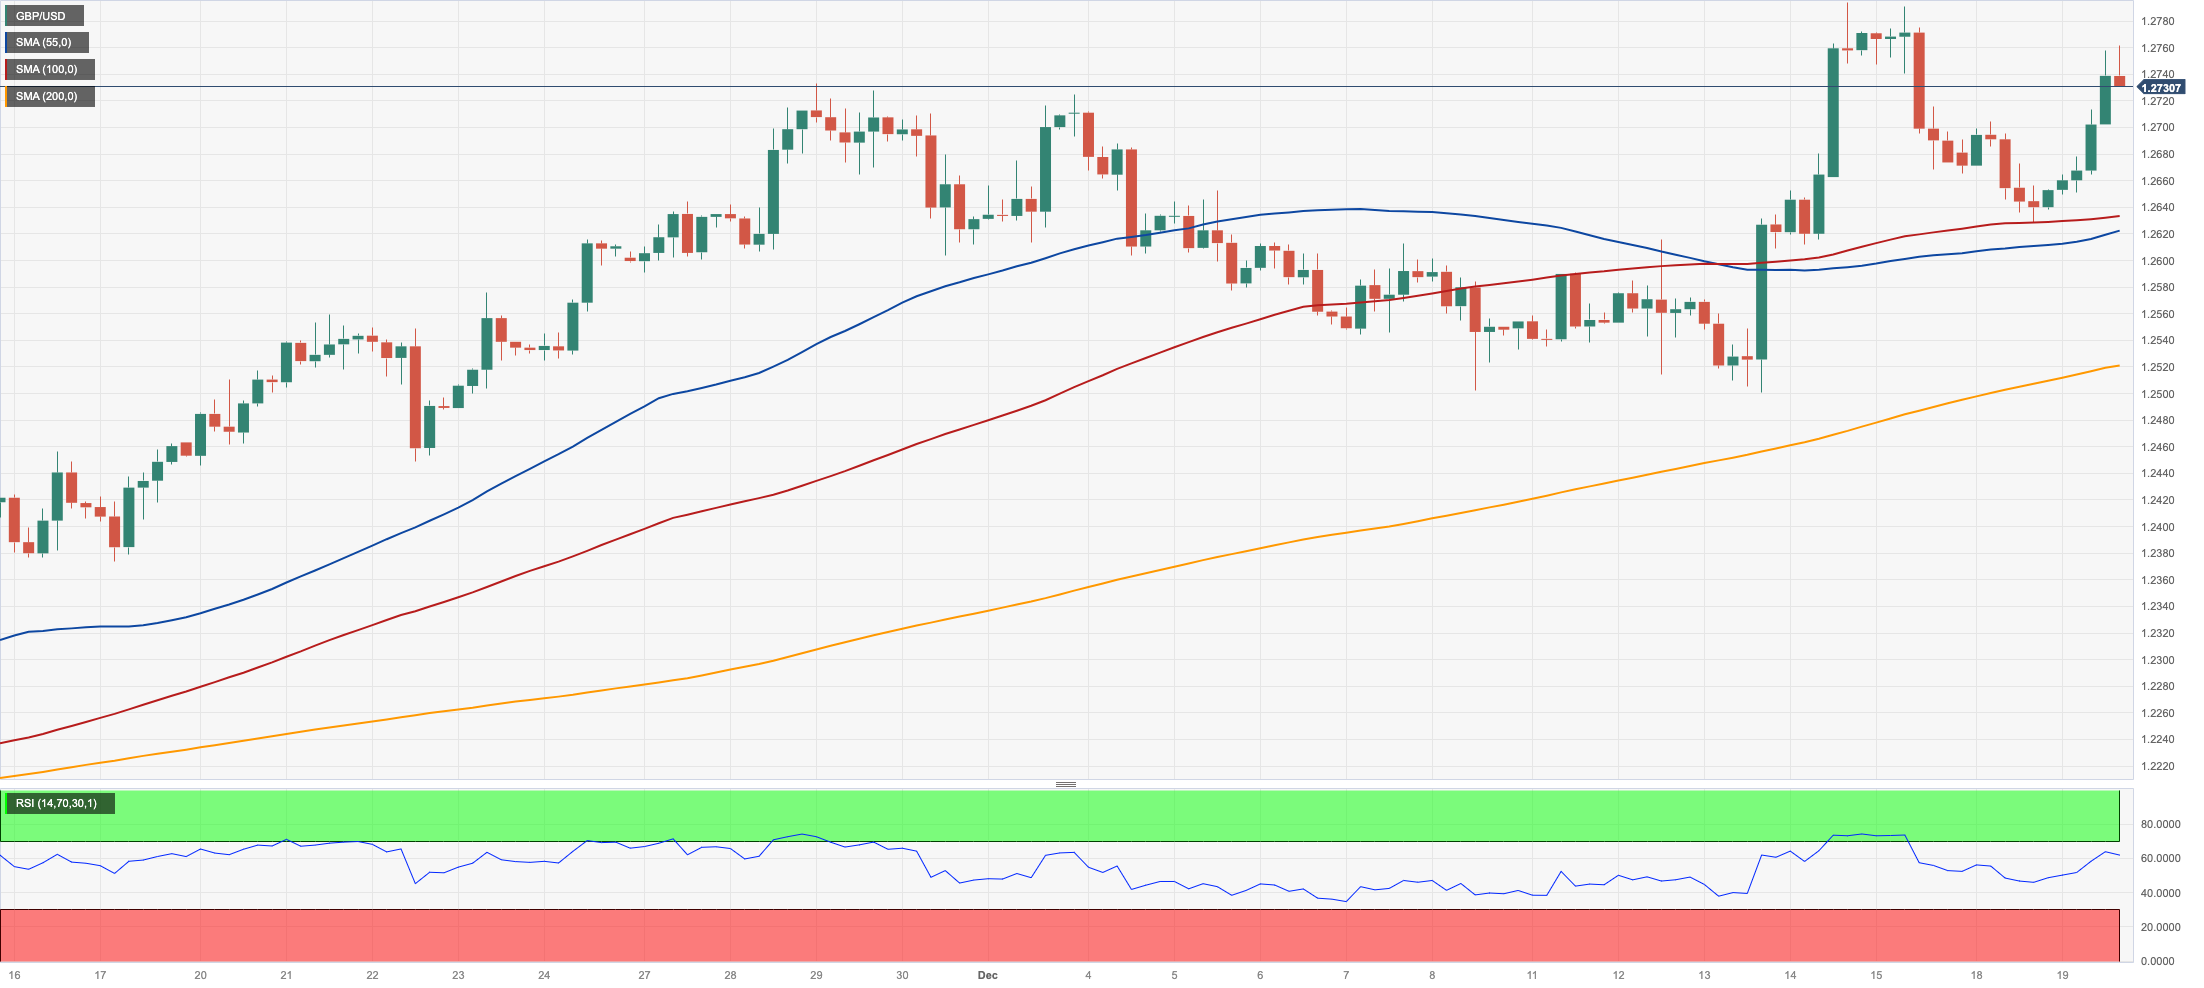
Further recovery could see GBP/USD revisit the December top of 1.2793 (December 14), which is followed by weekly peaks of 1.2818 (August 10) and 1.2995 (July 27), all of which are above the crucial 1.3000 barrier. On the downside, there is immediate contention at the 200-day SMA at 1.2507, just ahead of the December low of 1.2500 (December 13). If the latter is lost, the emphasis will turn to the temporary 55-day SMA at 1.2387 and the weekly low of 1.2187 (November 10). From here, the October low of 1.2037 (October 3), the critical 1.2000 level, and the 2023 bottom of 1.1802 (March 8) are all aligned down. The daily RSI leapt past the 62 mark.
Resistance levels: 1.2793 1.2800 1.2995 (4H chart)
Support levels: 1.2628 1.2500 1.2448 (4H chart)
AUDUSD
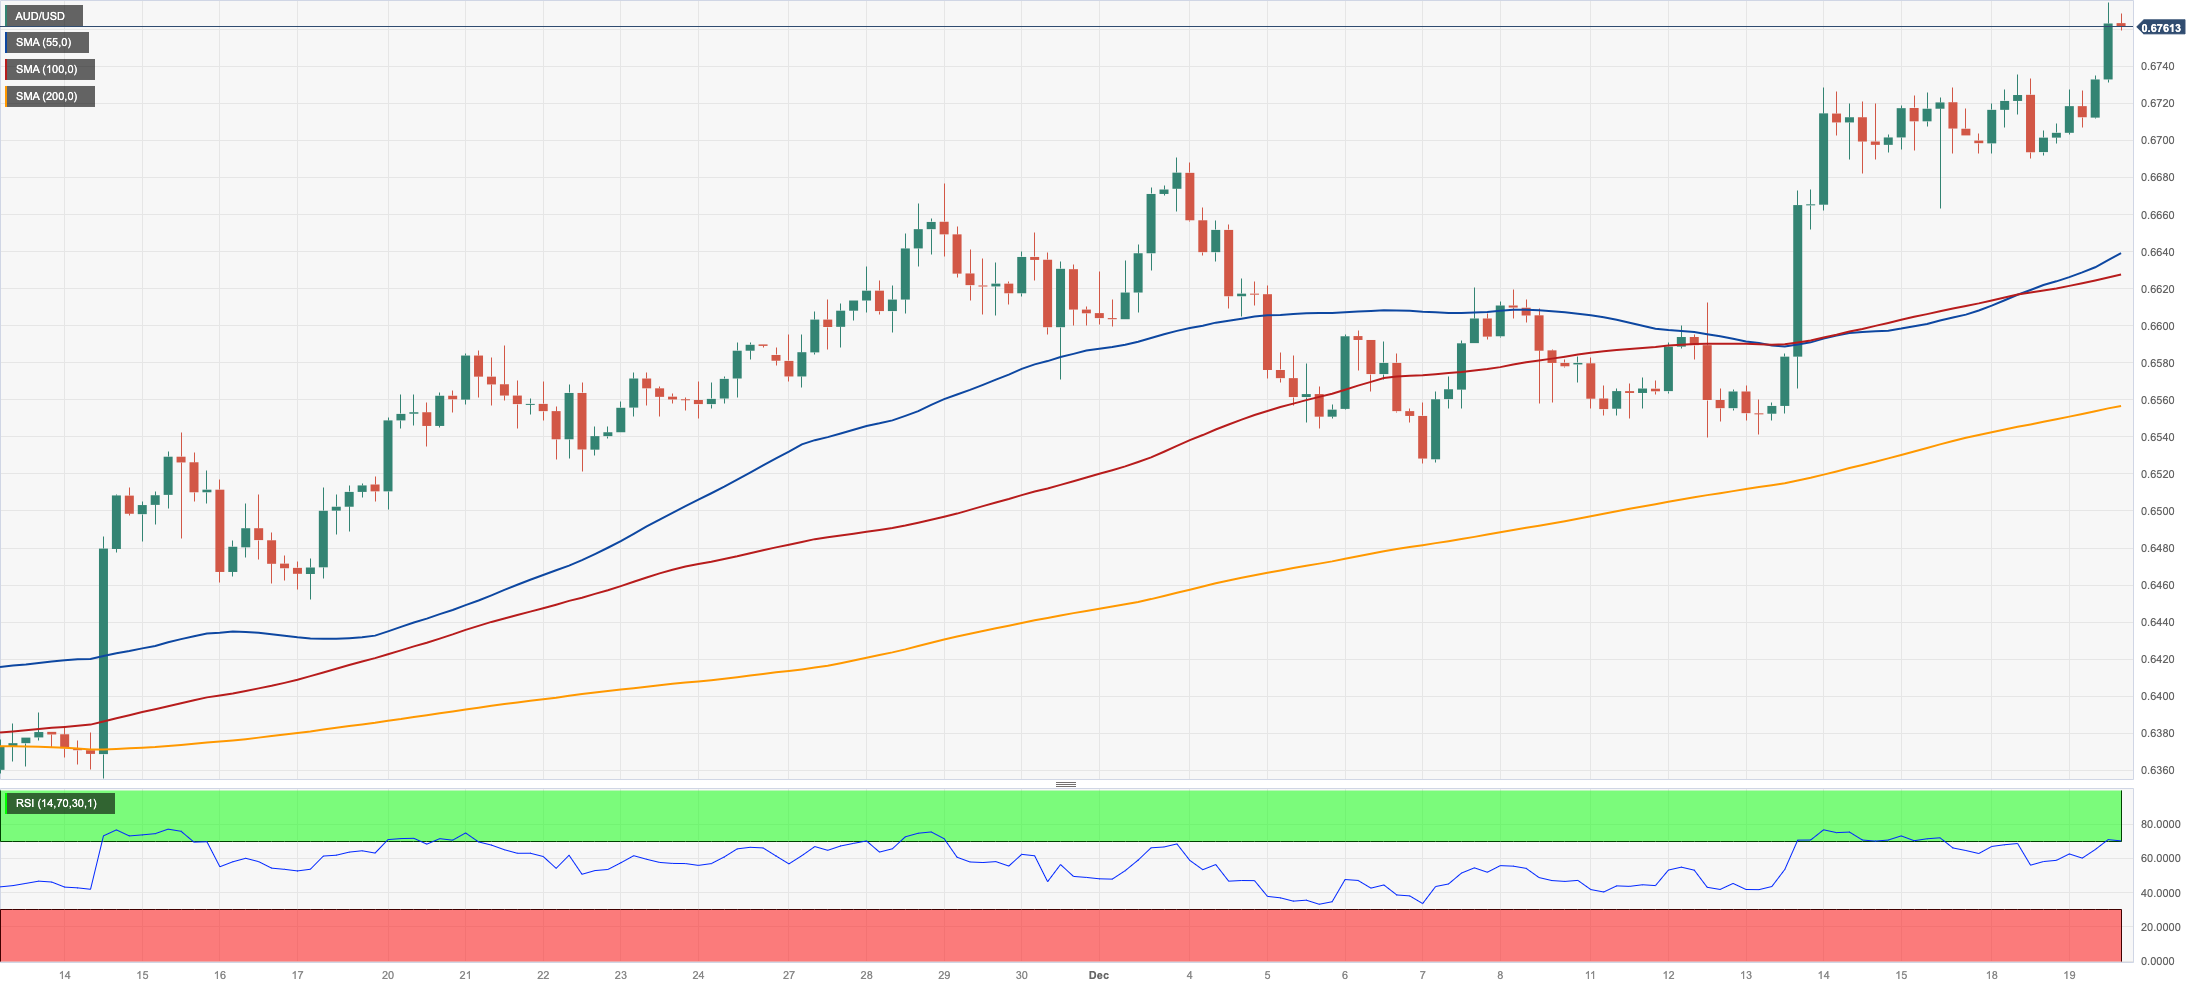
The rally in the Aussie dollar remained well and sound on Tuesday, prompting AUD/USD to reach new five-month highs past 06770, up for the fifth session in a row.
In fact, the persevering appetite for risk-associated assets in combination with broad-based positive developments from the commodity galaxy lent extra wings to the pair, while the hawkish tilt from the RBA Minutes also contributed to the continuation of the uptrend.
On the latter, it was revealed that the bank deliberated the possibility of a rate hike but ultimately concluded that maintaining steady rates was a more compelling decision. Additionally, members preferred some prudence ahead of incoming data to assess further decisions on monetary policy. Furthermore, the bank expressed the view that allowing maturing bonds to roll off naturally, resulting in a passive reduction of its balance sheet, remained an appropriate course of action.
The breakout of the December peak of 0.6774 (December 19) might open the way for a journey to the July high of 0.6894 (July 14) and the June top of 0.6899 (June 16), all of which are placed prior to the crucial 0.7000 threshold. The AUD/USD, on the other hand, is finding early support at the critical 200-day SMA of 0.6576, just ahead of the December low of 0.6525 (December 7). South of here, the 2023 low of 0.6270 (October 26) emerges before the round level of 0.6200 and the 2022 low of 0.6169 (October 13). The daily RSI improved to the proximity of the 70 yardstick.
Resistance levels: 0.6774 0.6821 0.6846 (4H chart)
Support levels: 0.6663 0.6551 0.6525 (4H chart)
GOLD
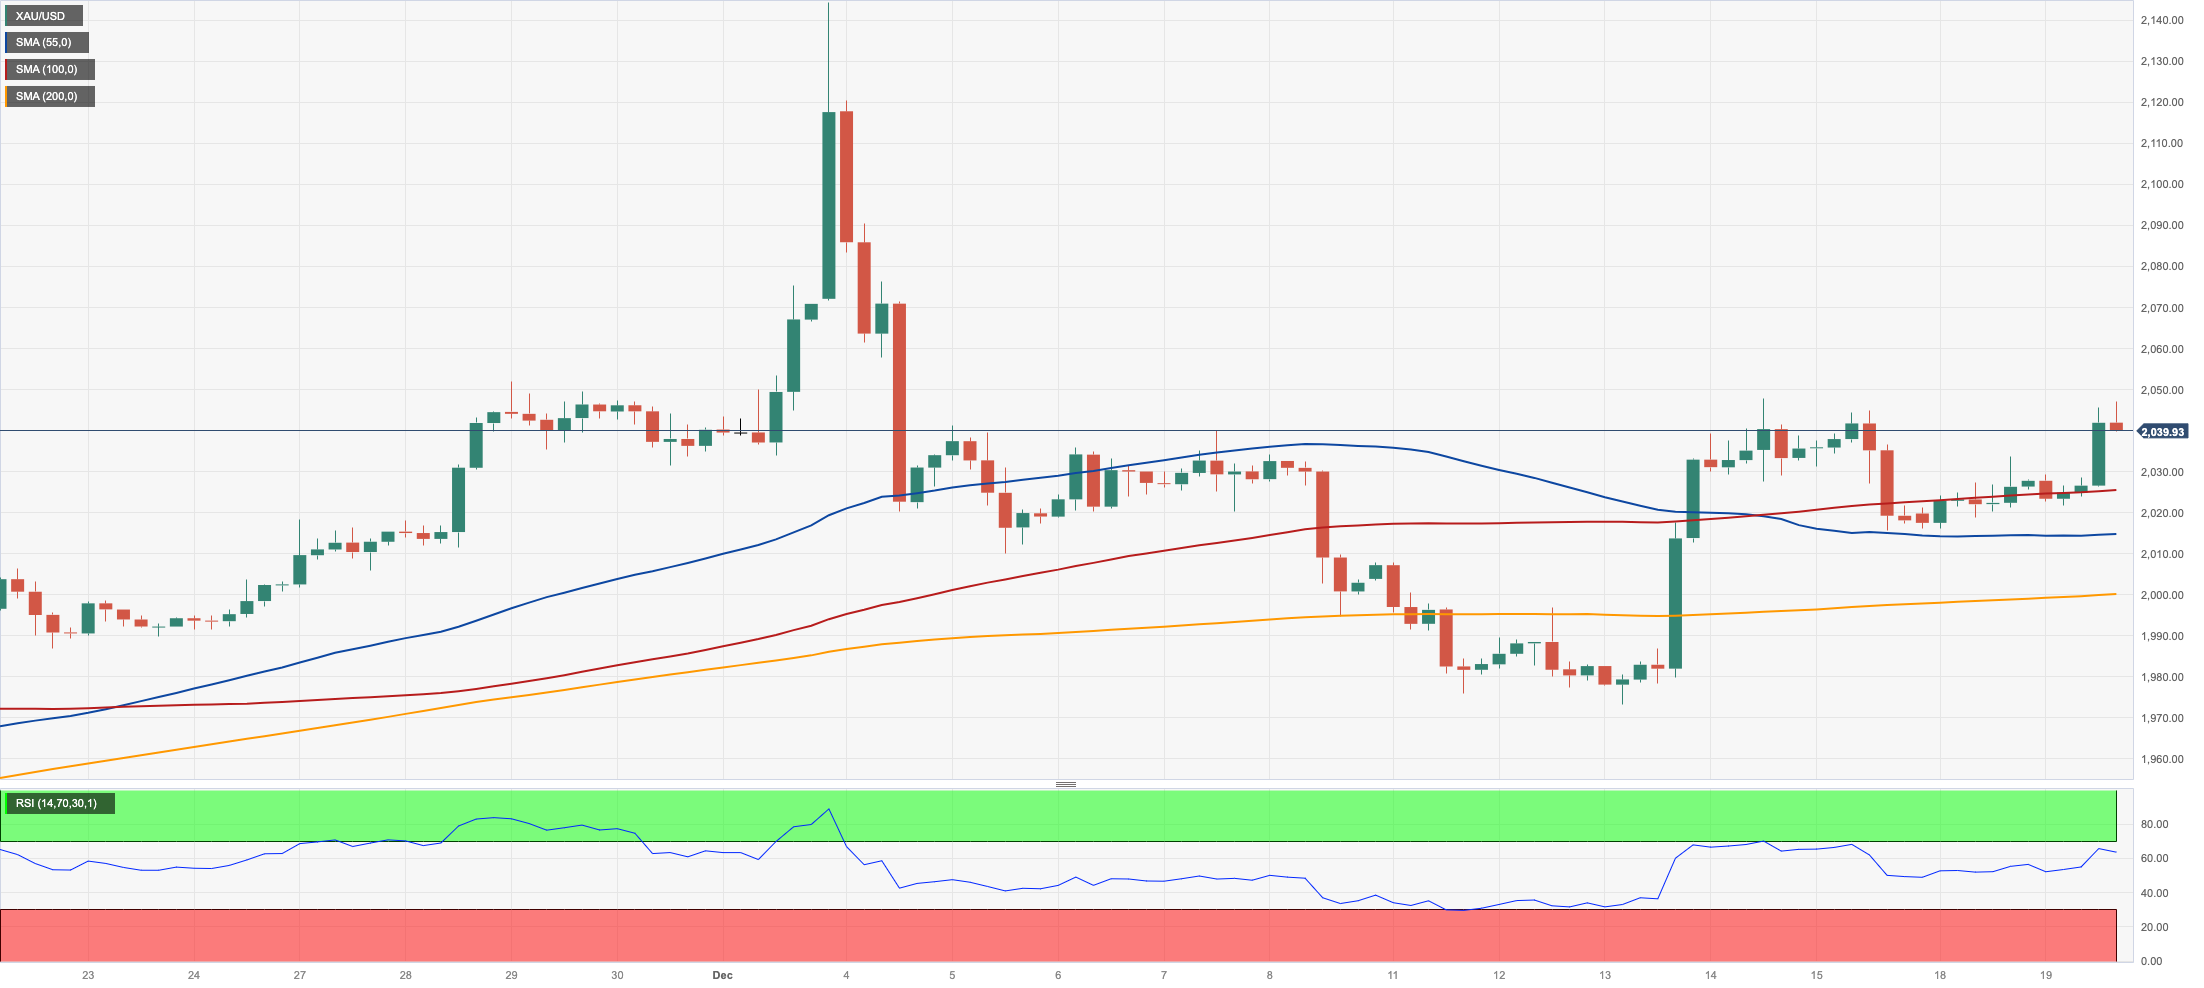
Prices of the ounce troy of the yellow metal added to the positive start of the week and revisited the area of recent highs around $2050 on Tuesday.
Further weakness in the greenback and the march south in US yields across different maturities favoured the continuation of the upward bias in the precious metal and seem to have offset the dominating risk-on mood in the global markets.
The ongoing recovery in bullion also appears propped up by the firm perception that the Fed might start reducing its interest rates at some point in early Q2 2024.
If gold prices continue to increase, the all-time high of $2150 (December 4) might be reached again shortly. On the contrary, further retracement would be faced with immediate support at the December low of $1973 (December 13). When this level is breached, bullion is projected to go put the 200-day SMA of $1956 to the test, ahead of the November low of $1931 (November 13). The October low of $1810 (October 6), the 2023 bottom of $1804 (February 28), and finally the critical $1800 contention zone are all feasible from here.
Resistance levels: $2047 $2149 (4H chart)
Support levels: $2015 $1999 $1973 (4H chart)
CRUDE WTI
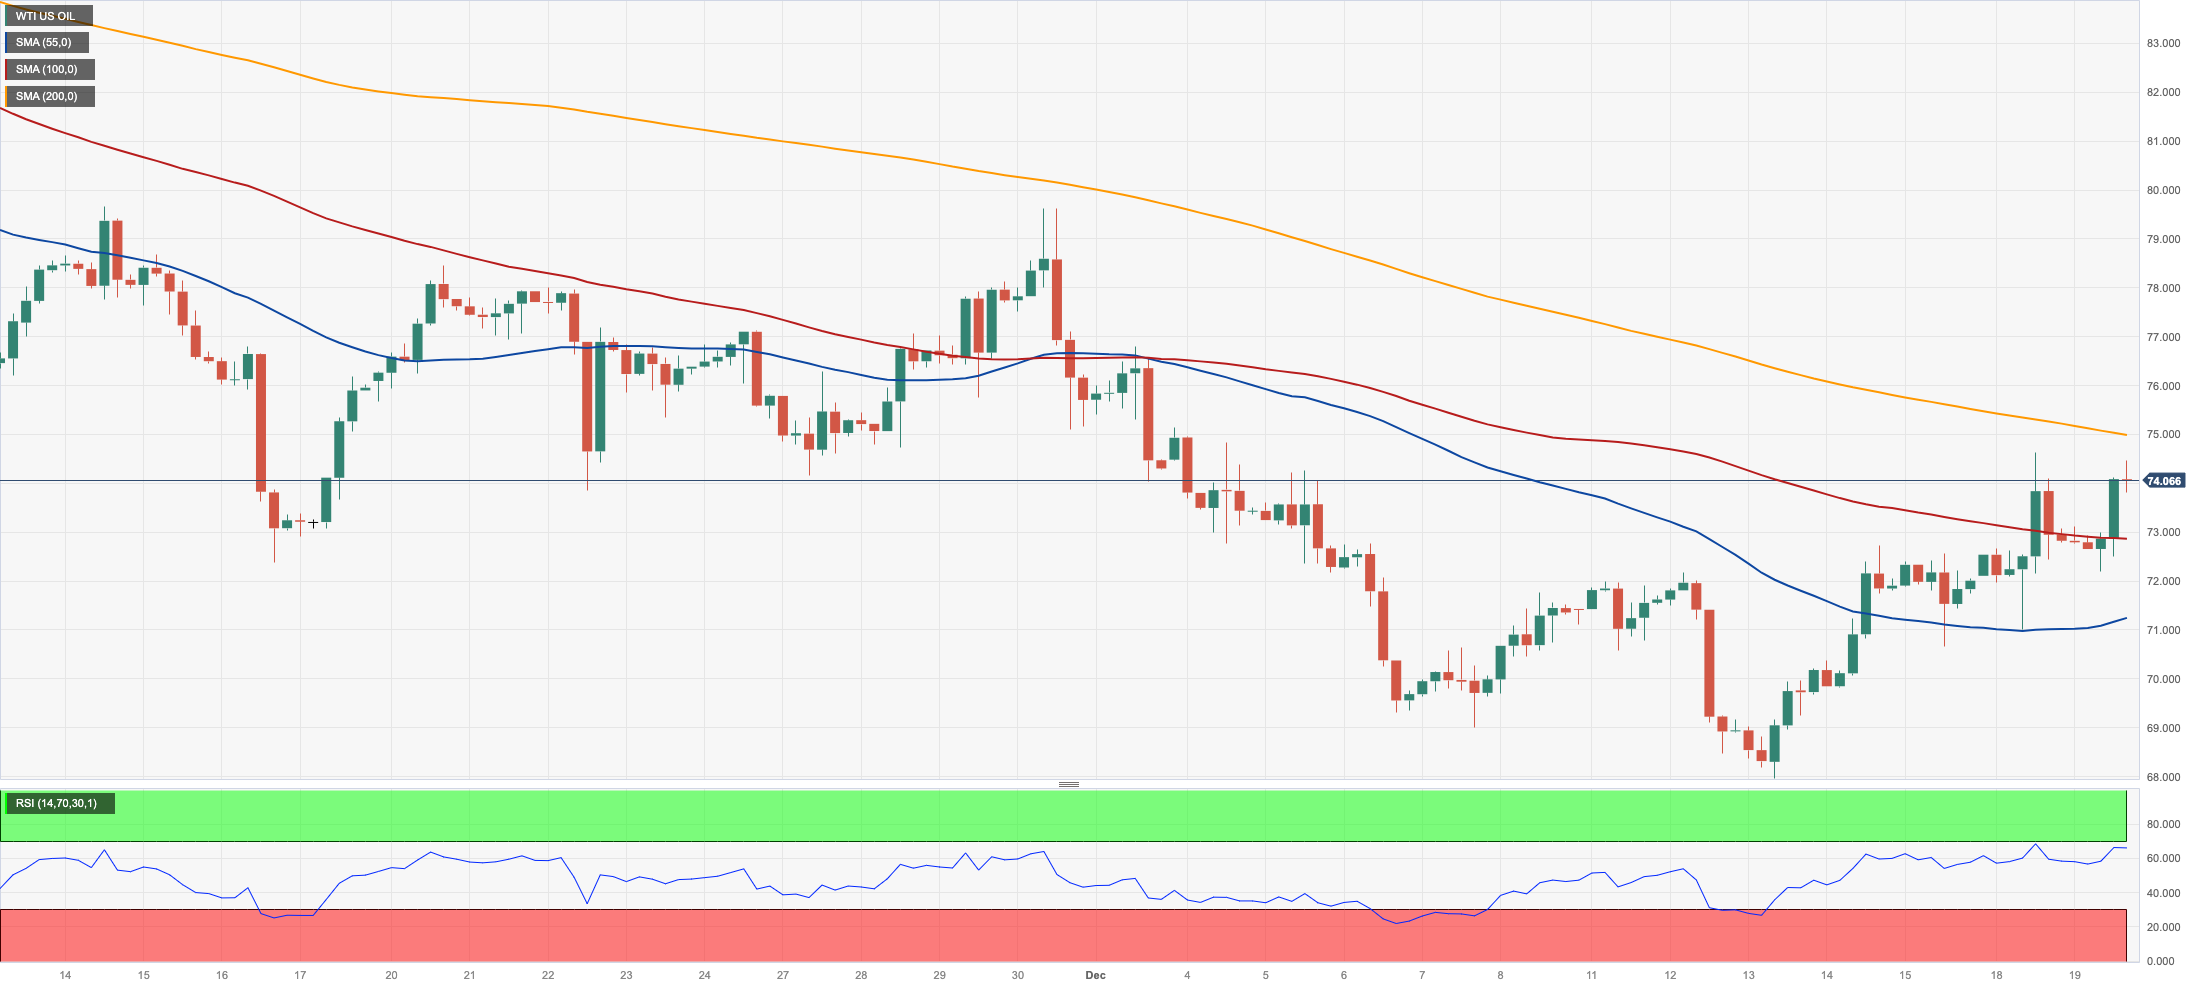
Prices of the American benchmark for sweet light crude oil extended their constructive behaviour and flirted with multi-session tops north of the $74.00 mark per barrel on Tuesday.
Prices of crude oil rose further on the back of persistent geopolitical concerns and their association with potential supply disruptions following recent events in the Red Sea and the Gulf of Aden, which forced oil companies to re-route their shipments.
That situation, however, is expected to get worse before it gets better after Houthi rebels openly defied the newly created naval task force, including the US, UK, and France, among other countries.
Further strength for WTI also came from the persevering weakness hurting the greenback.
The 200-day SMA at $77.71 is next on the upside for WTI before the important $80.00 mark, which is followed by the November peak of $80.15 (November 3). Further gains from here may return the market to its weekly high of $89.83 (October 18), seconded by the 2023 top of $94.99 (September 28) and the August 2022 peak of $97.65 (August 30), all preceding the psychological $100.00 mark. In the other direction, a break below the December low of $67.74 (December 13) might trigger a further slide to the 2023 low of $63.61 (May 4) before reaching the critical $60.00 level.
Resistance levels: $74.58 $76.72 $79.56 (4H chart)
Support levels: $67.68 $67.01 $66.77 (4H chart)
DOW JONES
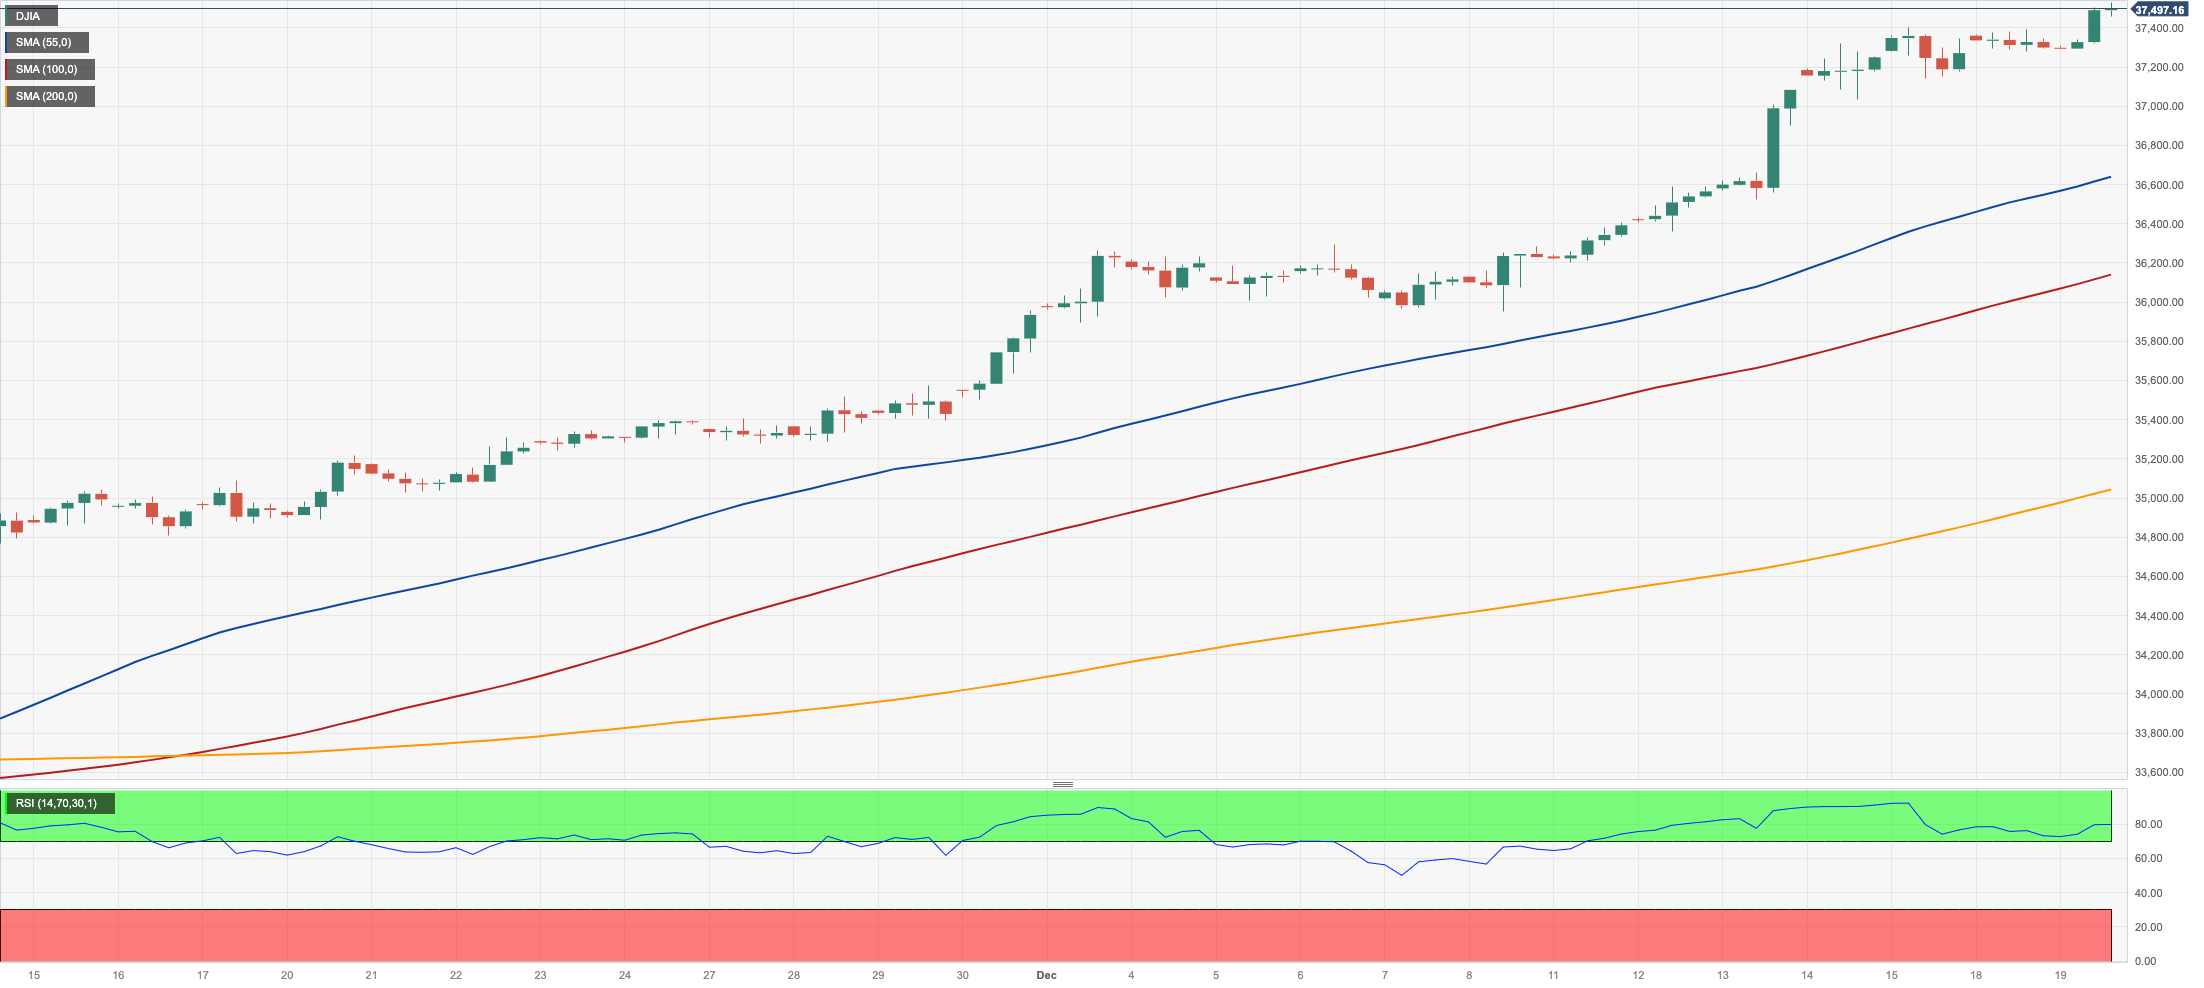
Another day, another record peak in the key Dow Jones.
This time, broad-based gains in US equities lifted the blue-chip reference Dow Jones to a new all-time top north of the 37500 level on Tuesday.
Bolstering the upbeat mood among investors remained the firmer perception that the Fed might start cutting its interest rates around the spring of 2024, while the robust appetite for riskier assets and the weaker dollar also underpinned the optimism.
All in all, the Dow Jones gained 0.51% to 37495, the S&P500 advanced 0.41% to 4760, and the tech-reference Nasdaq Composite rose 0.40% to 14964.
On December 19, the Dow Jones set a new all-time high of 37534. On the flip side, there is some support around the December low of 36010 (December 5) ahead of the crucial 200-day SMA at 34114, which comes prior to the weekly low of 33859 (November 7). Further south, the October bottom of 32327 (October 27) is likely to be tested before the 2023 low of 31429 (March 15) and the 2022 low of 28660 (October 13). The daily RSI surpassed 86, indicating that the market is still extremely overbought.
Top Performers: Walgreen Boots, Caterpillar, Intel
Worst Performers: UnitedHealth, Cisco, Honeywell
Resistance levels: 37534 (4H chart)
Support levels: 36021 35701 34615 (4H chart)
MACROECONOMIC EVENTS

All Information & Updates provided by:

All information relating to the financial markets available on this page has been prepared and issued by FXStreet (Forexstreet SL, Spain, Reg: B62498233) on the basis of publicly available information and all information believed to be reliable and does not conflict with Kuwaiti local laws, and all necessary care has been taken to before the company to ensure that the facts mentioned are correct from the source.
NCM Investment nor any of its directors or employees shall in any way be held responsible for the contents of this news, and the information contained on this page is intended only to provide clients with publicly available information and should not be construed as investment advice, report or analysis and/or constitute an offer or invitation to buy or sell financial instruments of any kind.
RISK WARNING: Forex and CFDs are highly risky leveraged products, as losses can exceed deposits. Please ensure you understand all the risks and take independent advice if necessary. NCM will segregate the clients based on the criteria of the regulator and its bylaws. NCM does not provide any advisory service; the material published does not constitute advice or a recommendation for a transaction in any financial instrument. NCM accepts no responsibility for any use of the content presented and any consequences of that use. Anyone acting on the information provided does so at their own risk.