
- Contact Us:
-

-

-

-


Daily Market Updates
21 Dec 2023
EURUSD
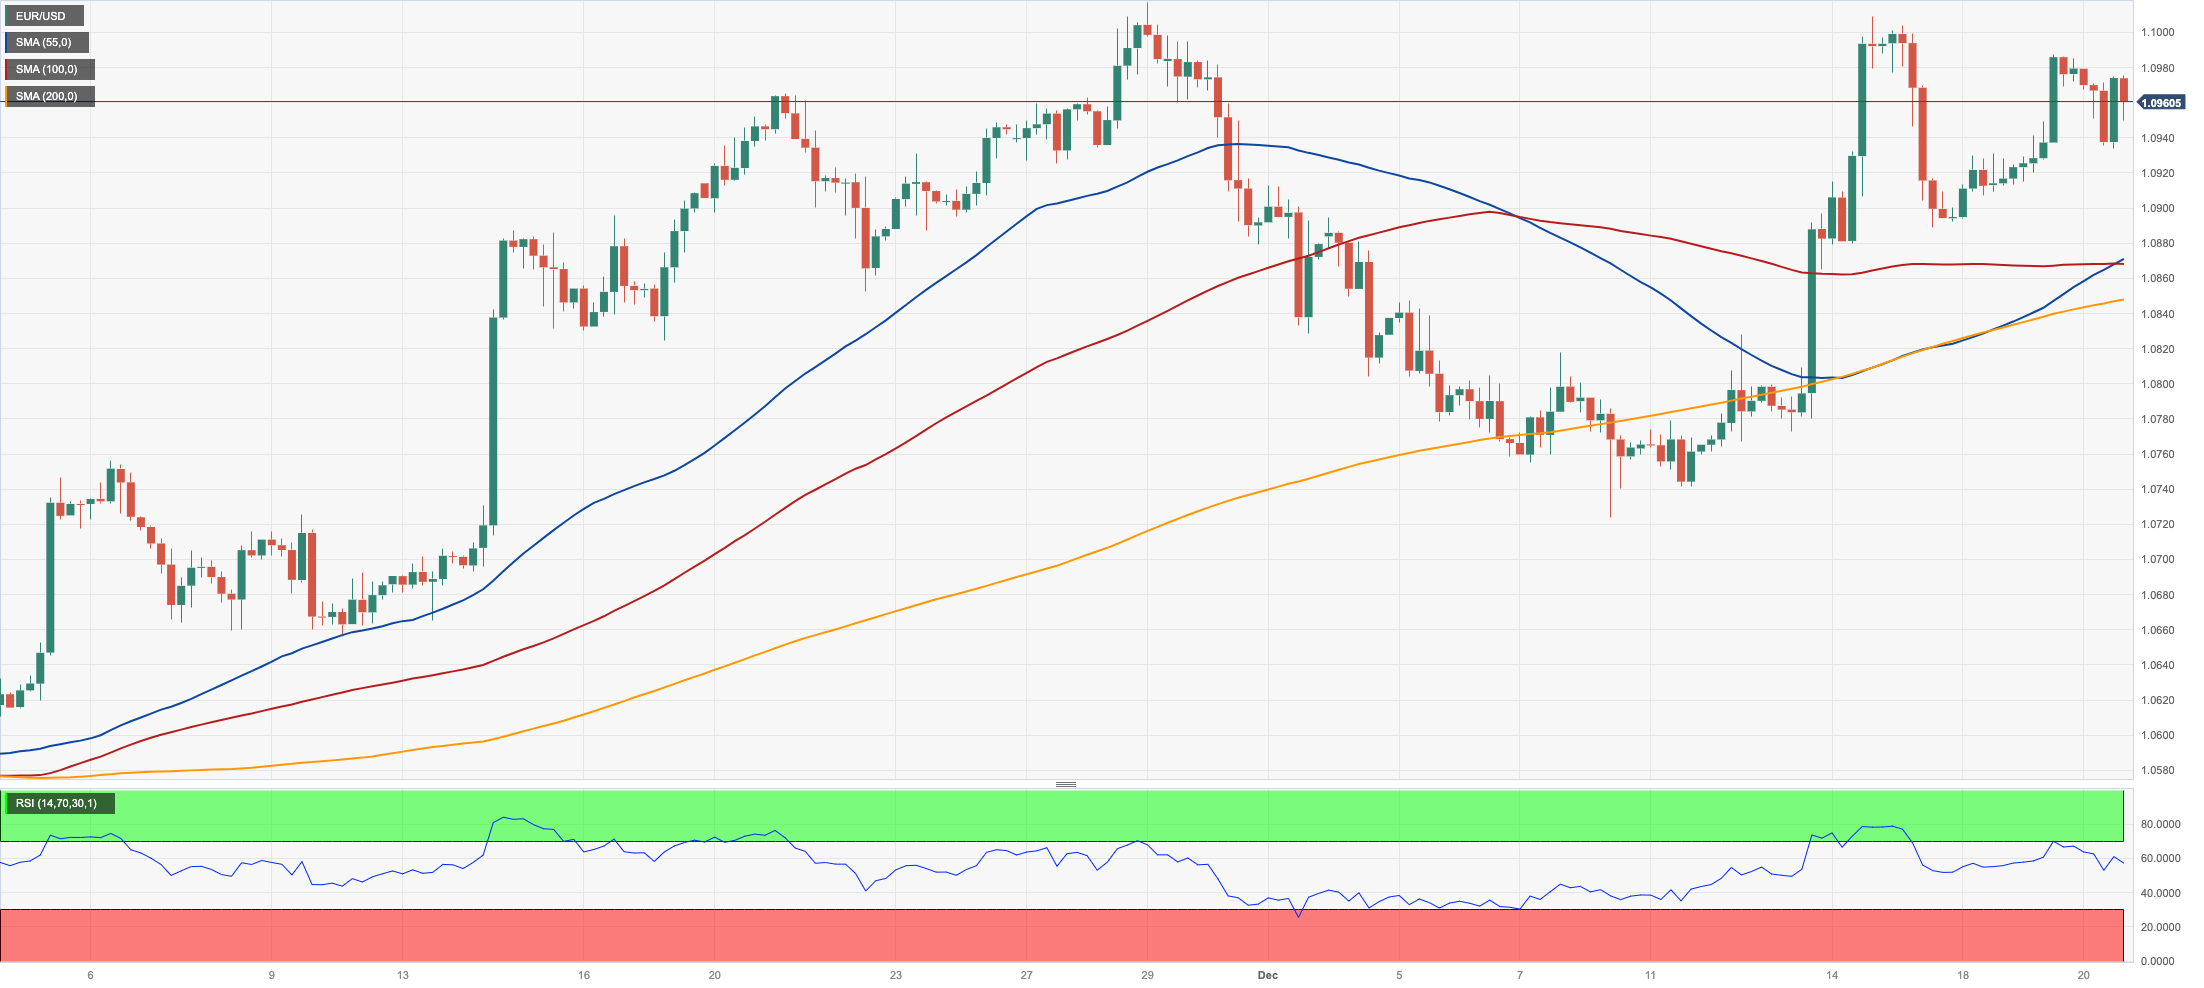
The decent recovery in the greenback put recent gains in the risk-linked galaxy under scrutiny on Wednesday, motivating EUR/USD to surrender some of its latest gains and revisit the 1.0930.
On the other side of the equation, the USD Index (DXY) regained some balance and challenged the 102.50 zone, where some resistance appears to have turned up.
The corrective decline in spot was also in tandem with declining yields in both the US and German money markets, against the backdrop of increasing geopolitical effervescence.
Still around the greenback and following last week’s Fed gathering, P. Harker (Atlanta Fed) stated that they didn't need to raise rates anymore and added that the soft landing process would likely be bumpy, mentioning that many things could potentially thwart a soft landing.
On the domestic calendar, Consumer Confidence tracked by GfK in Germany improved to -25.1 for the month of January, while the advance Consumer Confidence gauge for the euro bloc is expected to have ticked higher to -15.1 in December, according to the European Commission (EC).
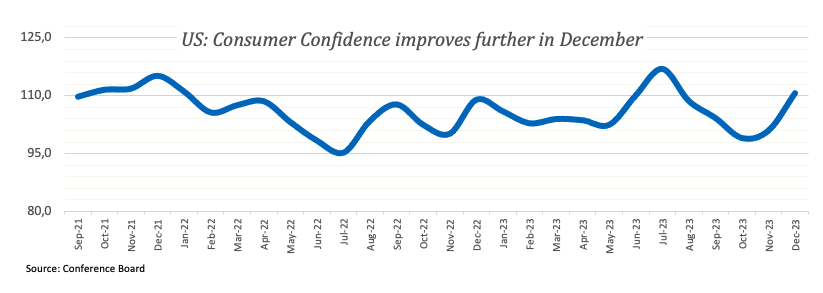
Across the Atlantic, MBA Mortgage Applications contracted 1.5% in the week to December 15, while Consumer Confidence measured by the Conference Board climbed to 110.7 in December and Existing Home Sales rose by 0.8% MoM in November.
The December high of 1.1009 (December 14) comes directly before the November top of 1.1017 for EUR/USD. Following that, the August peak of 1.1064 (August 10) and the weekly high of 1.1149 (July 27) are both reachable before the 2023 top of 1.1275 (July 18). If the pair falls below the 200-day SMA of 1.0832, it will almost certainly revisit the provisional 55-day SMA at 1.0743 prior to the December low of 1.0723 (December 8). The loss of the latter might spark a challenge to the weekly low of 1.0495 (October 13), which comes before the 2023 low of 1.0448 (October 3) and the round level of 1.0400. The RSI on the daily chart dropped below the 59 mark.
Resistance levels: 1.1009 1.1017 1.1064 (4H chart)
Support levels: 1.0888 1.0843 1.0723 (4H chart)
USDJPY
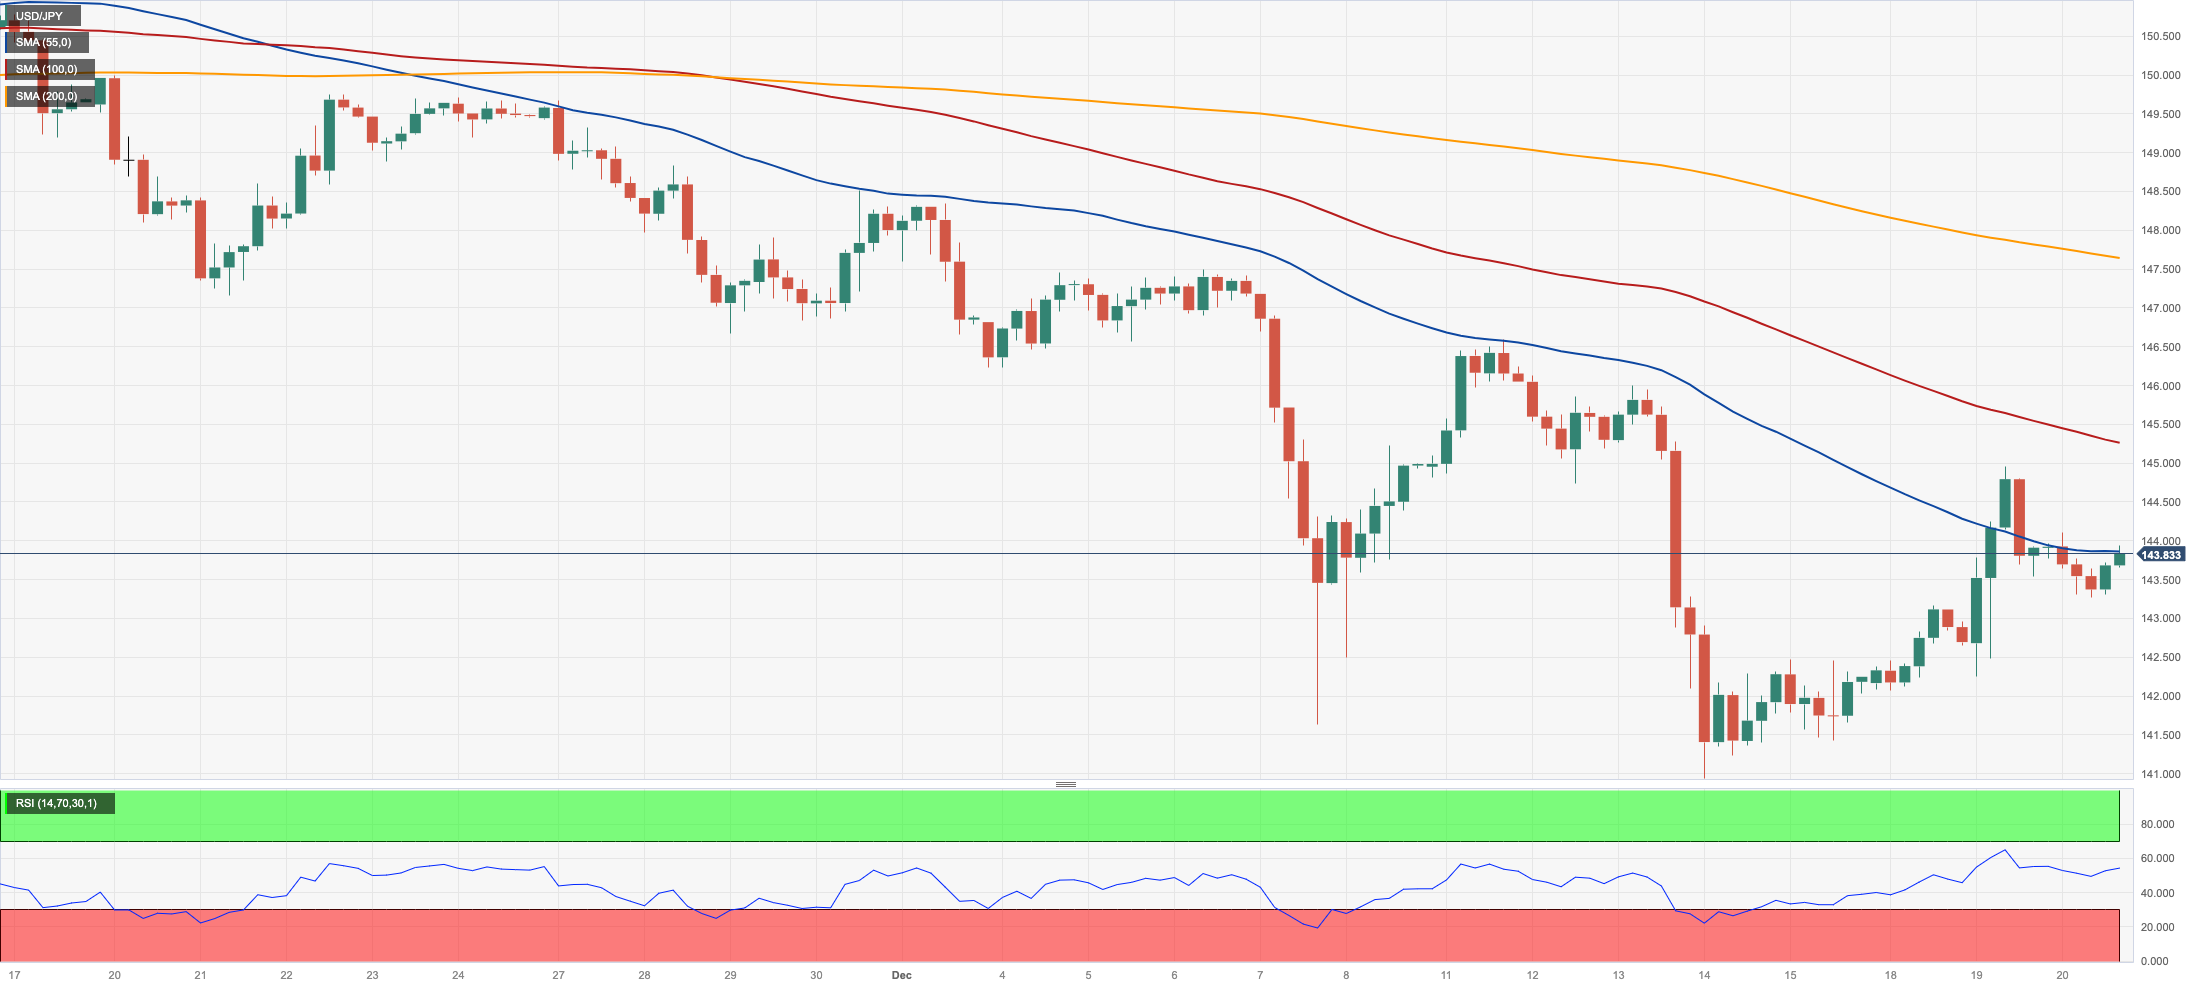
USD/JPY charted an inconclusive session and kept the trade around the 143.80 region midweek following three consecutive days of gains.
The vacillating price action in the pair came after the greenback regained some composure, while US yields retreated across the curve and JGB 10-year yields dropped to levels last seen in late July, near 0.55%.
In the meantime, traders continued to assess the dovish message from the BoJ after the central bank left its policy unchanged at Tuesday’s meeting and showed no rush to abandon the current mega-accommodative stance.
On the calendar, November’s trade deficit widened to ¥776.9B in what was the sole release in “The Land of the Rising Sun.”
Further recovery is aimed toward the weekly top of 144.95 (December 19) prior to the transitory 55-day SMA of 148.44, which is ahead of the 2023 peak of 151.90 (November 13) and the 2022 high of 151.94 (October 21), all of which are previous to the round number of 152.00. The December low of 140.94 (December 14), on the other hand, is expected to provide early support. If the latter is breached, the round level of 140.00 can be tested before the July low of 137.23 (July 14). The RSI settled around the 40 region.
Resistance levels: 144.95 146.58 147.70 (4H chart)
Support levels: 140.94 138.05 137.23 (4H chart)
GBPUSD
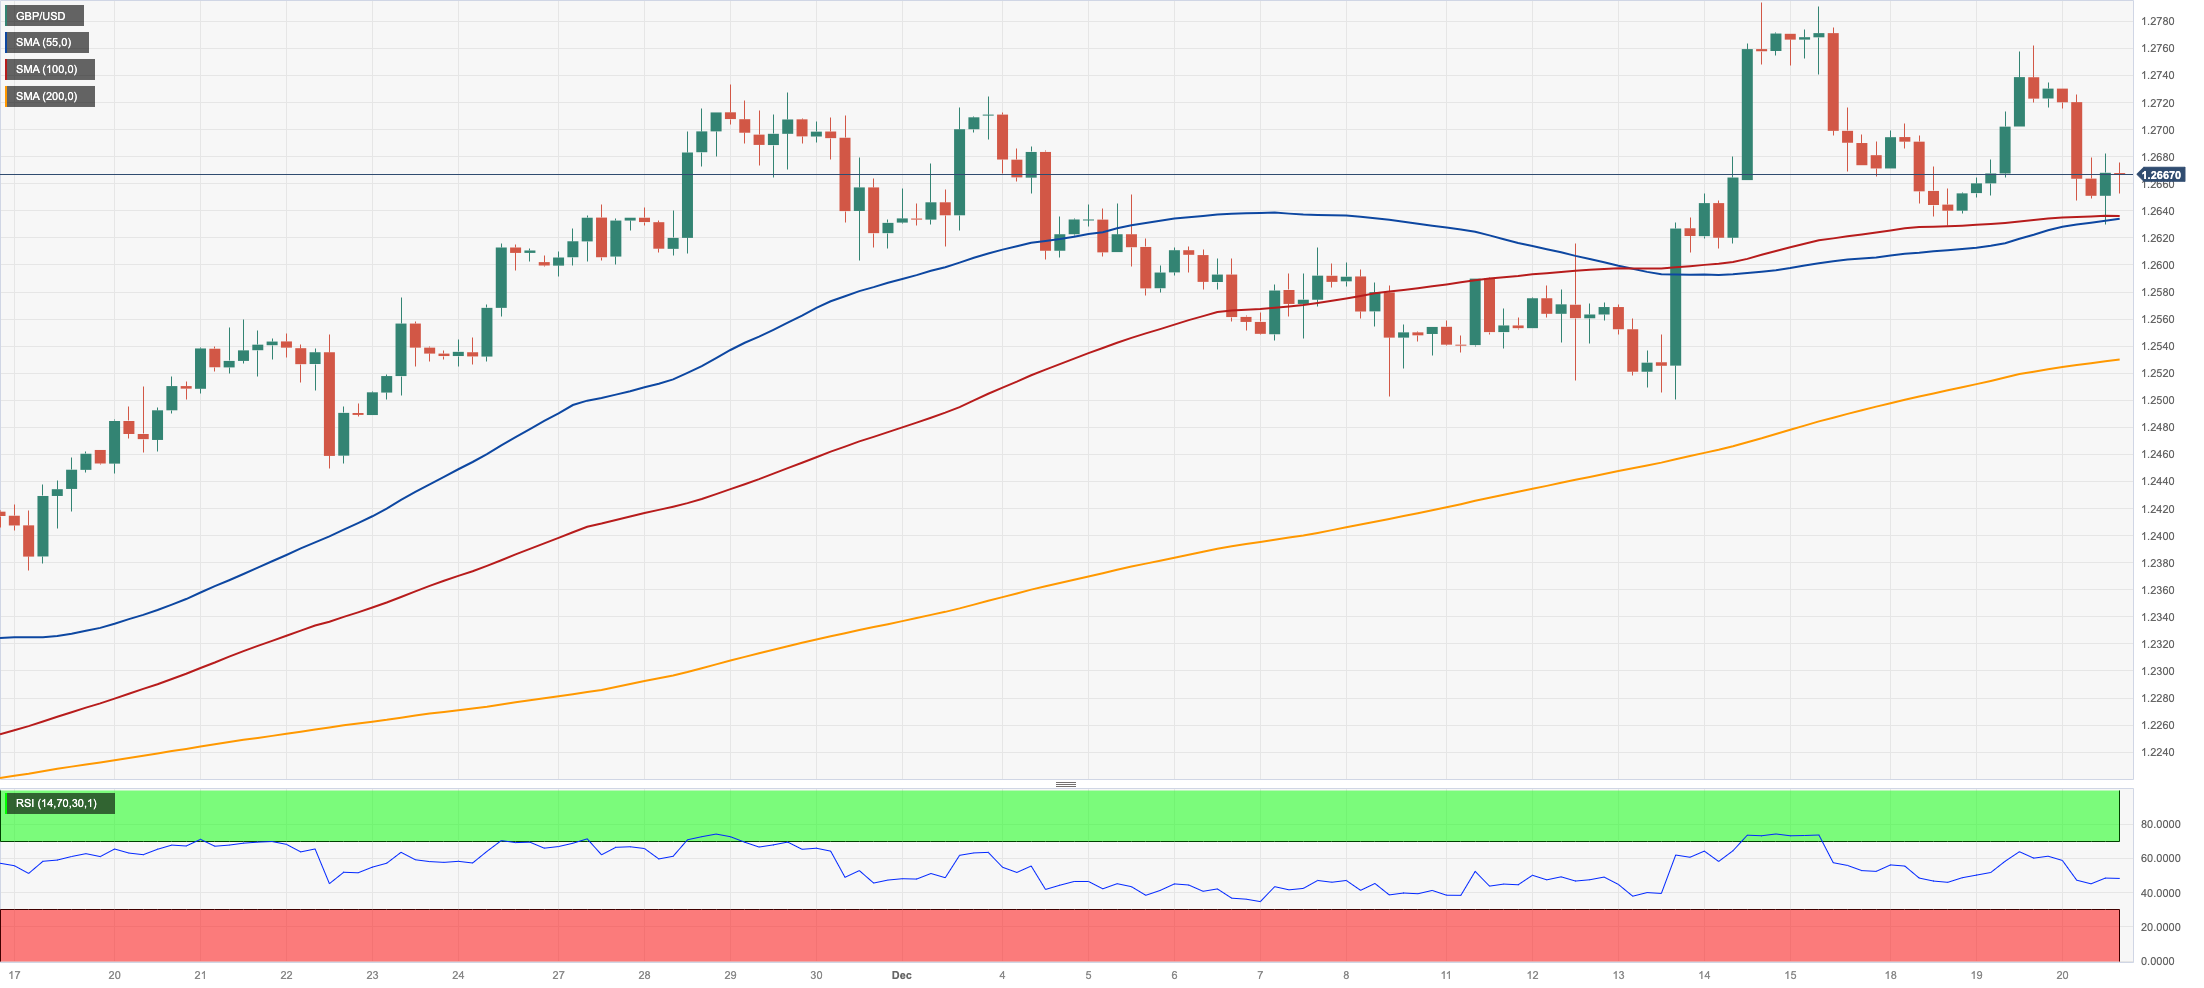
GBP/USD faded Tuesday’s decent advance and revisited the area of weekly lows near 1.2630 on Wednesday.
Indeed, the daily pullback in Cable came in response to the moderated rebound in the greenback amidst the resumption of the risk aversion sentiment among market participants, while investors’ repricing of BoE interest rate cuts earlier than previously anticipated also added to the downward bias in the quid.
On the latter, weaker-than-expected UK CPI readings for the month of November reinforced the ongoing disinflationary trend and undermined expectations that the BoE might keep its policy rate higher for a longer period.
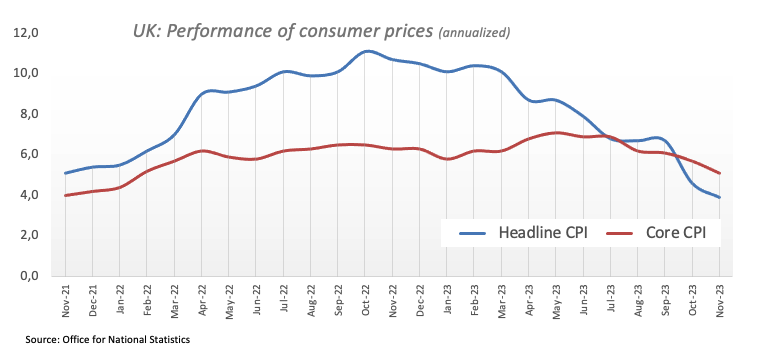
In the UK, headline CPI rose at an annualized 3.9% during the last month and 5.1% over the last twelve months when excluding food and energy costs.
If bulls regain the upper hand, GBP/USD may retest the December high of 1.2793 (December 14), which is followed by weekly tops of 1.2818 (August 10) and 1.2995 (July 27), both of which are above the critical 1.3000 level. On the downside, the 200-day SMA at 1.2510 is currently in play, just ahead of the December low of 1.2500 (December 13). If the latter fails, the focus will shift to the temporary 55-day SMA at 1.2396 and the weekly low of 1.2187 (November 10). The October low of 1.2037 (October 3), the crucial 1.2000 level, and the 2023 bottom of 1.1802 (March 8) are all aligned down from here. The daily RSI grinded lower to the sub-57 zone.
Resistance levels: 1.2793 1.2800 1.2995 (4H chart)
Support levels: 1.2628 1.2500 1.2448 (4H chart)
AUDUSD
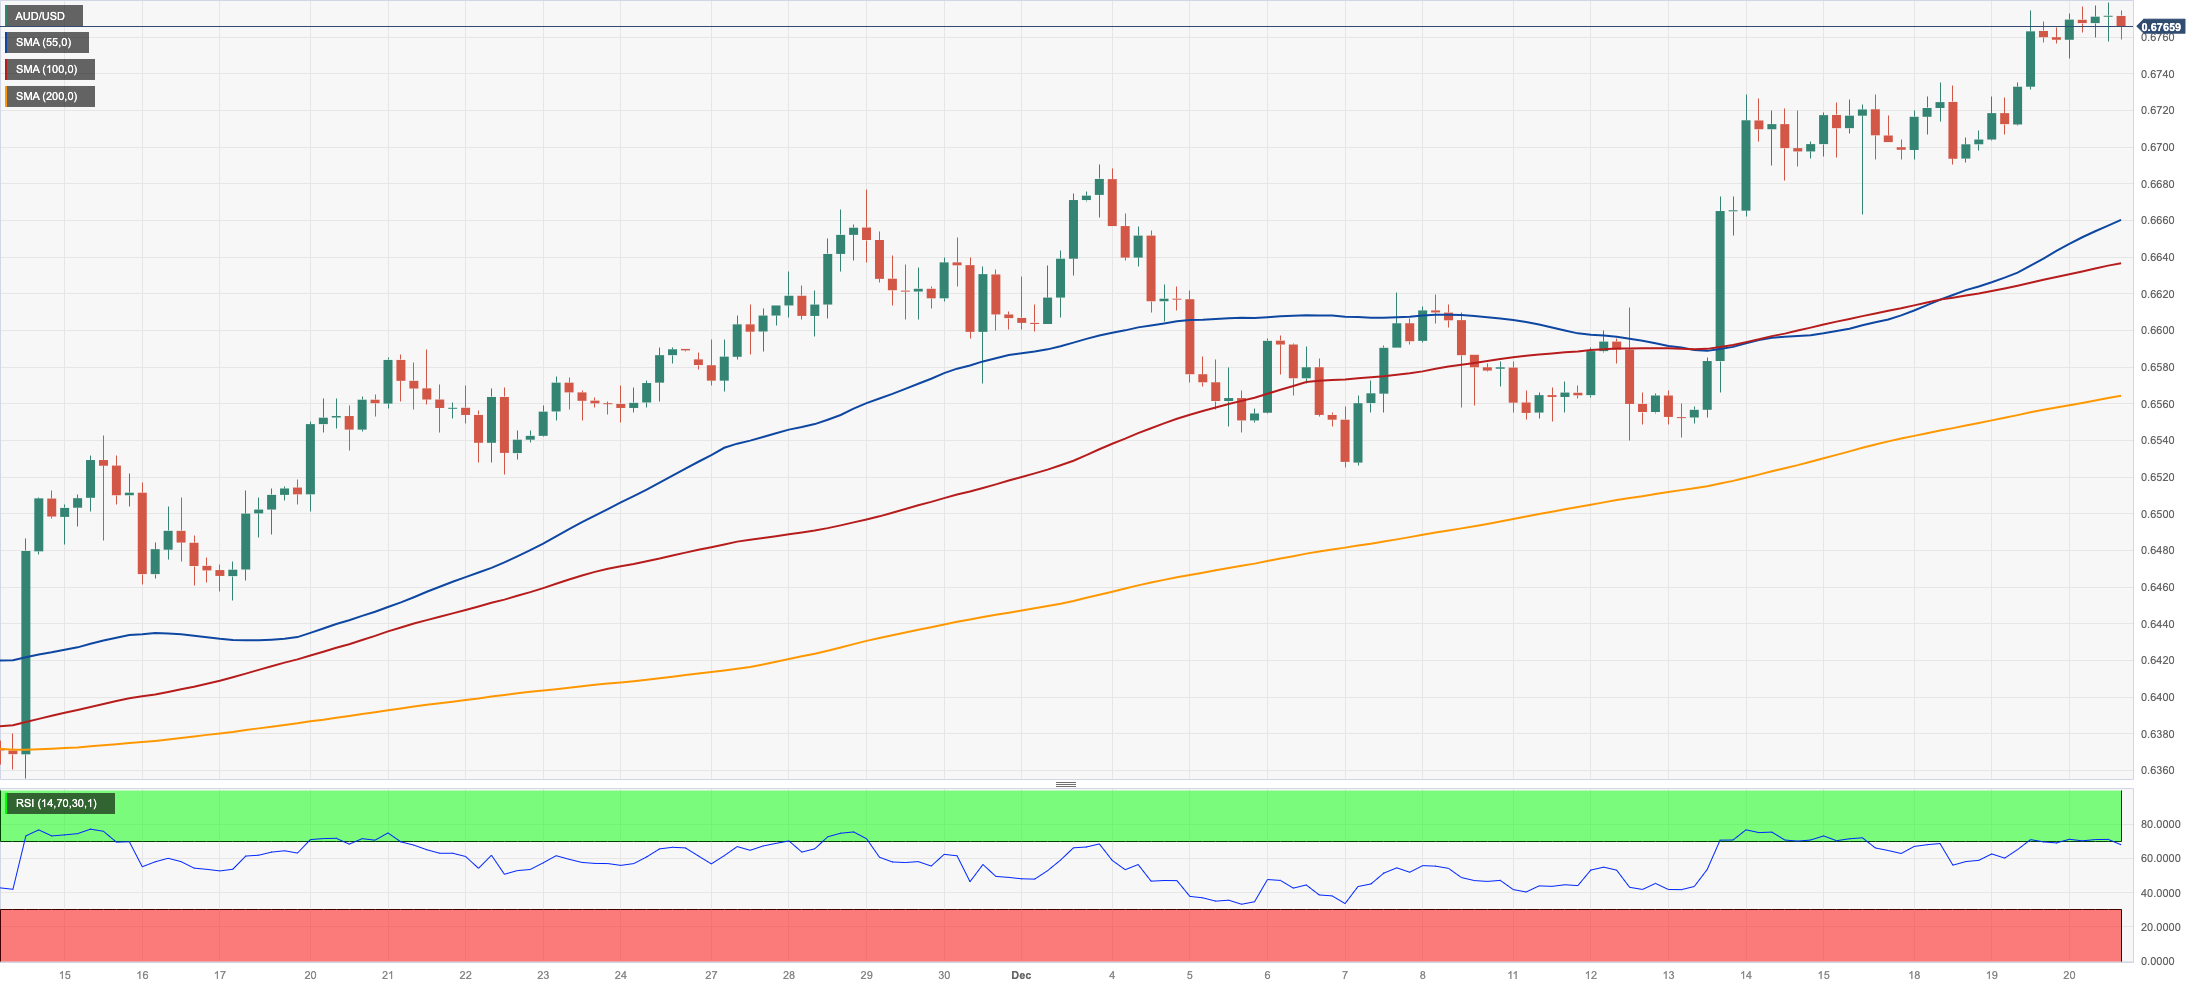
There seems to be no respite for the march north in AUD/USD so far. That said, the pair reached a new five-month top around 0.6780 on Wednesday, adding to the steep bounce from monthly lows in the 0.6550 zone.
The positive performance of the Aussie dollar came despite the rebound in the greenback and bearish developments around copper prices and iron ore, while it appears to have derived strength after the PBoC left unchanged its 1-year and 5-year Loan Prime Rate (LPR).
Further buying interest seems to have emerged after investors continued to evaluate the hawkish tilt at Tuesday’s publication of the RBA Minutes (of the December meeting).
In Oz, the Westpac Leading Index rose 0.1% in November vs. the previous month.
The breakout of the December peak of 0.6774 (December 19) might pave the way for a trip to the July high of 0.6894 (July 14) and the June top of 0.6899 (June 16), all of which are located prior to the critical 0.7000 threshold. AUD/USD, on the flip side, finds early support around the pivotal 200-day SMA of 0.6577, just above the December low of 0.6525 (December 7). The 2023 low of 0.6270 (October 26) appears south of here before the round level of 0.6200 and the 2022 low of 0.6169 (October 13). The daily RSI improved to the boundaries of the 70 yardstick.
Resistance levels: 0.6779 0.6821 0.6846 (4H chart)
Support levels: 0.6663 0.6561 0.6525 (4H chart)
GOLD
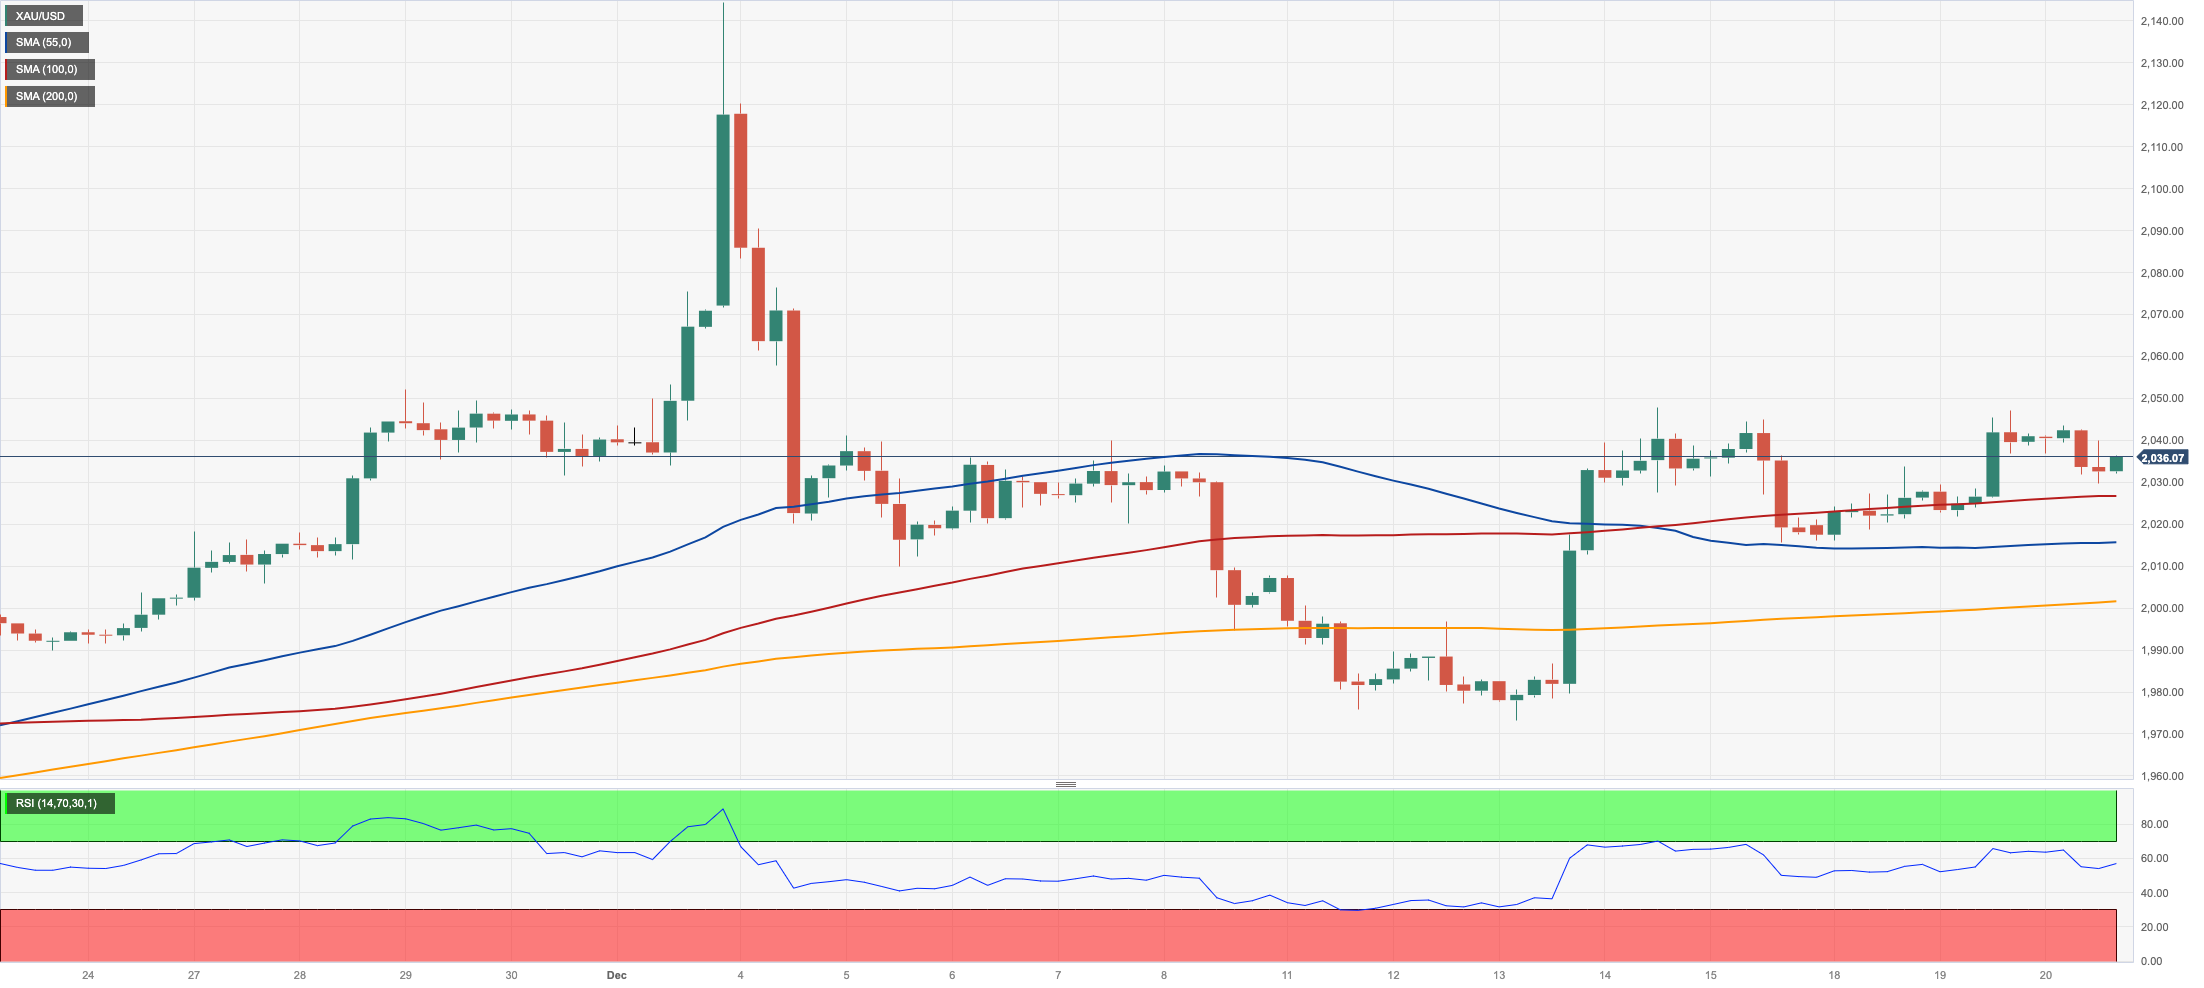
Following two straight sessions of losses, prices of the yellow metal edged lower and revisited the $2030 region per troy ounce amidst a narrow trading range on Wednesday.
The daily retracement in bullion came on the back of a decent comeback in the greenback, while diminishing US yields across the board seem to have limited the downward trend in the metal as well as the resurgence of geopolitical-driven risk aversion.
If gold prices continue to rise, the all-time high of $2150 (December 4) might be achieved again in the near future. Further retracement, on the other hand, will be met with immediate contention at the December low of $1973 (December 13). When this level is breached, gold is expected to challenge the 200-day SMA of $1957, ahead of the November low of $1931 (November 13). From here, the October low of $1810 (October 6), the 2023 low of $1804 (February 28), and eventually the important $1800 contention zone are all achievable.
Resistance levels: $2047 $2149 (4H chart)
Support levels: $2015 $2001 $1973 (4H chart)
CRUDE WTI
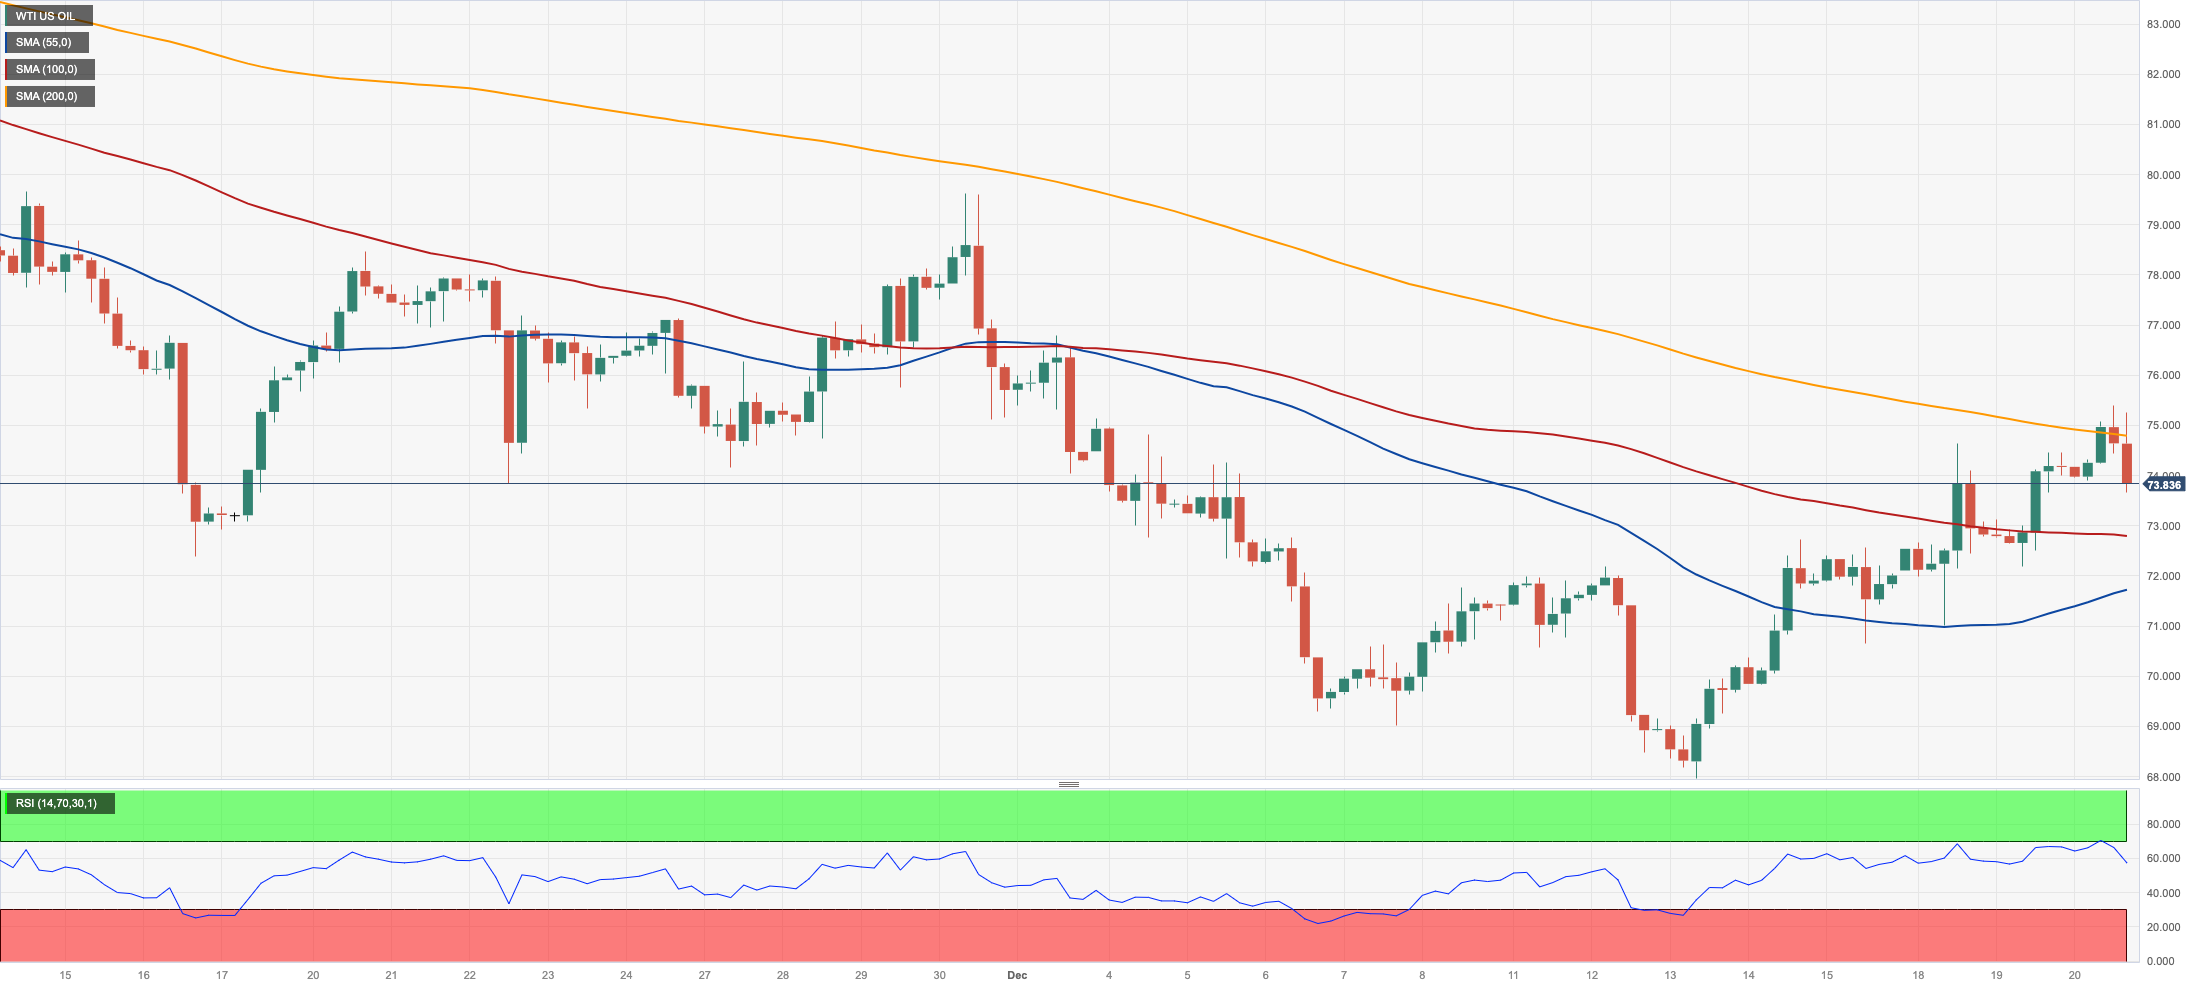
WTI prices quickly reversed the earlier advance to three-week peaks north of the $75.00 mark per barrel and retreated to the sub-$74.00 region towards the end of the NA session on Wednesday.
In fact, crude oil prices rose past $75.00 on the back of increasing geopolitical concerns around the Red Sea, aggravated after Houthi rebels warned Washington that they could potentially attack US vessels in the region.
However, an unexpected weekly build in US crude oil supplies weighed on traders’ mood and put the commodity under downside pressure. In fact, according to the EIA, US crude oil inventories increased by 2.909M barrels in the week to December 15, while supplies at Cushing went up by 1.686M barrels, Weekly Distillate Stocks rose by 1.485M barrels and gasoline stockpiles added 2.710M barrels.
The 200-day SMA at $77.70 is the next upward target for WTI before the crucial $80.00 milestone, which is followed by the November top of $80.15 (November 3). Further increases from here may take the market back to its weekly peak of $89.83 (October 18), followed by the 2023 high of $94.99 (September 28) and the August 2022 top of $97.65 (August 30), both of which precede the crucial $100.00 mark. In the other direction, a break below the December low of $67.74 (December 13) might precipitate a further pullback to the 2023 low of $63.61 (May 4) ahead of the key $60.00 level.
Resistance levels: $75.34 $76.72 $79.56 (4H chart)
Support levels: $70.28 $67.68 $67.01 (4H chart)
DOW JONES
There was no respite for the upside pressure in the Dow Jones on Wednesday.
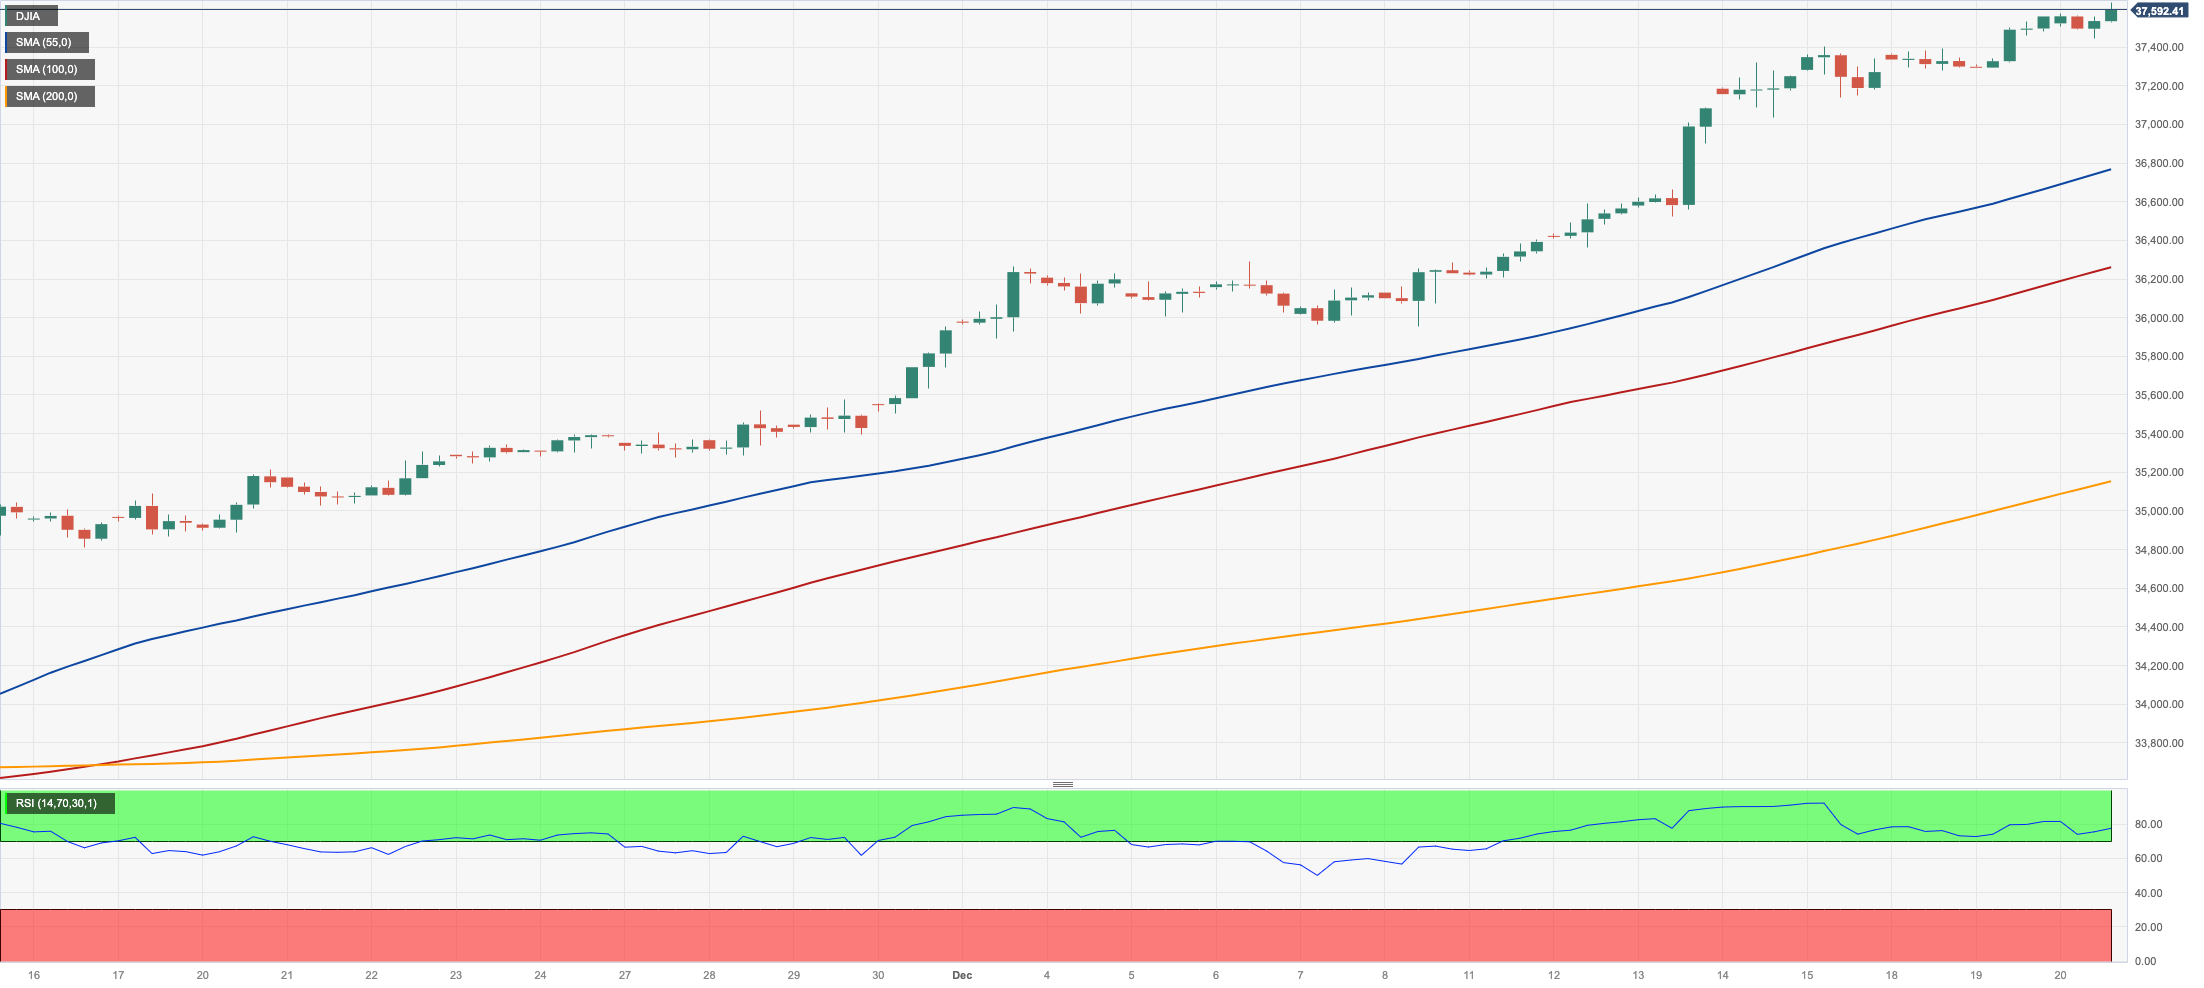
That said, the key benchmark index rose to an all-time top past 37600 on the back of unabated optimism surrounding US equities, in turn bolstered by convincing expectations that the Fed might start trimming its rates as soon as Q2 2024.
The ninth consecutive advance in the Dow also came against the backdrop of a satisfactory rebound in the dollar, while US yields extended further their decline in place since November.
On Wednesday, the Dow Jones rose 0.10% to 37599, the S&P500 gained 0.09% to 4772, and the tech-heavy Nasdaq Composite advanced 0.33% to 15051.
The Dow Jones reached a new all-time peak of 37641 on December 20. Just the opposite, there is initial contention at the December low of 36010 (December 5) ahead of the important 200-day SMA at 34138, which comes before the weekly low of 33859 (November 7). Further south, the October low of 32327 (October 27) will very certainly be challenged before the 2023 low of 31429 (March 15) and the 2022 low of 28660 (October 13). The daily RSI exceeded 87, suggesting that the market is very overbought.
Top Performers: Caterpillar, Chevron, Microsoft
Worst Performers: Coca-Cola, Walt Disney, J&J
Resistance levels: 37641 (4H chart)
Support levels: 36021 35829 34636 (4H chart)
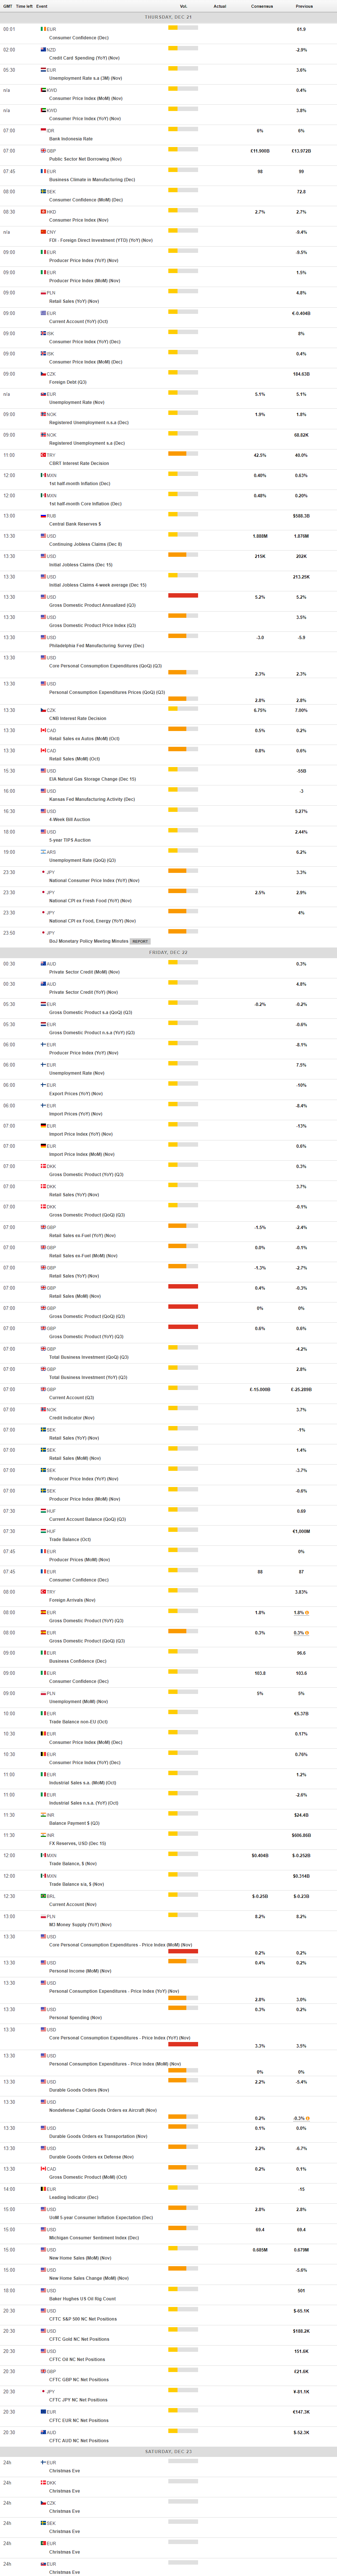
MACROECONOMIC EVENTS
All Information & Updates provided by:

All information relating to the financial markets available on this page has been prepared and issued by FXStreet (Forexstreet SL, Spain, Reg: B62498233) on the basis of publicly available information and all information believed to be reliable and does not conflict with Kuwaiti local laws, and all necessary care has been taken to before the company to ensure that the facts mentioned are correct from the source.
NCM Investment nor any of its directors or employees shall in any way be held responsible for the contents of this news, and the information contained on this page is intended only to provide clients with publicly available information and should not be construed as investment advice, report or analysis and/or constitute an offer or invitation to buy or sell financial instruments of any kind.
RISK WARNING: Forex and CFDs are highly risky leveraged products, as losses can exceed deposits. Please ensure you understand all the risks and take independent advice if necessary. NCM will segregate the clients based on the criteria of the regulator and its bylaws. NCM does not provide any advisory service; the material published does not constitute advice or a recommendation for a transaction in any financial instrument. NCM accepts no responsibility for any use of the content presented and any consequences of that use. Anyone acting on the information provided does so at their own risk.