
- Contact Us:
-

-

-

-


Daily Market Updates
26 Dec 2023
EURUSD
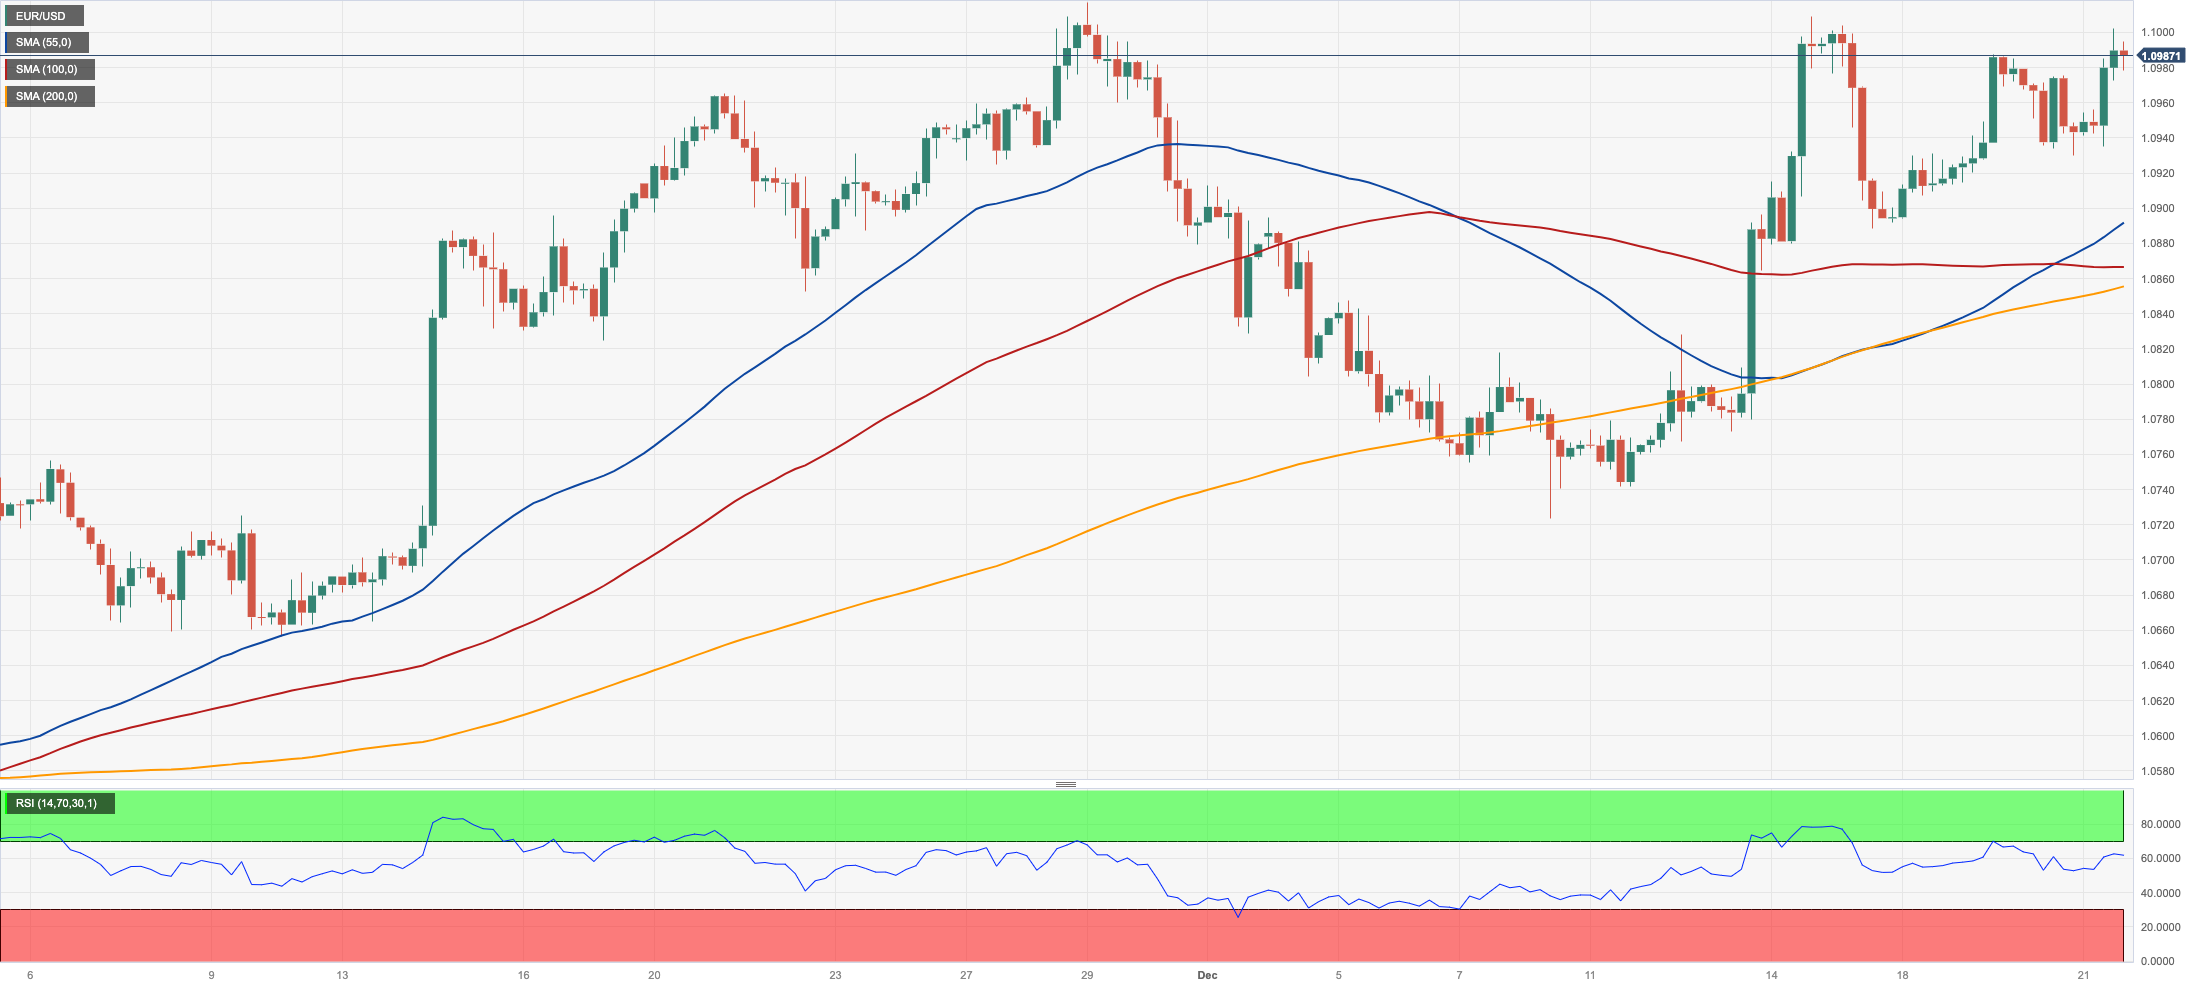
The resumption of selling pressure in the greenback sponsored a brief test of the area beyond the psychological 1.1000 level in EUR/USD on Thursday, reaching at the same time fresh weekly highs.
That said, the pair regained some shine and quickly left behind Wednesday’s downtick on the back of a marked retracement in the USD Index (DXY) amidst a dominating risk-on mood and marginal gains in US yields across the board.
Absent significant data releases in the euro area, the US docket showed the US economy expanded 4.9% YoY in Q3 according to final GDP figures, while the Philly Fed manufacturing gauge worsened to -10.5 in December and the Conference Board’s Leading Index dropped by 0.5% MoM in November.
The December high of 1.1009 (December 14) precedes the November top of 1.1017 for EUR/USD. After that, the August peak of 1.1064 (August 10) and the weekly high of 1.1149 (July 27) are both attainable ahead of the 2023 top of 1.1275 (July 18). If the pair goes below the 200-day SMA of 1.0834, it will almost probably retest the preliminary 55-day SMA of 1.0751 before reaching the December bottom of 1.0723 (December 8). The loss of the latter might lead to a test of the weekly low of 1.0495 (October 13), which comes before the 2023 low of 1.0448 (October 3) and the round level of 1.0400. On the daily chart, the RSI rose past the 60 level.
Resistance levels: 1.1009 1.1017 1.1064 (4H chart)
Support levels: 1.0888 1.0850 1.0723 (4H chart)
USDJPY
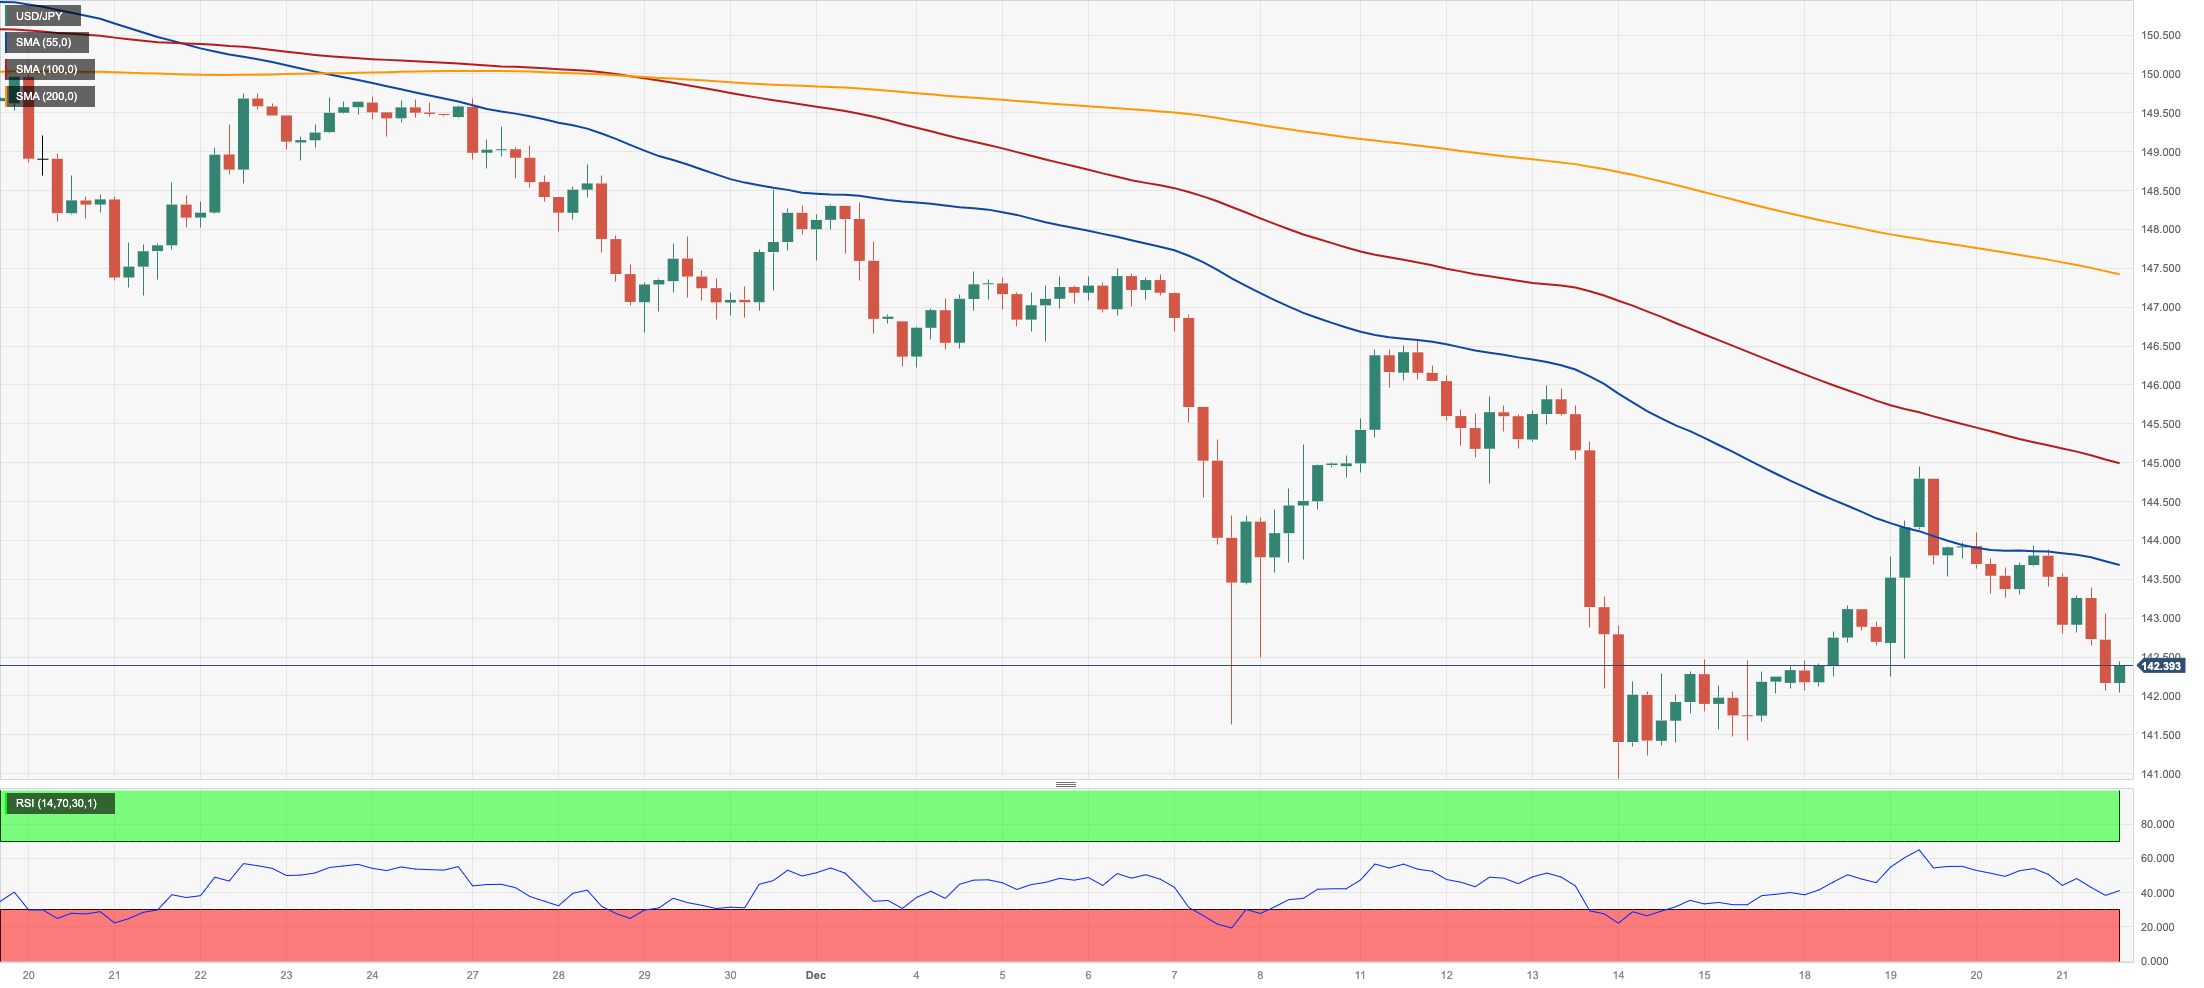
USD/JPY added to Wednesday’s pullback and traded at shouting distance from weekly lows near the 142.0 neighbourhood on Thursday.
Furthermore, spot broke below the critical 200-day SMA at 142.69, setting the stage for probable further losses in the short-term horizon.
Thursday’s decline in spot came pari passu with the resurgence of the downward bias in the buck and marginal gains in US and Japanese bond yields.
Data-wise, in Japan, Foreign Bond Investment increased by ¥2286.1B in the week to December 16.
In case USD/JPY accelerates its losses, the December low of 140.94 (December 14) is projected to provide early support. If this region is broken, the round level of 140.00 can be tried before the July low of 137.23 is achieved (July 14). In contrast, further gains are aimed at the weekly peak of 144.95 (December 19), which is ahead of the temporary 55-day SMA of 148.32 and the 2023 high of 151.90 (November 13). Up from here comes the 2022 top of 151.94 (October 21) prior to the round number of 152.00. The RSI grinded lower to the sub-35 zone.
Resistance levels: 144.95 146.58 147.51 (4H chart)
Support levels: 142.04 140.94 138.05 (4H chart)
GBPUSD
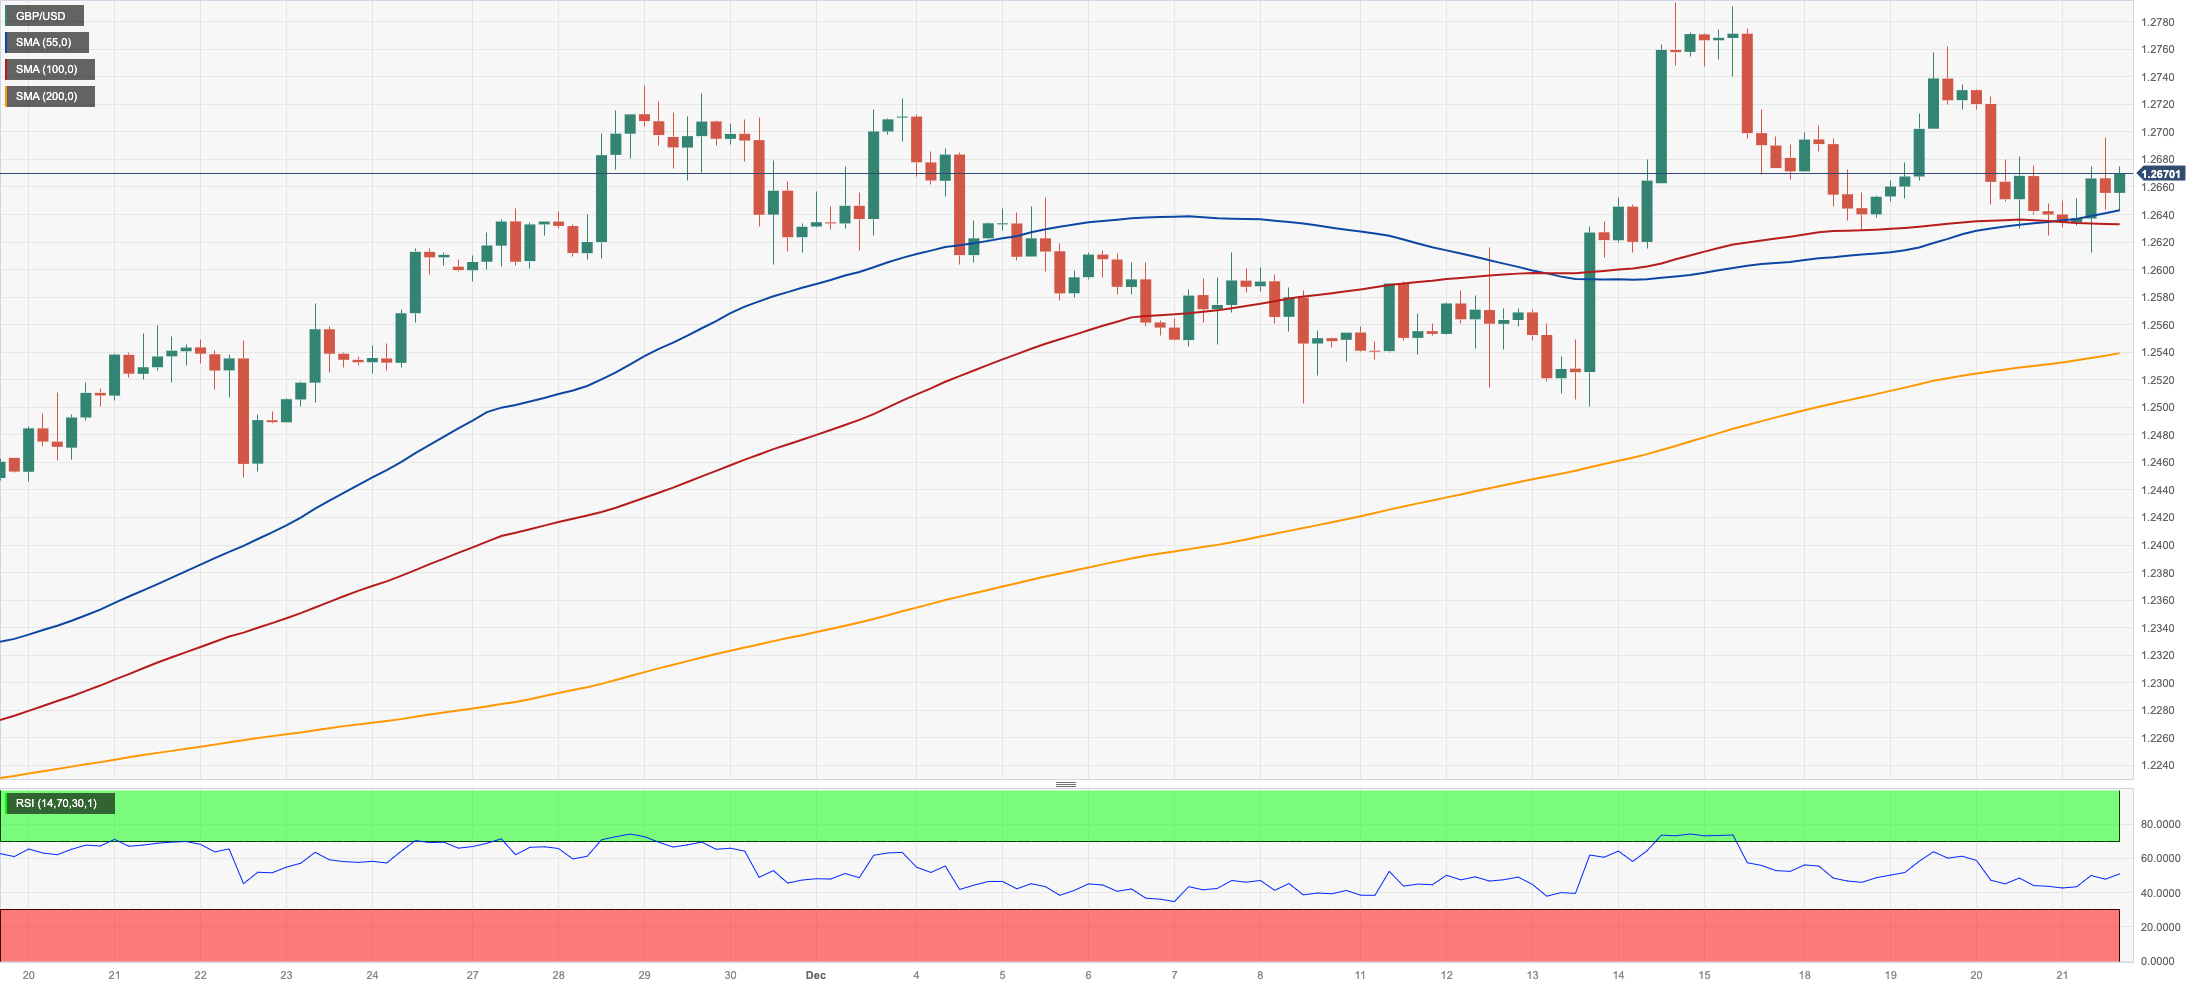
The reinvigorated strength in the risk-linked complex allowed the British pound to regain part of the ground lost in the previous session, lifting GBP/USD back to the boundaries of 1.2700 the figure, where some resistance appears to have emerged.
In the meantime, sterling is expected to remain under scrutiny as investors continue to price in potential rate cuts by the BoE sooner than initially expected, a view that was further reinforced after Wednesday’s lower-than-expected inflation readings for the month of November.
On another front, Chancellor Hunt mentioned that there's further effort needed to reduce inflation, adding that it'll take some time for the UK to determine whether tax cuts are feasible.
Across the Channel, Public Sector Net Borrowing shrank by £13.4B during November.
GBP/USD may retest the December top of 1.2793 (December 14), which is followed by weekly peaks of 1.2818 (August 10) and 1.2995 (July 27), all of which are above the crucial 1.3000 mark. On the downside, the 200-day SMA is at 1.2512, just ahead of the December low of 1.2500 (December 13). If the latter fails, attention will be drawn to the transitory 55-day SMA at 1.2404 ahead of the weekly low of 1.2187 (November 10). From here, the October low of 1.2037 (October 3), the critical 1.2000 level, and the 2023 bottom of 1.1802 (March 8) are all aligned down. The daily RSI improved north of the 56 yardstick.
Resistance levels: 1.2793 1.2800 1.2995 (4H chart)
Support levels: 1.2612 1.2500 1.2448 (4H chart)
AUDUSD
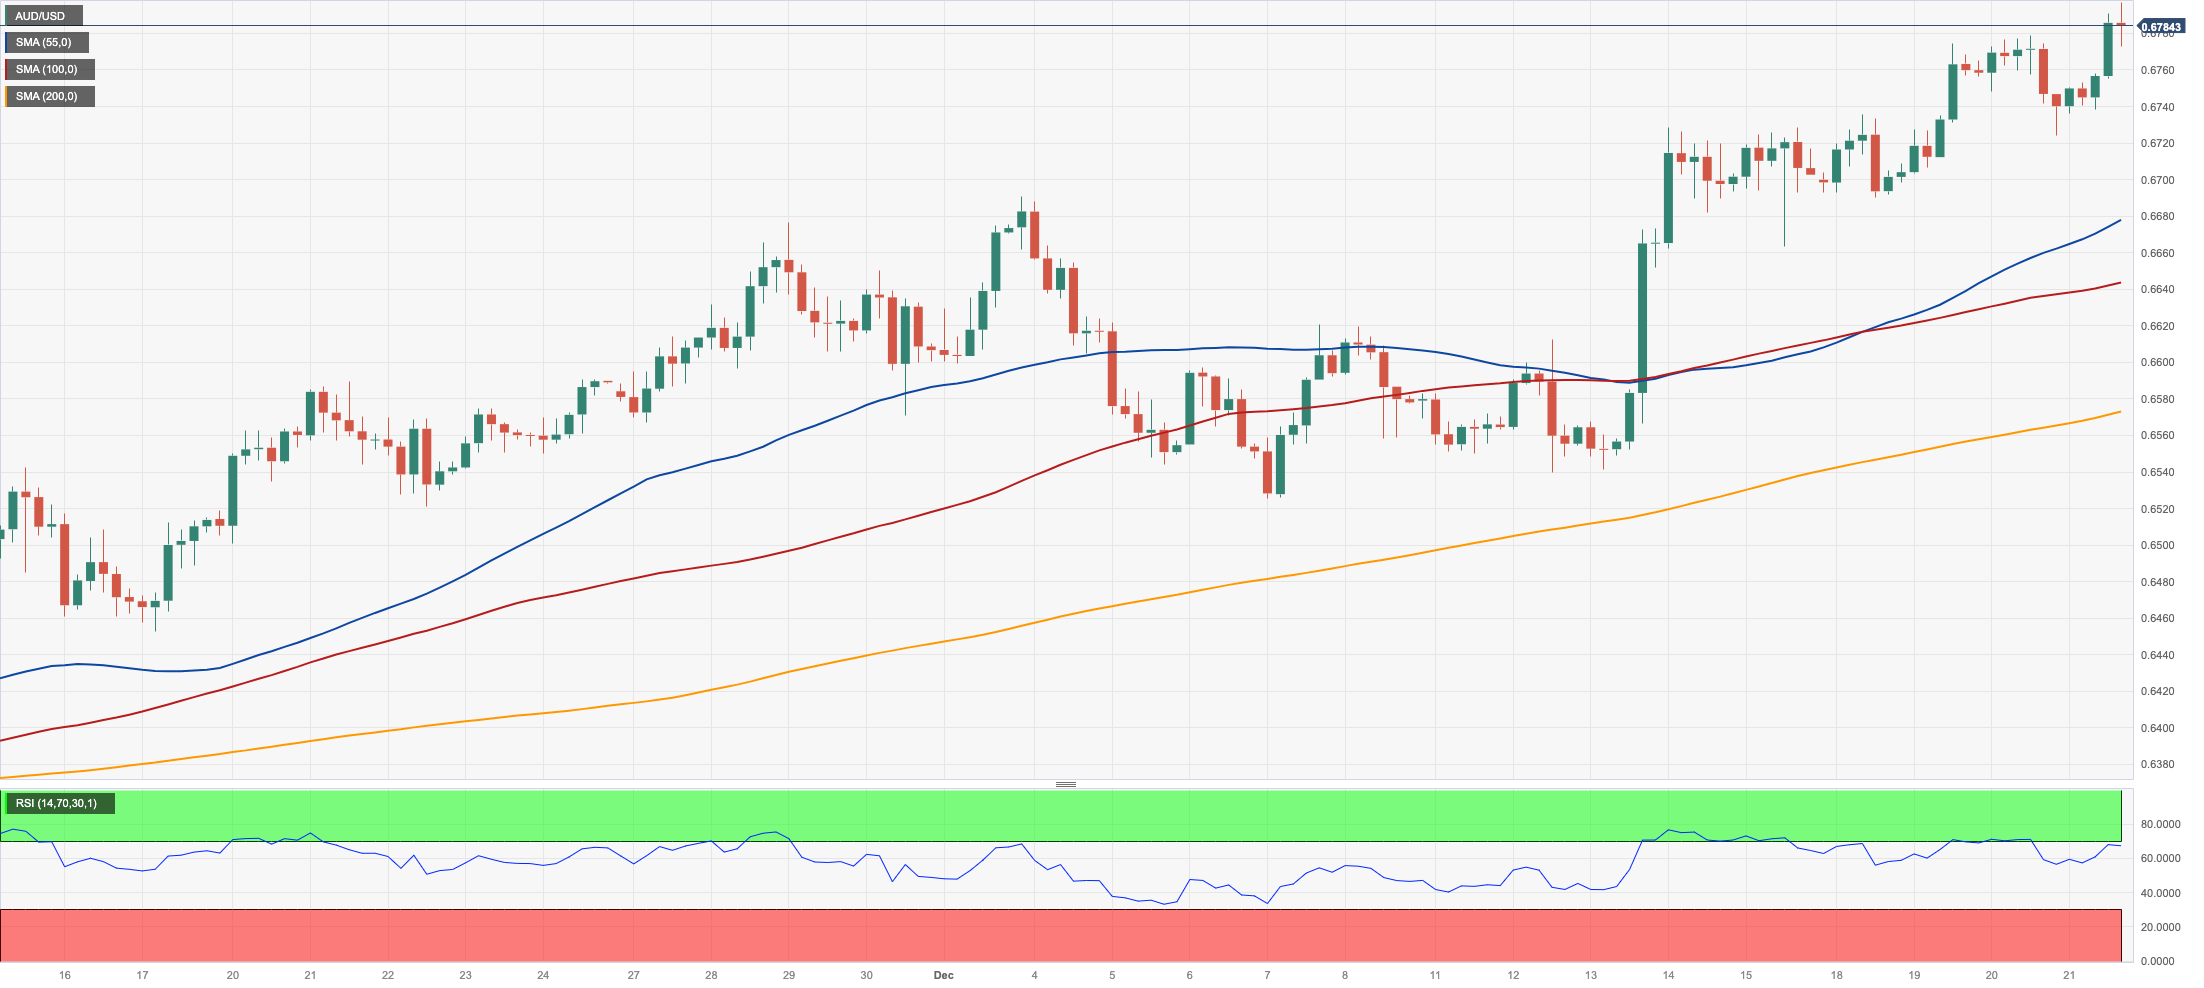
AUD/USD remained well en route to closing its second consecutive week of gains after its move to a new five-month top in the area, just shy of 0.6800 the figure on Thursday.
The resurgence of selling pressure in the greenback in combination with the generalized positive performance of the commodity space all helped the Aussie dollar regain extra pace.
There were no data releases or events scheduled for Down Under.
The breach of the December high of 0.6796 (December 21) might open the way for a journey to the July high of 0.6894 (July 14) and the June high of 0.6899 (June 16), all of which are positioned just before the important 0.7000 yardstick. On the other hand, AUD/USD is expected to meet immediate contention at the crucial 200-day SMA of 0.6577, above the December low of 0.6525 (December 7). Further south aligns the 2023 low of 0.6270 (October 26) before the round level of 0.6200 and the 2022 low of 0.6169 (October 13). The daily RSI broke above the 68 mark, approaching the overbought zone.
Resistance levels: 0.6796 0.6821 0.6846 (4H chart)
Support levels: 0.6663 0.6568 0.6525 (4H chart)
GOLD
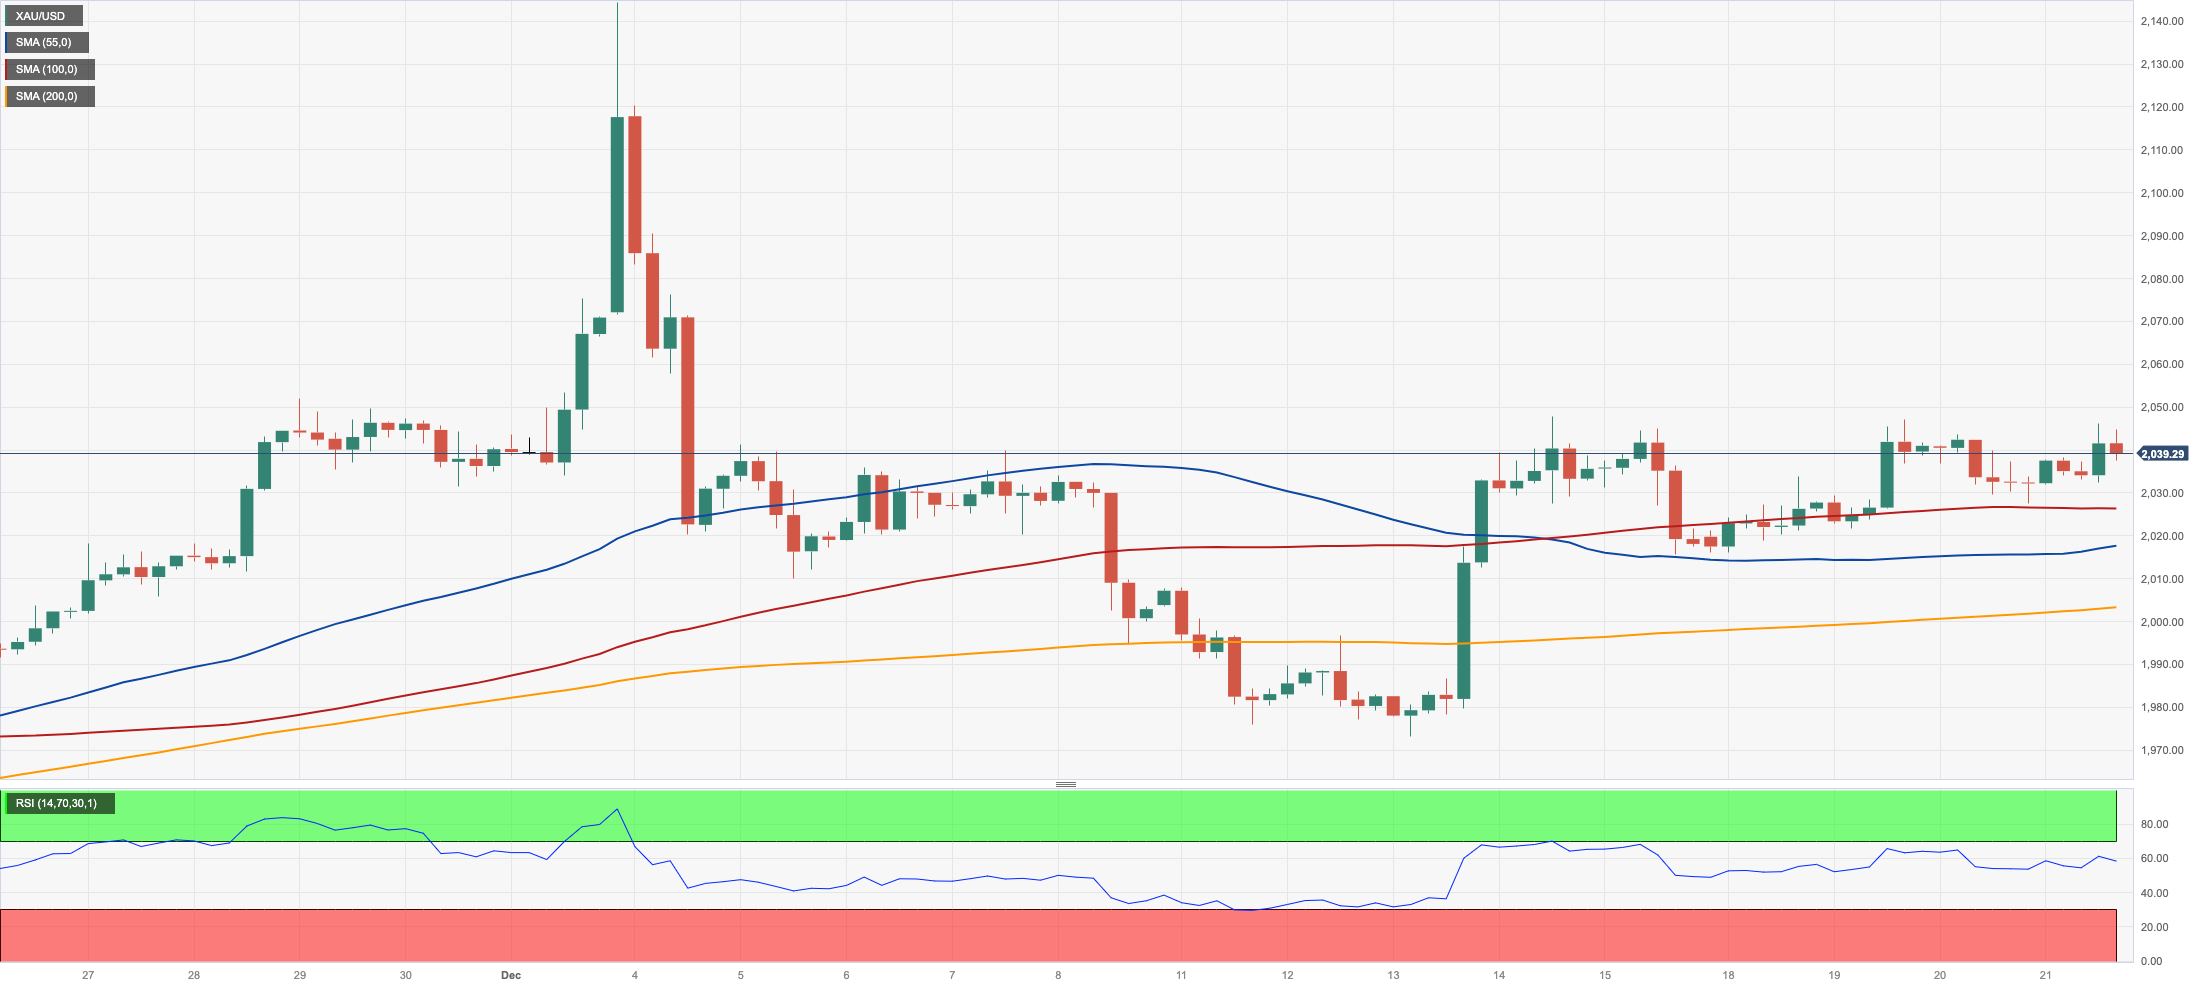
Gold prices extended their consolidative mood well north of the critical $2000 mark per troy ounce for yet another session on Thursday.
Daily gains in the precious metal came on the back of the intense weakness surrounding the greenback, although humble gains in US yields somewhat undermined the upside potential in bullion.
So far, expectations gyrating around the likelihood of interest rate cuts by the Federal Reserve in H1 2024 should be dictating the sentiment around the yellow metal for the time being.
If gold prices continue to increase, the all-time high of $2150 (December 4) might be confronted in the near future. Further retracement, however, would be faced with immediate support around the $2000 region. The loss of this area could spark a deeper drop to, initially, the December low of $1973 (December 13) ahead of the 200-day SMA of $1957. Down from here emerges the November low of $1931 (November 13) prior to the October low of $1810 (October 6), the 2023 bottom of $1804 (February 28), and finally the crucial $1800 contention zone.
Resistance levels: $2047 $2149 (4H chart)
Support levels: $2015 $2002 $1973 (4H chart)
CRUDE WTI
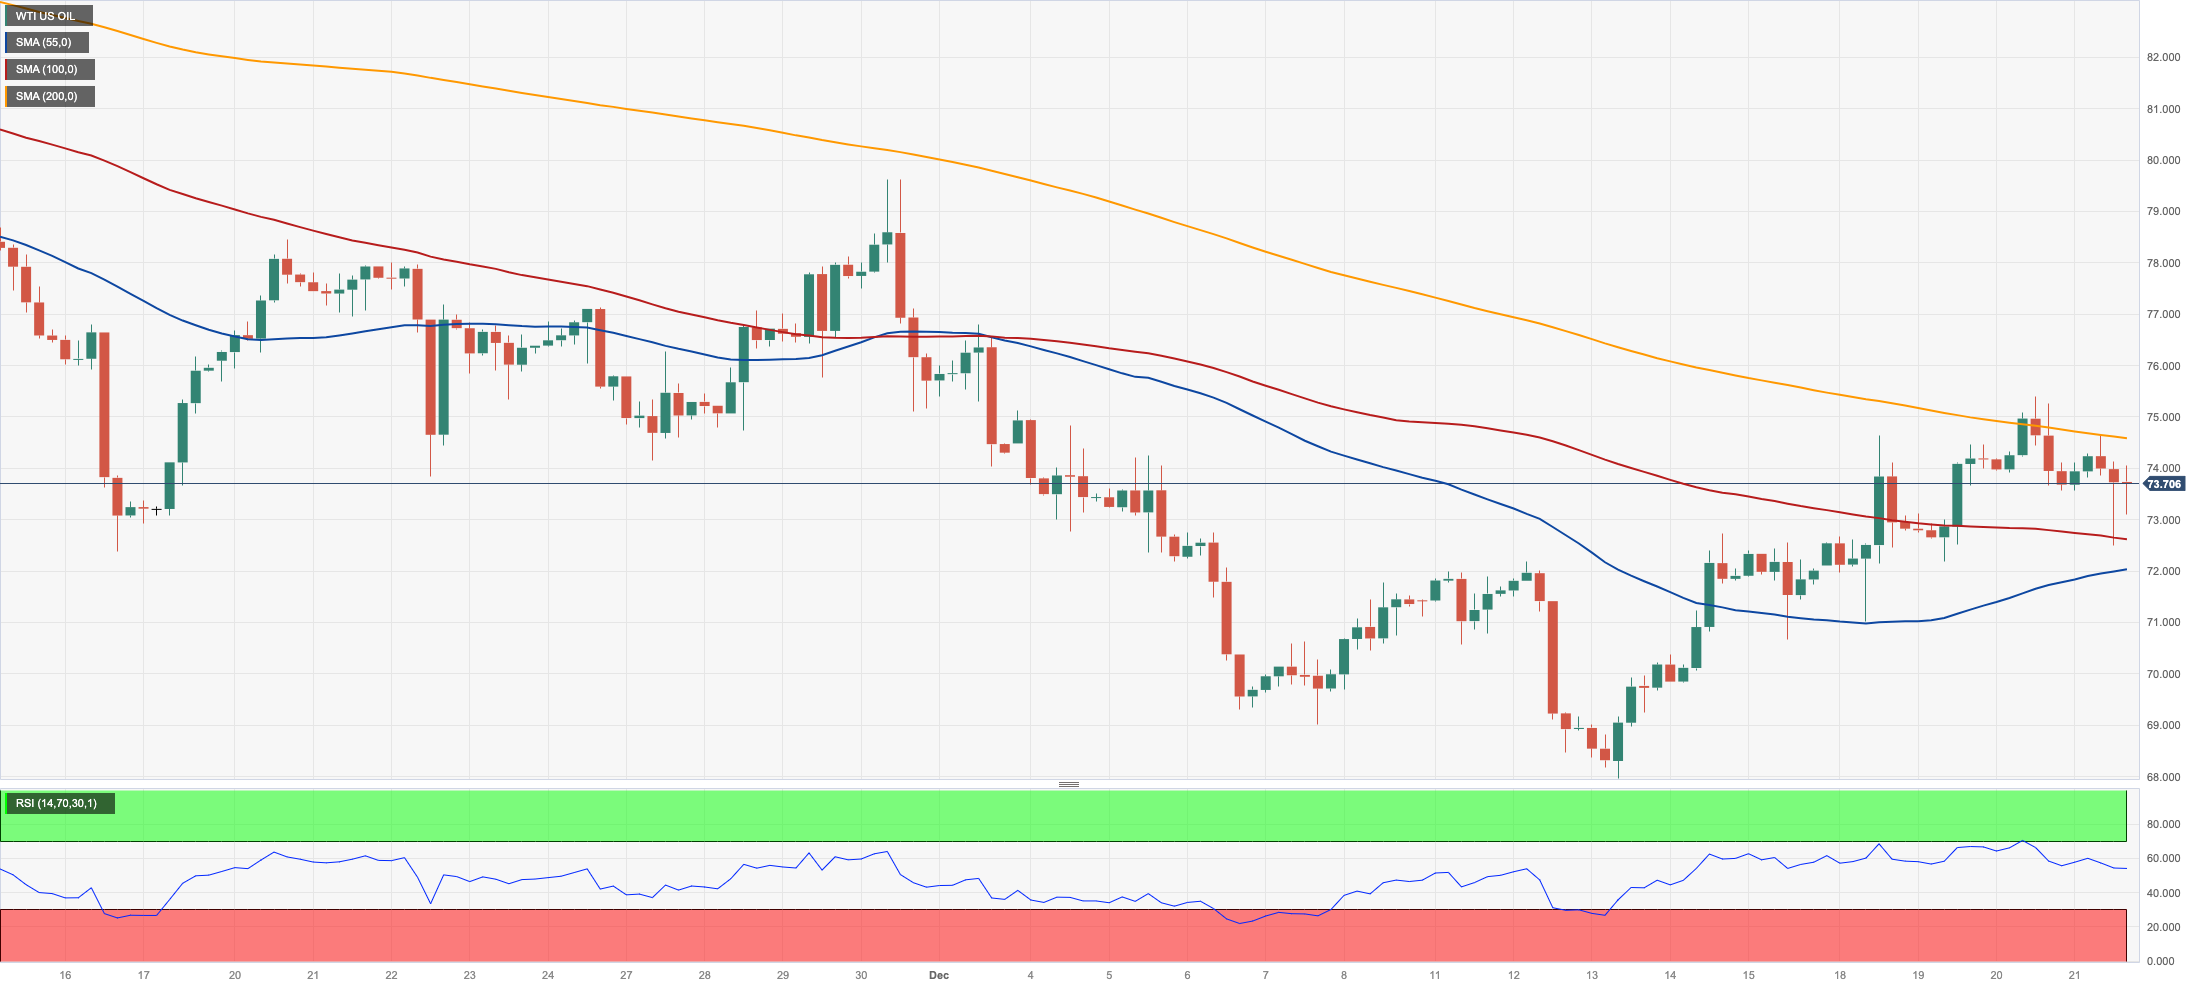
Prices of WTI dropped for the second straight day on Thursday, briefly putting the $72.50 region to the test.
Further correction in crude oil prices came after (still) OPEC member Angola announced its plans to exit the group, reigniting scepticism and concerns over the cartel’s ability to keep influencing prices, particularly via oil output cuts.
Also weighing on the commodity, the EIA reported another all-time top in US crude oil production, this time hitting 13.3 mbpd during the week ended on December 15.
WTI's next upward objective is the 200-day SMA at $77.71, which is followed by the key $80.00 mark and the November top of $80.15 (November 3). Further gains from here may return the market to its weekly high of $89.83 (October 18), seconded by the 2023 peak of $94.99 (September 28) and the August 2022 high of $97.65 (August 30), all of which precede the critical $100.00 threshold. The other way around, a break below the December low of $67.74 (December 13) might trigger a further drop to the 2023 bottom of $63.61 (May 4) before the critical $60.00 support.
Resistance levels: $75.34 $76.72 $79.56 (4H chart)
Support levels: $72.41 $70.28 $67.68 (4H chart)
DOW JONES
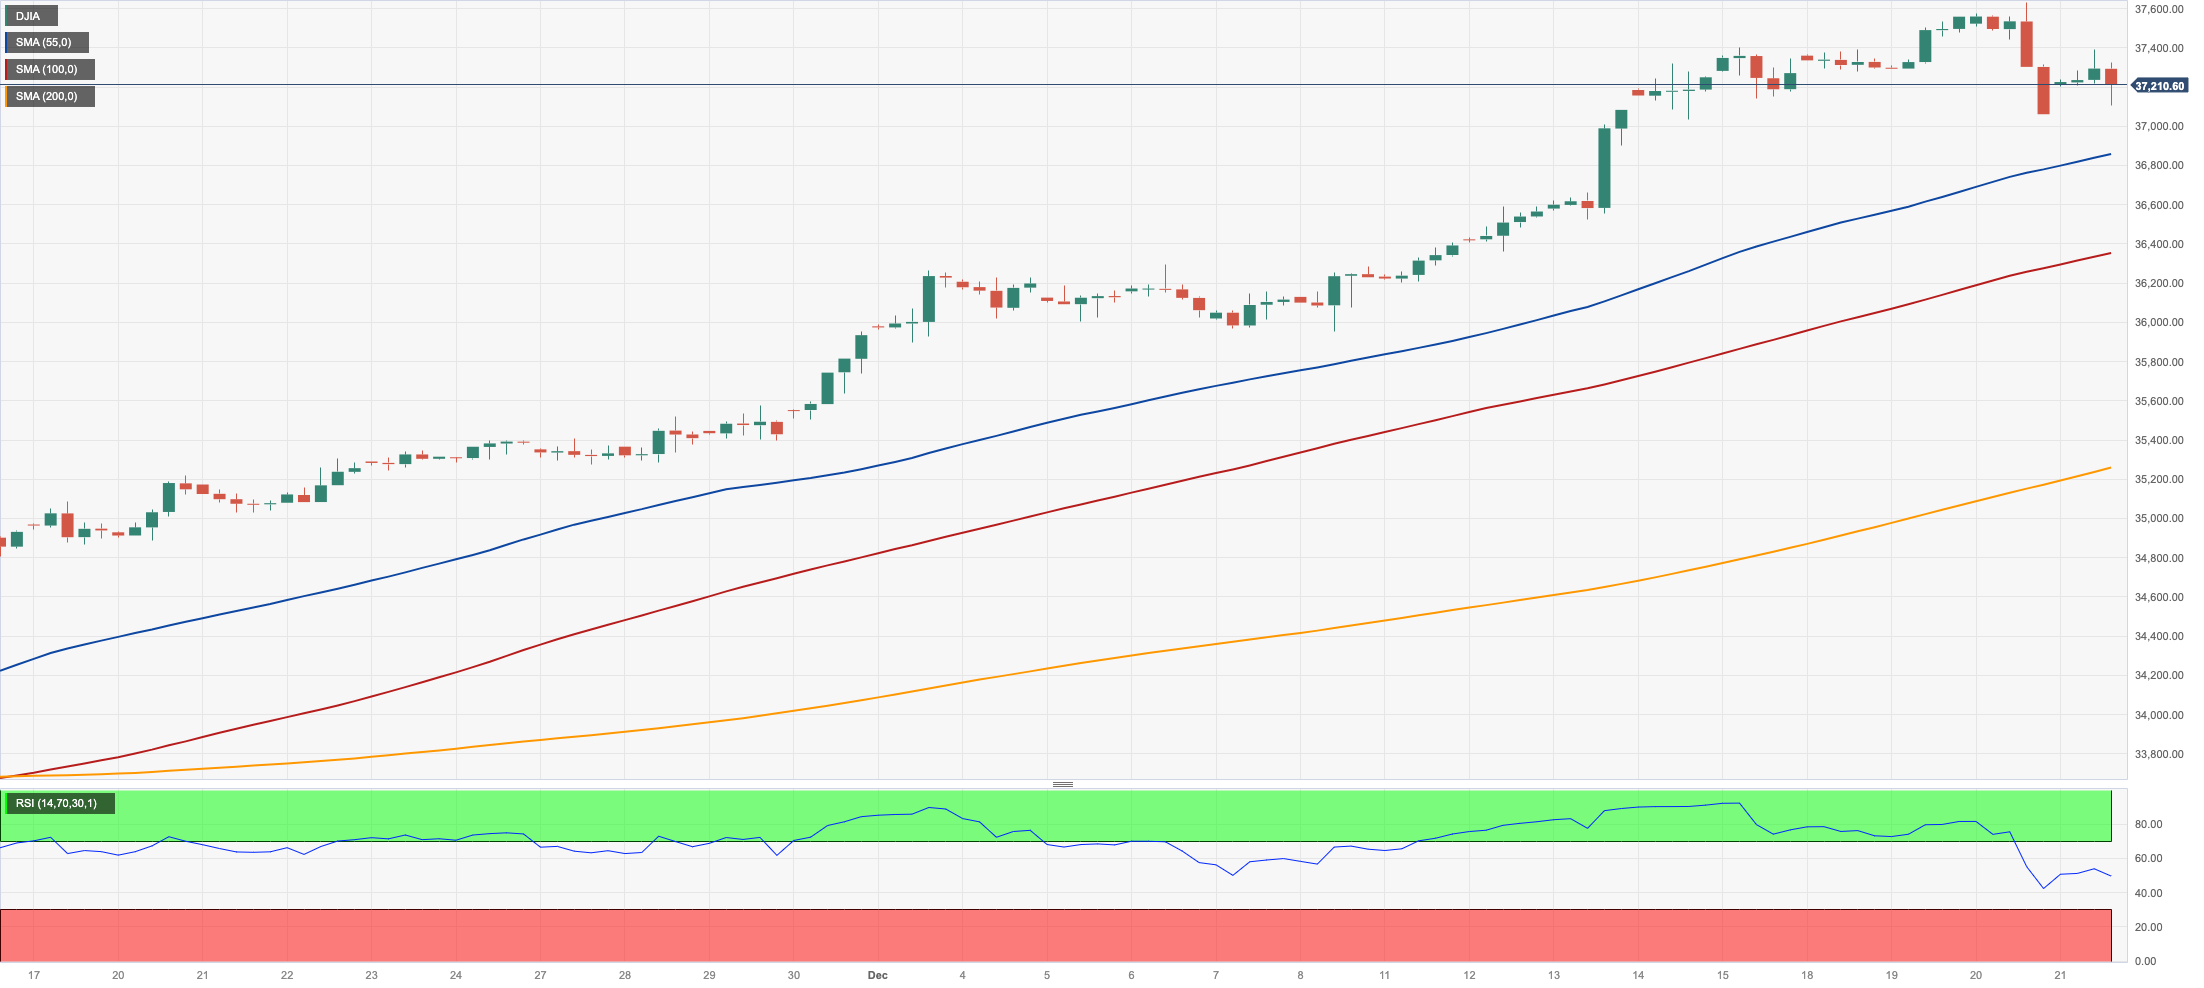
US equities regained their smile and advanced modestly following Wednesday’s sharp correction in the Dow Jones, which came despite hitting a new record high around 37600.
So far, the index trades in negative territory in the weekly chart for the first time after seven consecutive advances.
Thursday’s uptick in US stocks came in response to further investors’ re-positioning ahead of the release of key inflation figures measured by the PCE on Friday.
Additionally, the knee-jerk in the dollar appears to have propped up the upbeat mood in the Dow, while higher yields limited daily gains.
All in all, the Dow Jones gained 0.36% to 37214, the S&P500 advanced 0.38% to 4719, and the tech-focused Nasdaq Composite rose 0.68% to 14879.
Bulls continue to target the all-time high of 37641 (December 20). On the contrary, the Dow Jones faces early contention at the December low of 36010 (December 5) ahead of the critical 200-day SMA at 34158, which comes before the weekly low of 33859 (November 7). Further south, the October low of 32327 (October 27) will undoubtedly be tested before the 2023 low of 31429 (March 15) and the 2022 low of 28660 (October 13). The daily RSI hovered above 72, indicating that the market remained overbought.
Top Performers: Intel, Salesforce Inc, American Express
Worst Performers: Caterpillar, Cisco, Apple
Resistance levels: 37641 (4H chart)
Support levels: 36021 35942 34636 (4H chart)
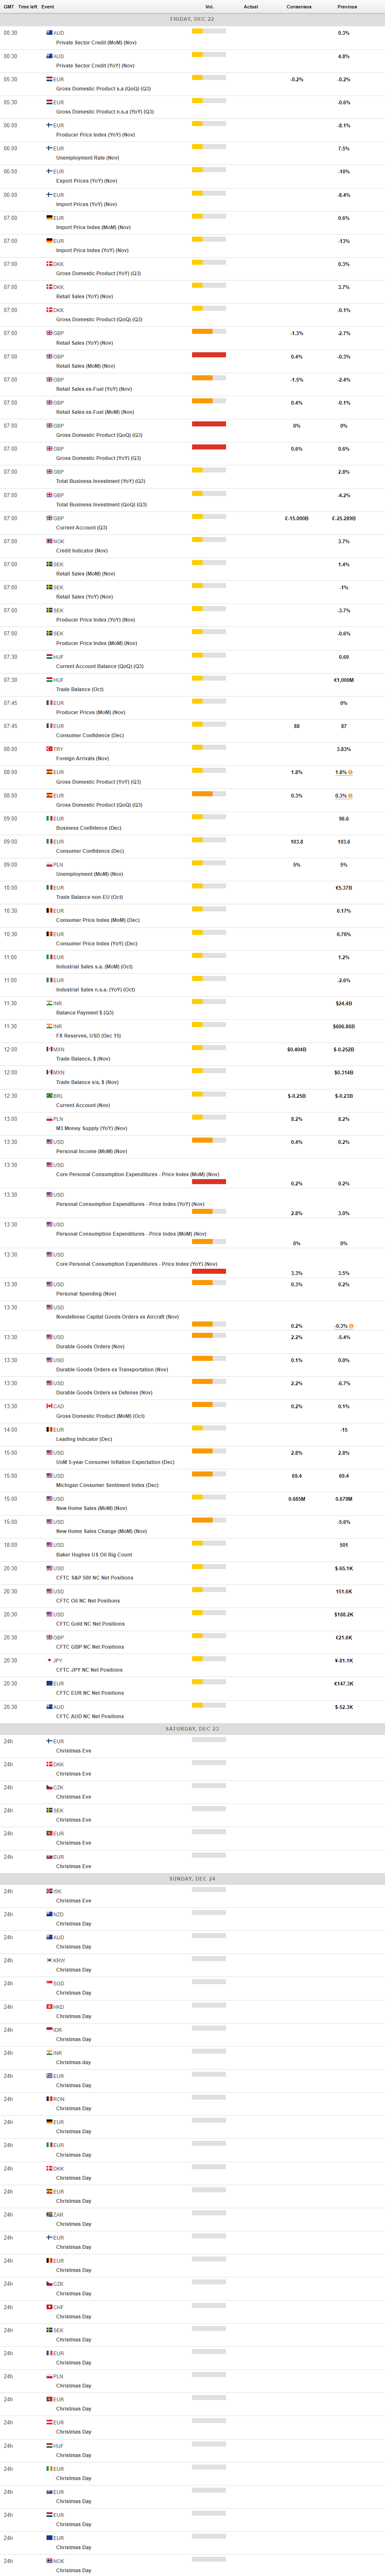
MACROECONOMIC EVENTS
All Information & Updates provided by:

All information relating to the financial markets available on this page has been prepared and issued by FXStreet (Forexstreet SL, Spain, Reg: B62498233) on the basis of publicly available information and all information believed to be reliable and does not conflict with Kuwaiti local laws, and all necessary care has been taken to before the company to ensure that the facts mentioned are correct from the source.
NCM Investment nor any of its directors or employees shall in any way be held responsible for the contents of this news, and the information contained on this page is intended only to provide clients with publicly available information and should not be construed as investment advice, report or analysis and/or constitute an offer or invitation to buy or sell financial instruments of any kind.
RISK WARNING: Forex and CFDs are highly risky leveraged products, as losses can exceed deposits. Please ensure you understand all the risks and take independent advice if necessary. NCM will segregate the clients based on the criteria of the regulator and its bylaws. NCM does not provide any advisory service; the material published does not constitute advice or a recommendation for a transaction in any financial instrument. NCM accepts no responsibility for any use of the content presented and any consequences of that use. Anyone acting on the information provided does so at their own risk.