
- Contact Us:
-

-

-

-


Daily Market Updates
27 Dec 2023
EURUSD
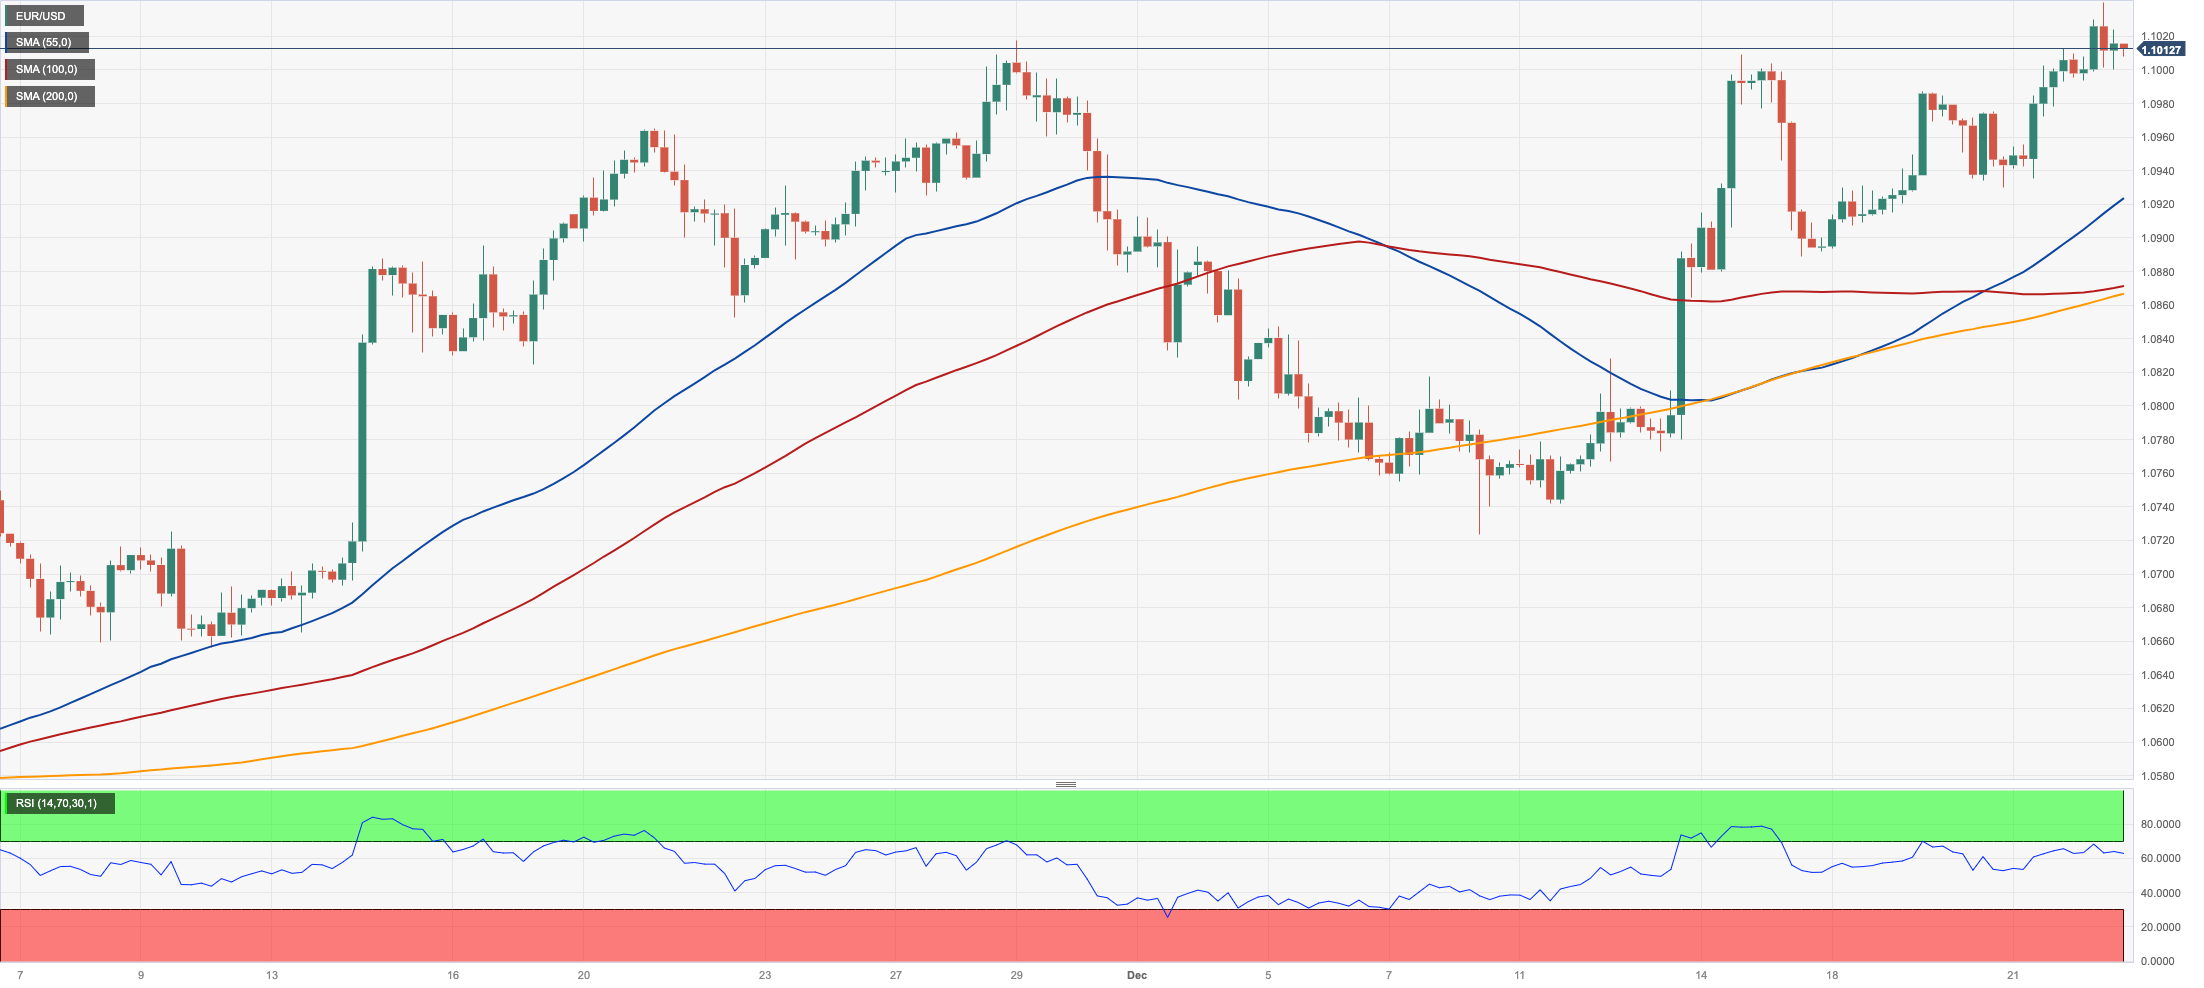
EUR/USD added to Thursday’s advance and managed to reach new multi-month highs around 1.1040 at the end of the week, always on the back of the persistent selling pressure in the greenback.
Despite the initial firm performance, spot could not sustain those early gains and eventually ended Friday’s session with marginal gains vs. the equally minimal pullback in the USD Index (DXY) amidst a small retracement in the short end of the curve vs. humble gains in the belly and the long end.
Some news from the ECB saw board member I. Schnabel (hawk) Schnabel stating that they anticipated inflation to increase slightly in the short term and projected that it would gradually decrease to 2% by 2025.
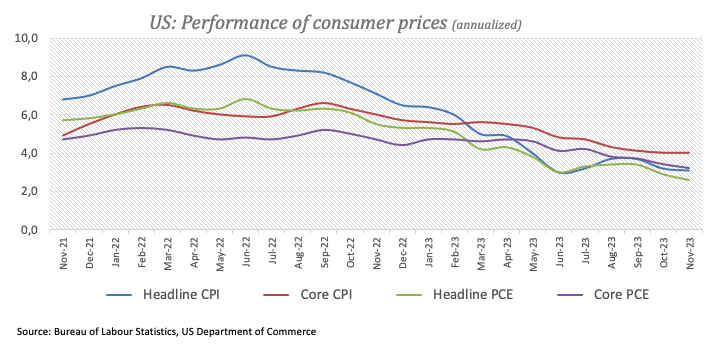
In the US docket, persevering disinflationary pressures were reinforced after inflation tracked by the PCE rose at an annualized 2.6% and the Core PCE increased by 3.2% from a year earlier. In addition, Durable Goods Orders expanded sharply by 5.4% in November vs. the previous month. Further results for the month of November saw Personal Income expand by 0.4% MoM and Personal Spending rise by 0.2% MoM. Closing the docket, final Michigan Consumer Sentiment came in at 69.7 (from 61.3) in December, and New Home Sales contracted by 12.2% (0.59M units) in November from a month earlier.
For EUR/USD, the December high of 1.1040 (December 22) comes before the August top of 1.1064 (August 10) and the weekly peak of 1.1149 (July 27), all ahead of the 2023 high of 1.1275 (July 18). If the pair falls below the 200-day SMA of 1.0836, it will almost certainly retest the temporary 55-day SMA of 1.0759 before the December low of 1.0723 (December 8). If the latter is breached, the weekly low of 1.0495 (October 13) may be tested, which comes before the 2023 low of 1.0448 (October 3) and the round level of 1.0400. The RSI advanced marginally past 62.
Resistance levels: 1.1040 1.1064 1.1149 (4H chart)
Support levels: 1.0929 1.0888 1.0861 (4H chart)
USDJPY
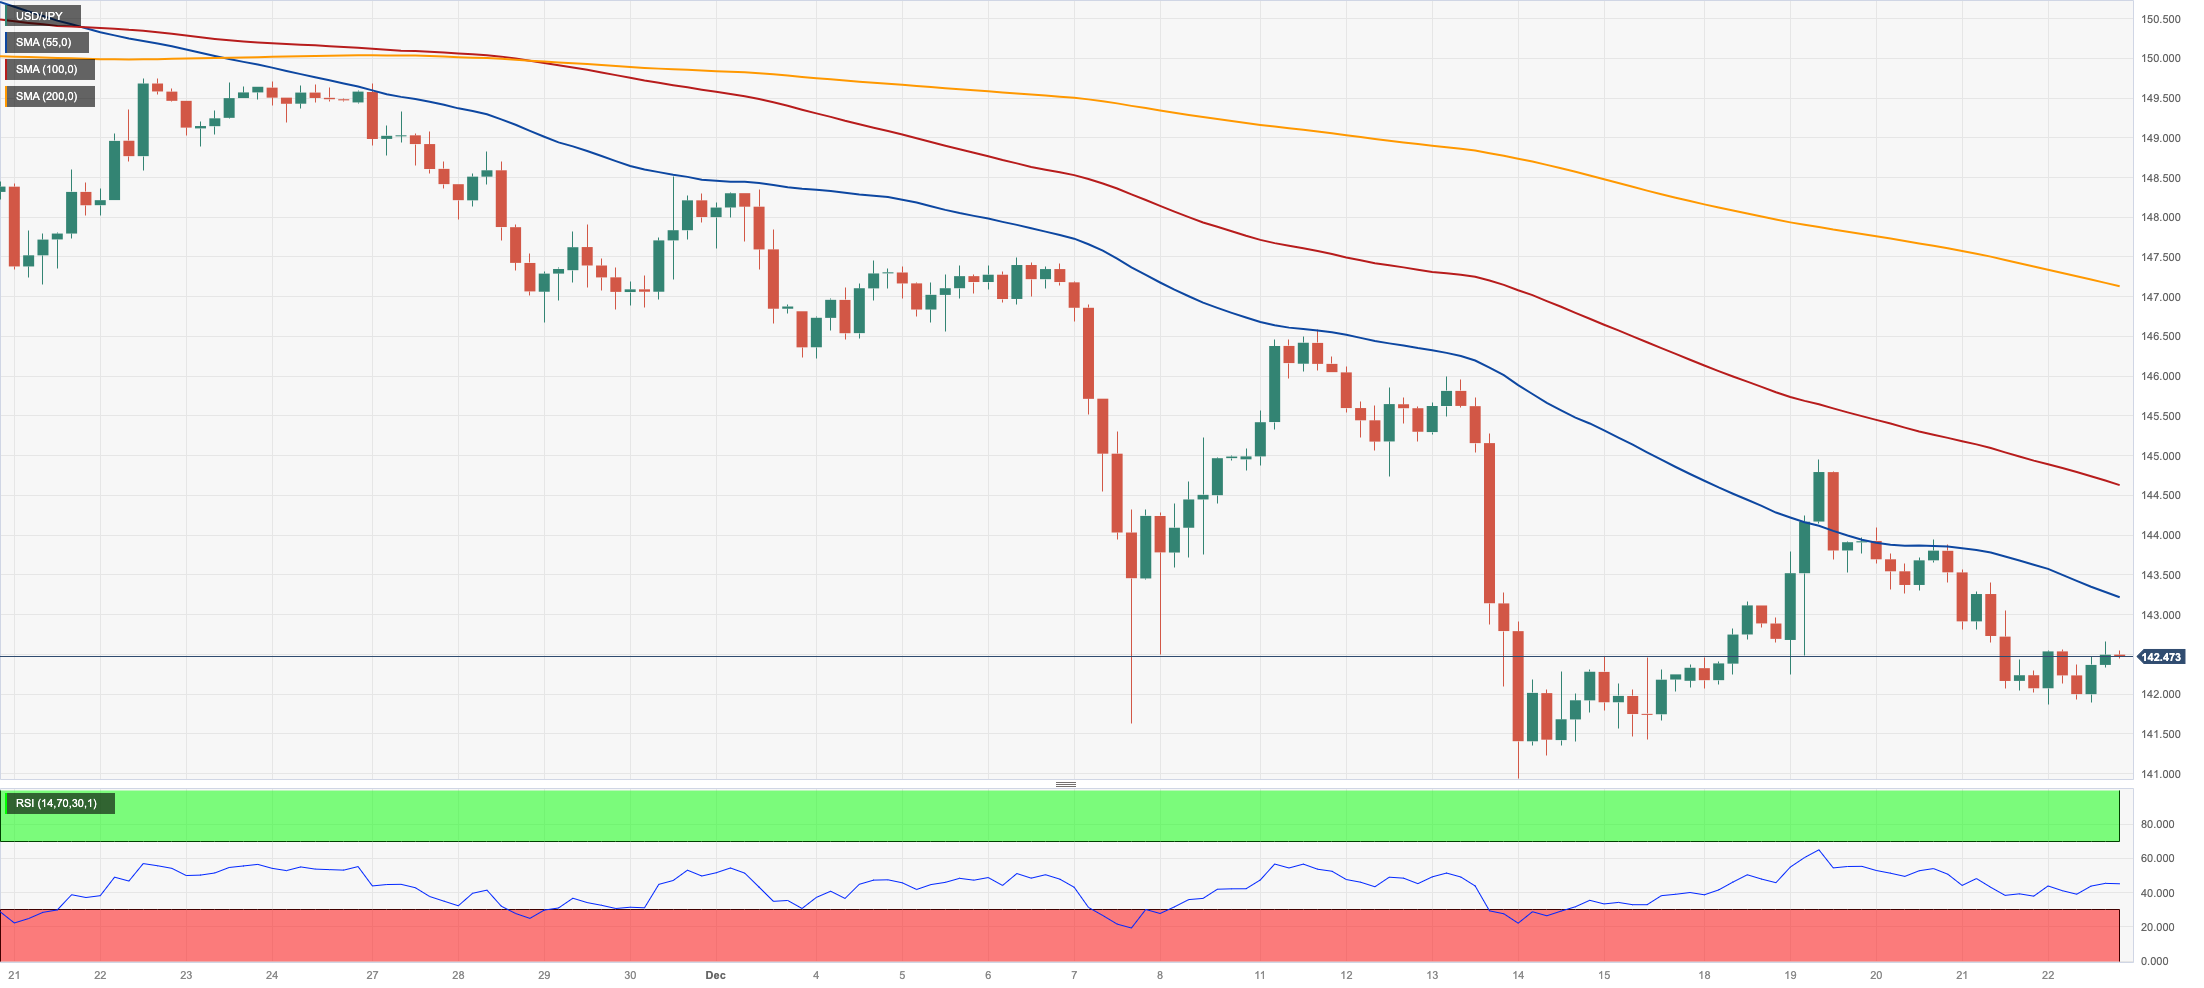
The Japanese yen gave away part of the recent two-day advance and motivated USD/JPY to regain some shine and briefly flirt with the critical 200-day SMA near 142.70, just to retreat a tad afterwards.
The daily uptick in the pair came in tandem with a small knee-jerk in the buck and mixed developments in US yields vs. a climb to three-day highs in JGB 10-year yields.
On another front, the pair remained apathetic after the publication of the BoJ Minutes, which highlighted that board members observed a gradual increase in the probability of reaching the inflation target, although significant uncertainties persisted. Consequently, members expressed the belief that the bank should persist with monetary easing and Yield Curve Control (YCC) with patience.
In the Japanese calendar, the Inflation Rate rose 2.8% YoY in November, while the Core Inflation Rate rose 2.5% YoY and the Inflation Rate Ex-Food and Energy gained 3.8% over the last twelve months. It is worth recalling that all these inflation gauges came in below their previous readings, reinforcing the disinflationary pressures in the country.
If USD/JPY continues to fall, the December low of 140.94 (December 14) is expected to provide early support. The breakdown of this region could prompt spot to confront the round level of 140.00 before the July low of 137.23 (July 14). On the contrary, further advances are aiming toward the weekly top of 144.95 (December 19), which is above the intermediate 55-day SMA of 148.19 and the 2023 peak of 151.90 (November 13). From here, the 2022 high of 151.94 (October 21) precedes the round number of 152.00. The RSI trespassed the 35 hurdle.
Resistance levels: 144.95 146.58 147.51 (4H chart)
Support levels: 141.86 140.94 138.05 (4H chart)
GBPUSD
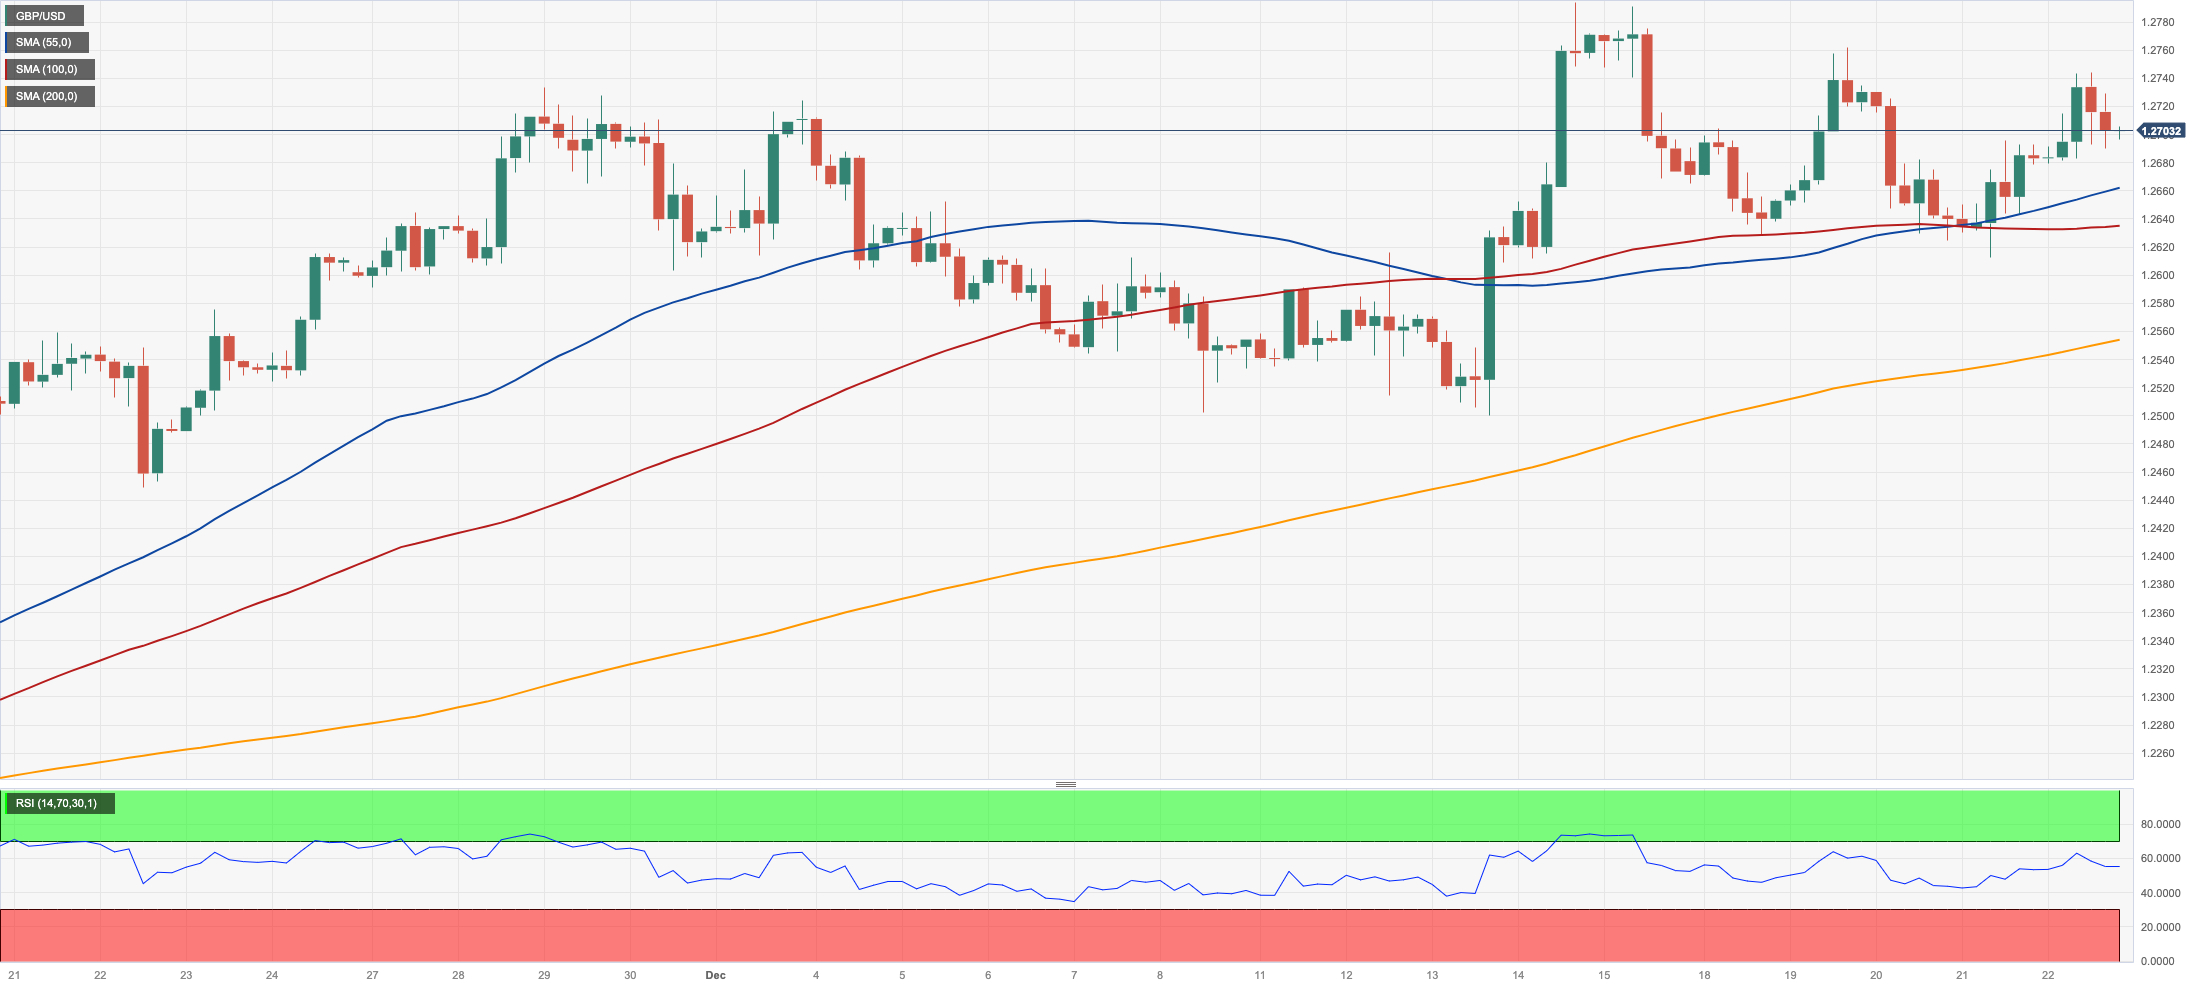
GBP/USD rose to three-day highs near 1.2750 before surrendering almost all of those gains and finishing the week hovering around the 1.2700 neighbourhood.
Despite the somewhat choppy weekly performance, Cable managed to close its second consecutive week of gains, almost exclusively in response to the dollar’s weakness and despite rising bets for BoE easing in H1 2024.
In the UK, final GDP figures showed the economy contracted 0.1% inter-quarter and expanded 0.3% on a yearly basis. In addition, headline Retail Sales increased by 0.1% in the year to November, and Car Production expanded by 14.8% in the year to November.
-638390324645334017.png)
GBP/USD may retest the December high of 1.2793 (December 14), which is followed by weekly tops of 1.2818 (August 10) and 1.2995 (July 27), both of which are above the critical 1.3000 barrier. On the downside, the 200-day SMA is at 1.2515, prior to the December low of 1.2500 (December 13). If the latter fails, the focus will shift to the interim 55-day SMA at 1.2413, which comes ahead of the weekly low of 1.2187 (November 10). The October low of 1.2037 (October 3), the crucial 1.2000 level, and the 2023 bottom of 1.1802 (March 8) are all aligned down from here. The daily RSI rose a tad to the boundaries of 58.
Resistance levels: 1.2793 1.2800 1.2995 (4H chart)
Support levels: 1.2612 1.2500 1.2448 (4H chart)
AUDUSD
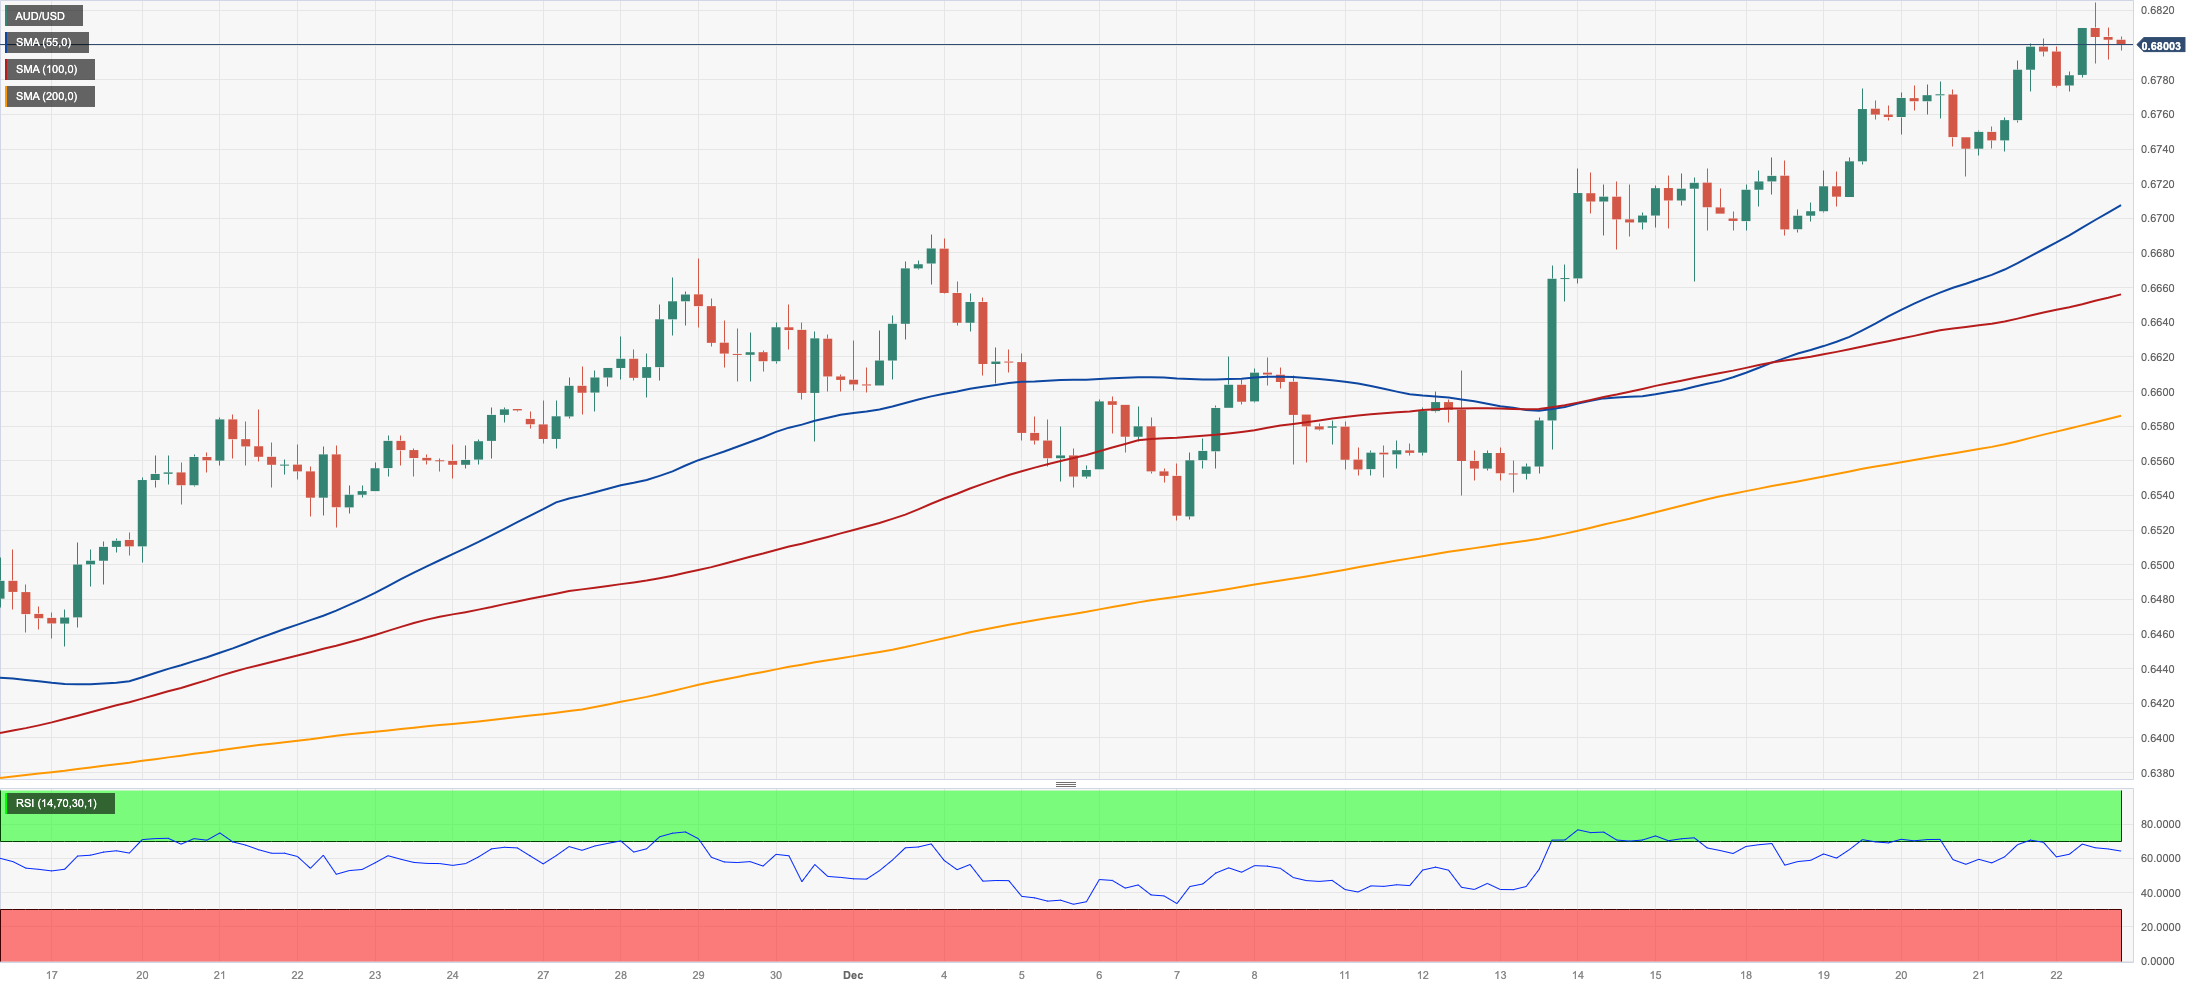
AUD/USD rose to a new five-month peak past 0.6820 on Friday, although it eventually succumbed to the selling pressure and ended the week around 0.6800 the figure.
The small pullback, however, could not dent the positive momentum in the Aussie dollar, which extended gains for the second week in a row.
A small retracement in the greenback accompanied the move lower in the pair, which remained unable to derive some strength from the positive session in both copper and iron ore.
In Australia, Housing Credit increased by 0.4% MoM in November.
The trespass of the December high of 0.6824 (December 22) might pave the way for a trip to the July top of 0.6894 (July 14) and the June peak of 0.6899 (June 16), both of which are located just before the crucial 0.7000 yardstick. AUD/USD, on the flip side, is projected to face immediate contention at the pivotal 200-day SMA of 0.6578, which is above the December low of 0.6525 (December 7). Further south, the 2023 low of 0.6270 (October 26) emerges ahead of the round level of 0.6200 and the 2022 low of 0.6169 (October 13). The daily RSI receded to the 69 region.
Resistance levels: 0.6824 0.6846 0.6894 (4H chart)
Support levels: 0.6723 0.6663 0.6580 (4H chart)
GOLD
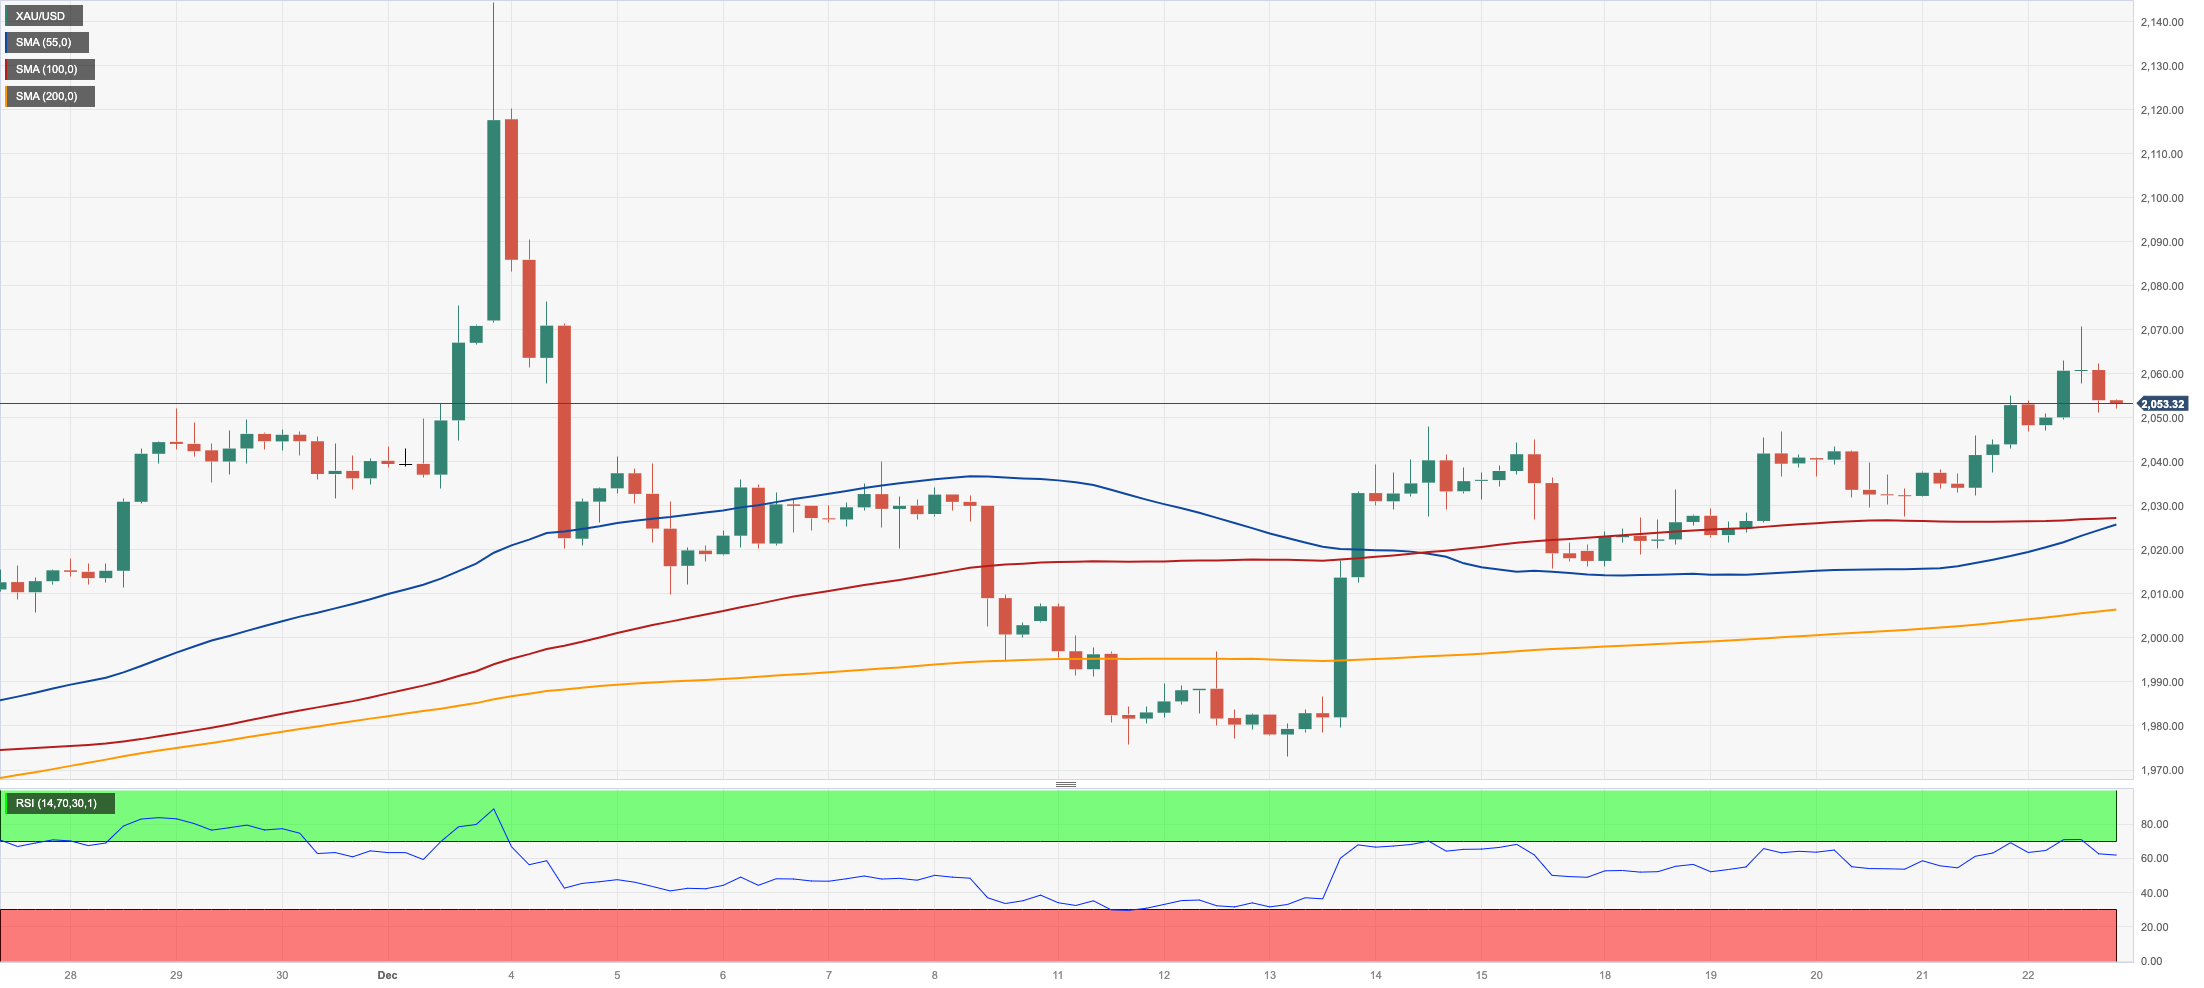
Further gains lifted gold prices to the $2070 region per troy ounce at the end of the week, or two-week peaks.
Bullion's second consecutive session of gains appeared underpinned by the bearish tone in the greenback, while the mixed activity in US yields across the board also added to the advance of the precious metal.
Currently, the sentiment surrounding the yellow metal is expected to be influenced by fluctuating expectations regarding potential interest rate cuts by the Fed in the first half of the next year. These expectations are likely to play a significant role in shaping market sentiment towards gold in the near term.
If gold prices continue to rise, the next up-barrier is expected at the December top of $2070 (December 22), ahead of the all-time peak of $2150 (December 4). Instead, further retracement would be met with rapid support in the $2000 zone. The failure of this region might trigger a further plunge to the December low of $1973 (December 13), which is ahead of the 200-day SMA of $1958. From here, the November low of $1931 (November 13) appears, seconded by the October low of $1810 (October 6), the 2023 bottom of $1804 (February 28), and ultimately the important $1800 contention zone.
Resistance levels: $2070 $2149 (4H chart)
Support levels: $2015 $2005 $1973 (4H chart)
CRUDE WTI
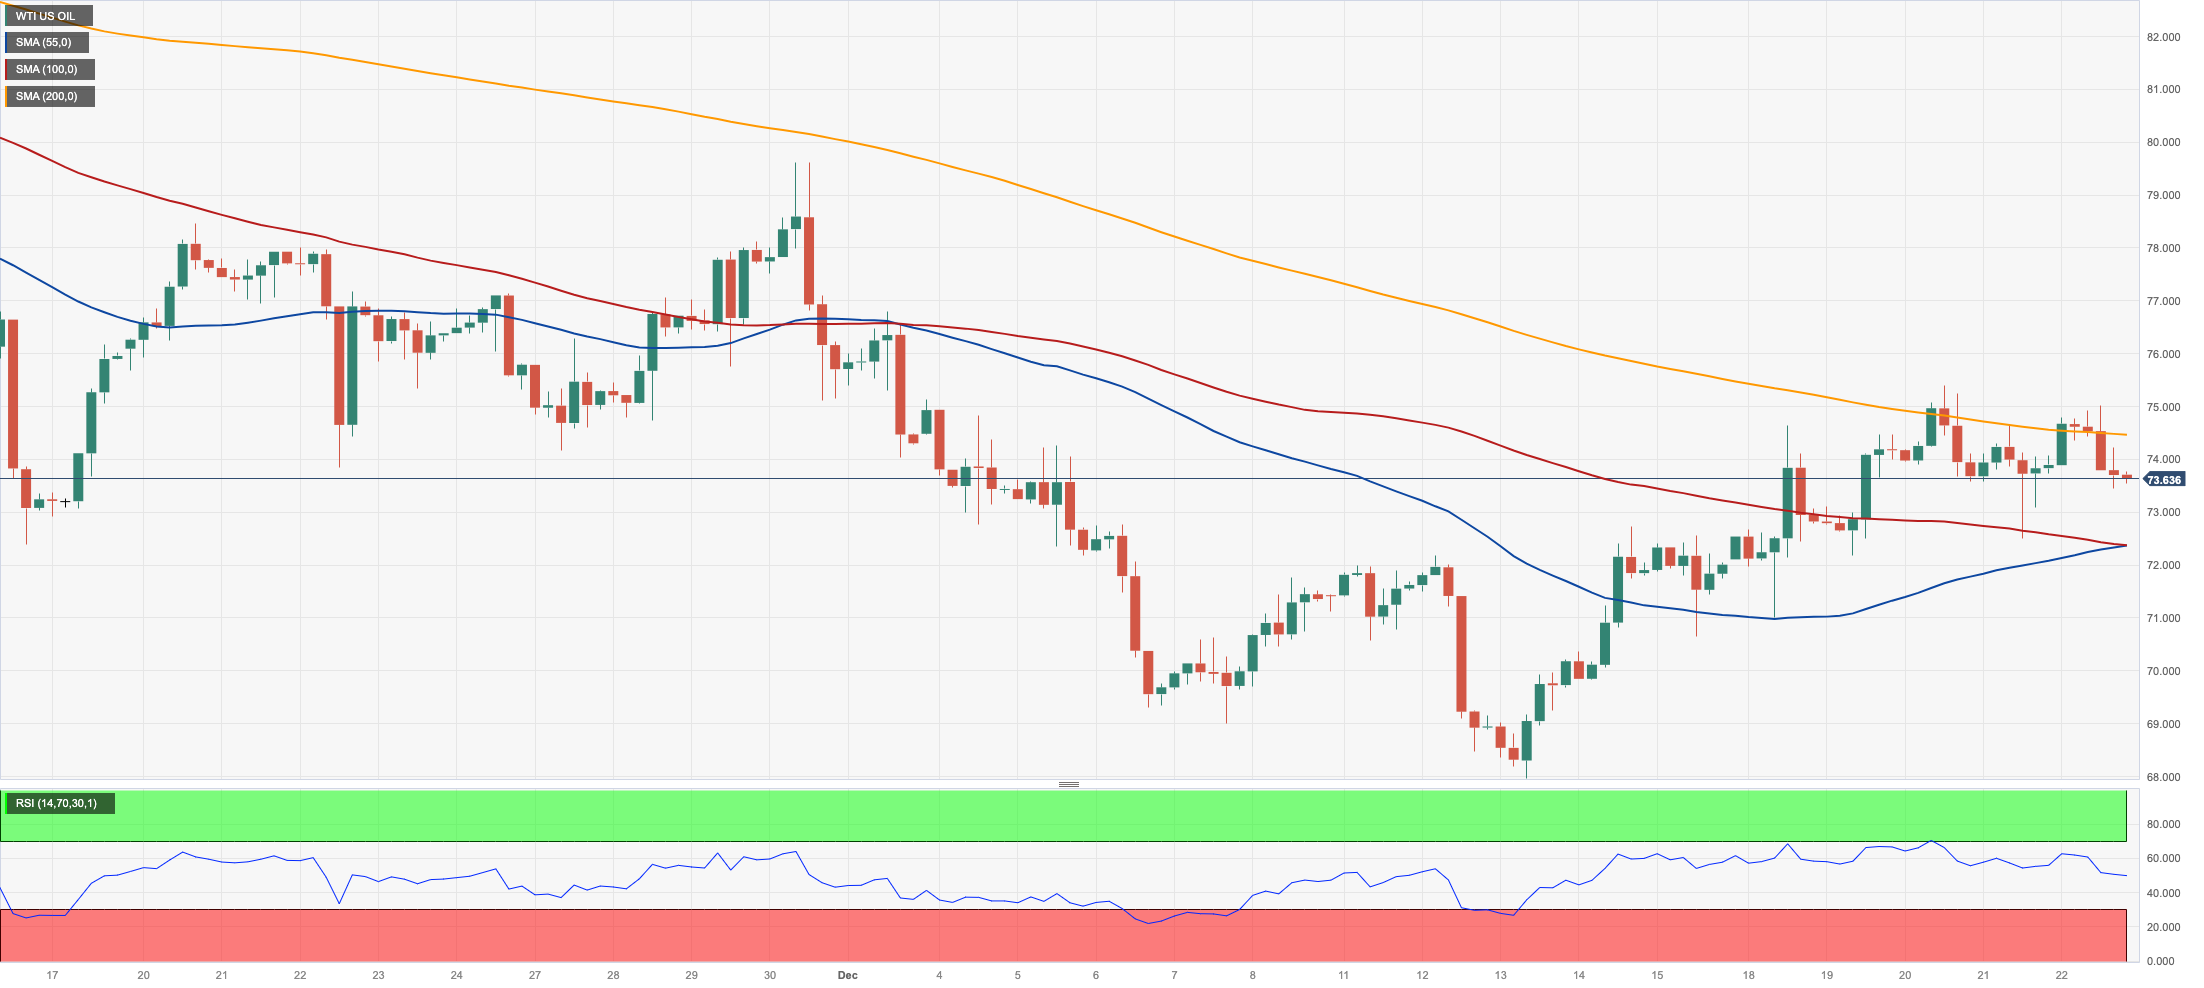
WTI prices remained choppy in the latter part of the week, although they succeeded in extending their gains for the second straight week on Friday.
Despite Friday’s small losses, crude oil prices remained bolstered by persistent geopolitical effervescence, particularly in the Red Sea, which kept the supply disruption narrative well in place for yet another session.
In the meantime, traders remained concerned about the recently announced plans by Angola to exit the OPEC, which is expected to cast further doubts over the cartel’s ability to maintain its planned oil output reductions.
Closing the weekly docket, driller Baker Hughes reported that the total number of US active oil rigs went down by 3 to 498 in the week to December 22.
The 200-day SMA at $77.74 is WTI's next upward target, followed by the critical $80.00 level and the November high of $80.15 (November 3). Further increases from here may take the market back to its weekly top of $89.83 (October 18), followed by the 2023 peak of $94.99 (September 28) and the August 2022 high of $97.65 (August 30), all preceding the significant $100.00 threshold. Having said that, a break below the December low of $67.74 (December 13) might result in a deeper slide to the 2023 low of $63.61 (May 4) before the important $60.00 support.
Resistance levels: $75.34 $76.72 $79.56 (4H chart)
Support levels: $72.41 $70.28 $67.68 (4H chart)
DOW JONES
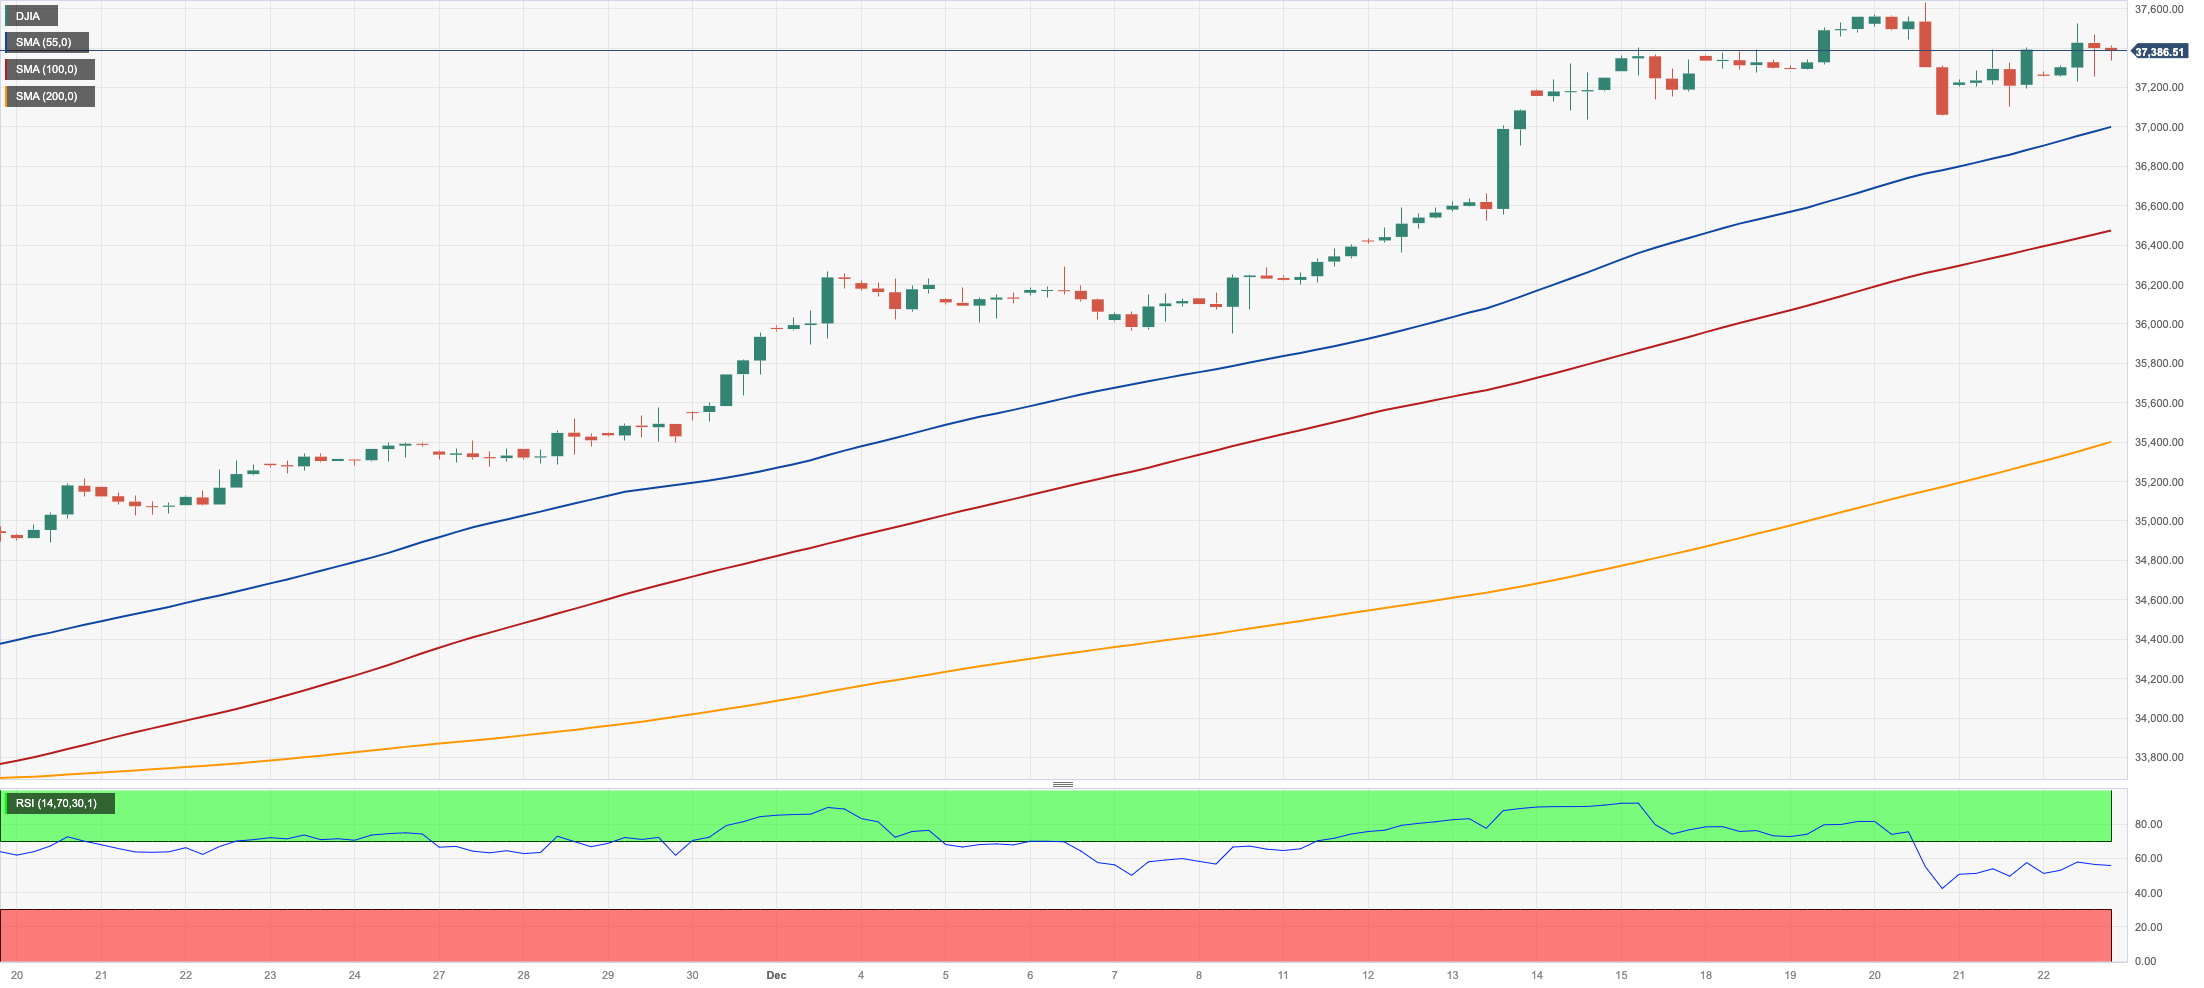
US equities tracked by the Dow Jones receded marginally and ended Friday’s session around the 37400 zone. The index, in the meantime, extended its rally for the eighth consecutive week.
The persistent downtrend in US inflation, this time from PCE readings, propped up the case for interest rate cuts by the Fed as soon as in the spring of 2024, while rising hopes of a “soft landing“ of the economy also underpinned the sentiment.
Additionally, the weaker dollar and mixed US yields across the board seem to have also limited the downside in the Dow at the end of the week.
At the end of the week, the Dow Jones dropped 0.05% to 37385, the S&P500 gained 0.17% to 4754, and the tech-oriented Nasdaq Composite advanced 0.19% to 14992.
If bulls maintain control, the Dow’s next target is expected at the all-time high of 37641 (December 20). The other way around, there is immediate contention at the weekly low of 37073 (December 20) prior to the December low of 36010 (December 5) and the key 200-day SMA at 34184. Down from here aligns the weekly low of 33859 (November 7) prior to the October low of 32327 (October 27) and the 2023 low of 31429 (March 15). The loss of the latter exposes the 2022 low of 28660 (October 13). The daily RSI hovered around 74, suggesting that the market was still overbought.
Top Performers: Intel, Amgen, Merck&Co
Worst Performers: Nike, Walt Disney, Boeing
Resistance levels: 37641 (4H chart)
Support levels: 37073 36021 34681 (4H chart)
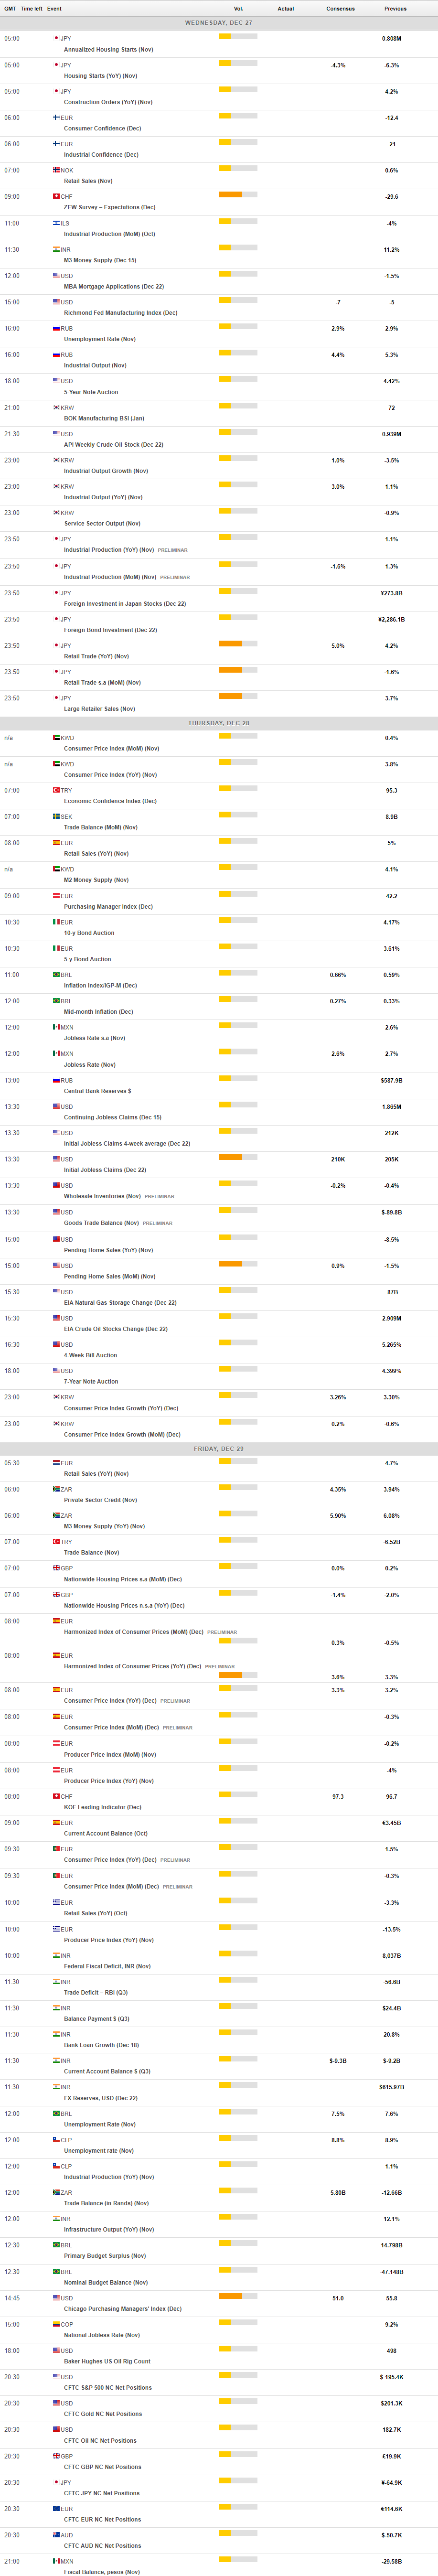
MACROECONOMIC EVENTS
All Information & Updates provided by:

All information relating to the financial markets available on this page has been prepared and issued by FXStreet (Forexstreet SL, Spain, Reg: B62498233) on the basis of publicly available information and all information believed to be reliable and does not conflict with Kuwaiti local laws, and all necessary care has been taken to before the company to ensure that the facts mentioned are correct from the source.
NCM Investment nor any of its directors or employees shall in any way be held responsible for the contents of this news, and the information contained on this page is intended only to provide clients with publicly available information and should not be construed as investment advice, report or analysis and/or constitute an offer or invitation to buy or sell financial instruments of any kind.
RISK WARNING: Forex and CFDs are highly risky leveraged products, as losses can exceed deposits. Please ensure you understand all the risks and take independent advice if necessary. NCM will segregate the clients based on the criteria of the regulator and its bylaws. NCM does not provide any advisory service; the material published does not constitute advice or a recommendation for a transaction in any financial instrument. NCM accepts no responsibility for any use of the content presented and any consequences of that use. Anyone acting on the information provided does so at their own risk.