
- Contact Us:
-

-

-

-


Daily Market Updates
01 Jan 2024
USDJPY
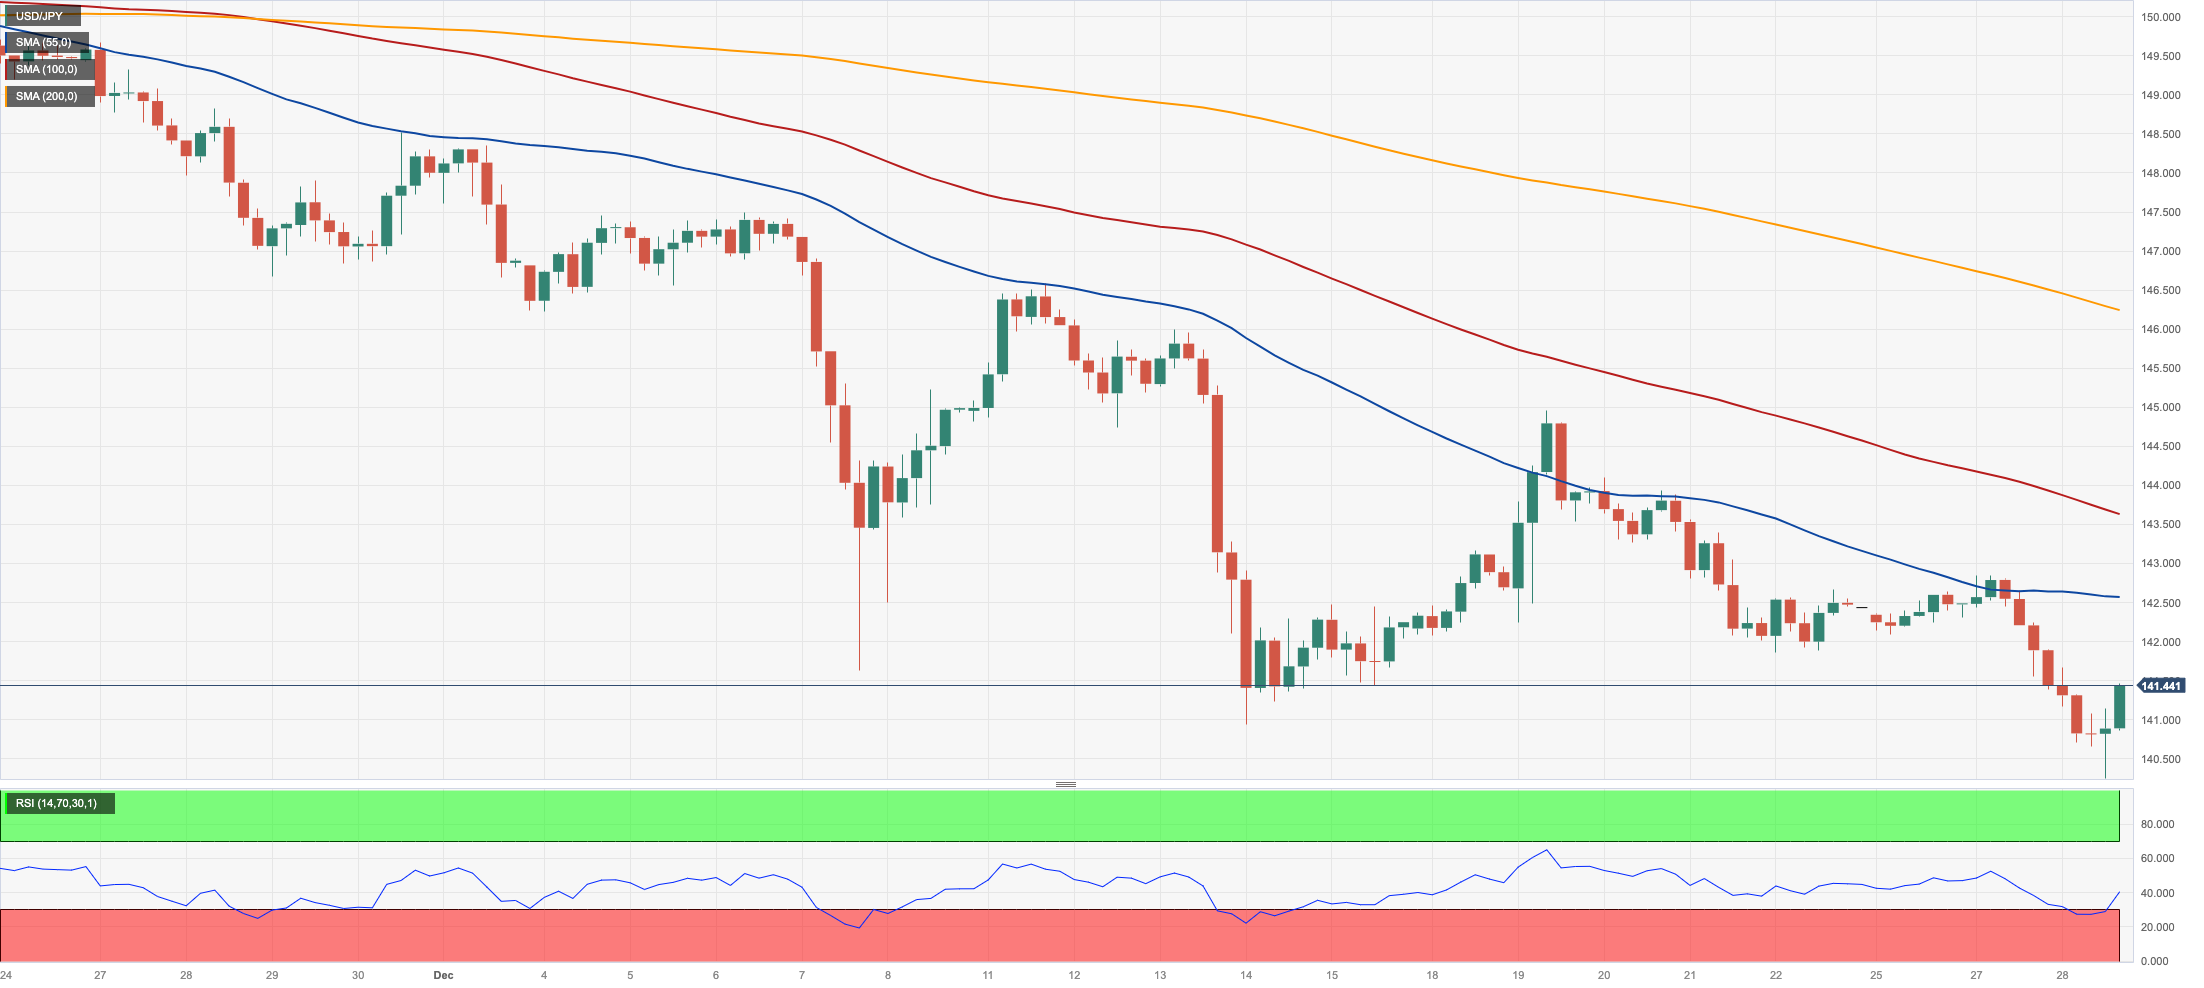
USD/JPY added to the weekly leg lower and clocked a new five-month low near 140.20, just to regain some balance and reclaim the 141.00 hurdle and beyond towards the end of the NA session on Thursday.
The move lower in spot came amidst the robust recovery in the dollar, while US yields also regained some shine vs. a slight decline in the JGB 10-year yields.
In the Japanese calendar, Foreign Bond Investment shrank by ¥167.4B in the week to December 23, preliminary Industrial Production dropped by 1.4% YoY in November, and Retail Sales expanded by 5.3% in November from a year earlier.
The continuation of selling pressure might cause the USD/JPY to revert to its December low of 140.25. (December 28). If this zone fails, spot might test the round level of 140.00 before the July low of 137.23 (July 14). The breakdown of this region could see the next target at the March low of 129.63 (March 24). Further advances, on the other hand, are directed toward the pivotal 200-day SMA of 142.95, ahead of the weekly high of 144.95 (December 19), which is above the transitory 55-day SMA of 147.67 and the 2023 top of 151.90 (November 13). Further up comes the 2022 peak of 151.94 (October 21) prior to the round number of 152.00. The RSI retreated to the 33 zone.
Resistance levels: 144.95 146.58 147.51 (4H chart)
Support levels: 140.24 140.00 137.23 (4H chart)
GBPUSD
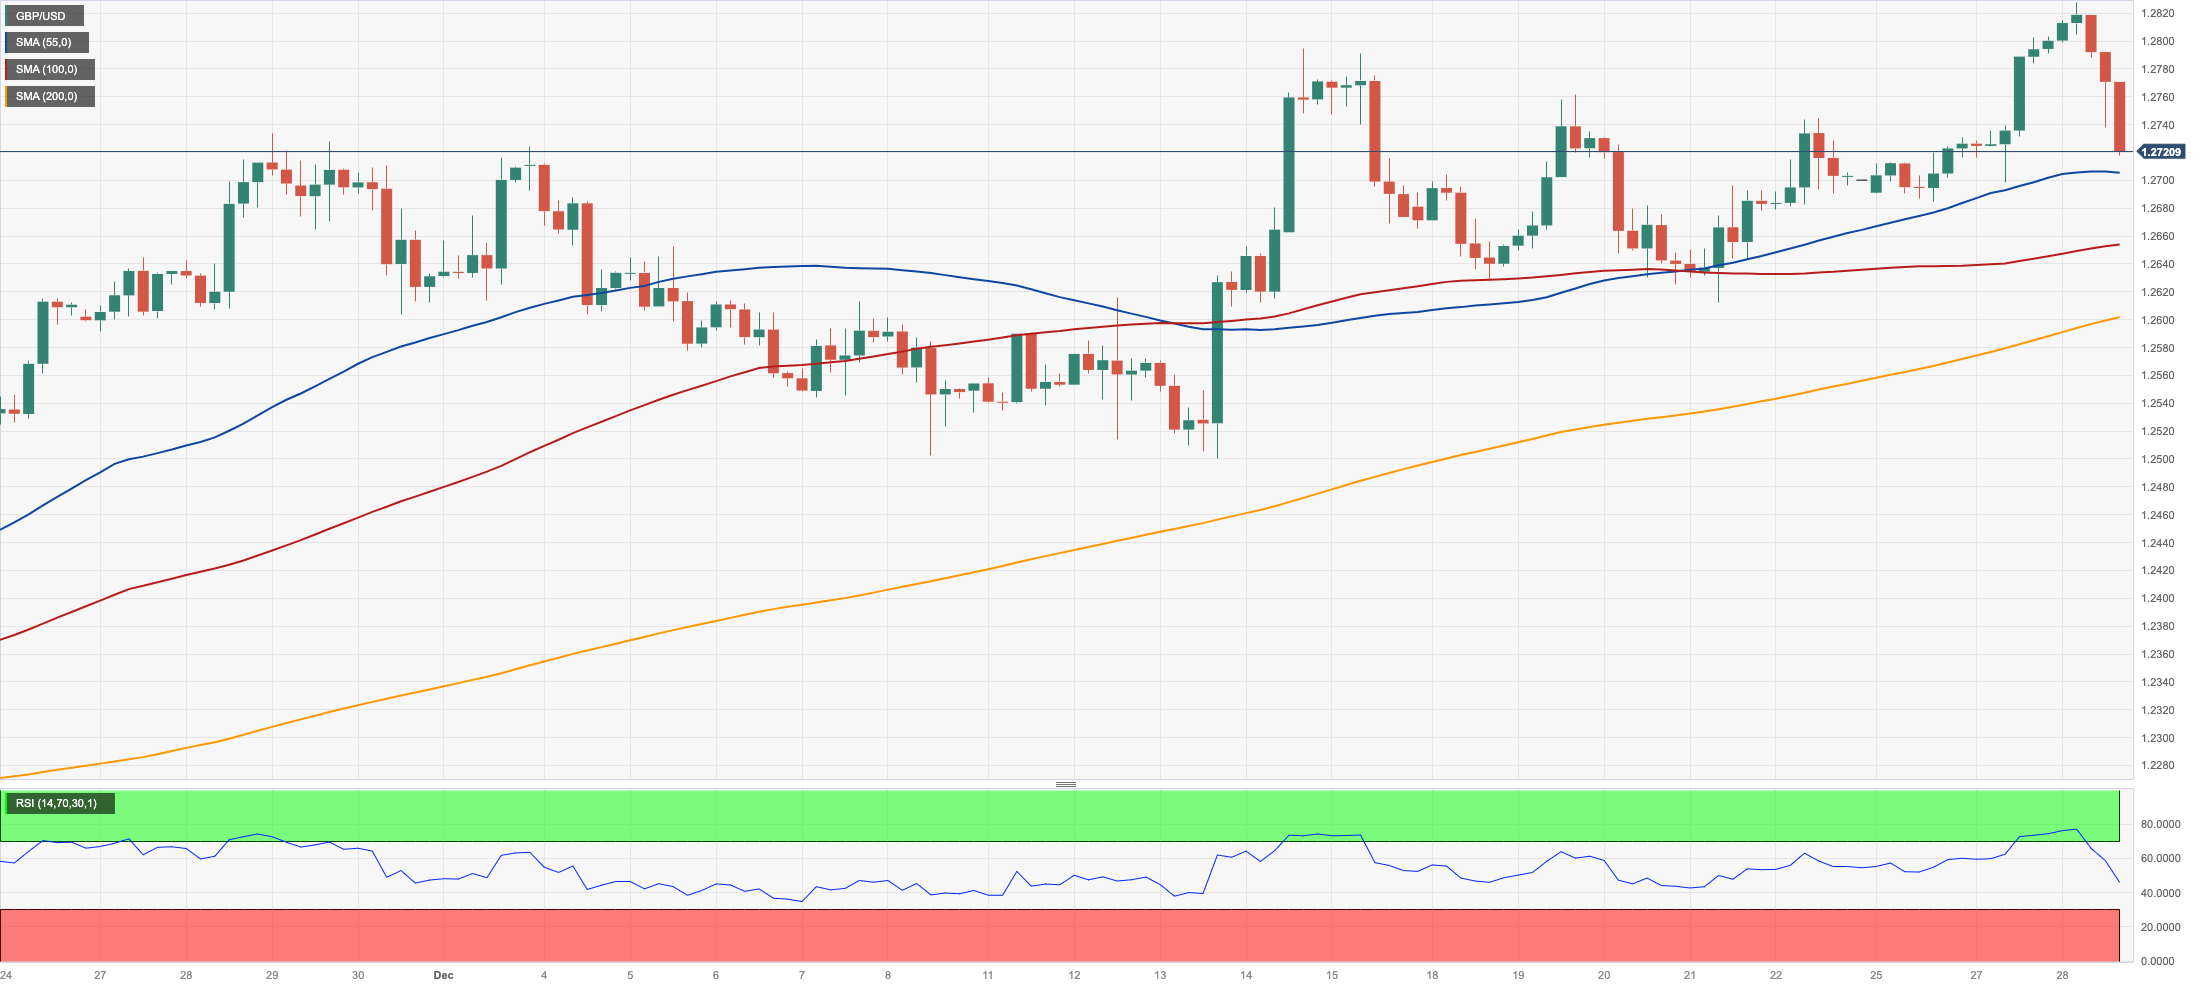
GBP/USD could not sustain the early move to new four-month peaks north of the 1.2800 barrier, eventually succumbing to the renewed selling pressure and ending Thursday’s session markedly lower near 1.2700.
The daily pullback in Cable came amidst a sharp bounce in the greenback and a modest uptick in UK 10-year gilt yields to the boundaries of 3.50% following recent multi-month lows.
The UK docket was empty on Thursday.
GBP/USD may retest the December peak of 1.2827 (December 28), followed by the weekly high of 1.2995 (July 27), which comes just ahead of the critical 1.3000 threshold. On the downside, the 200-day SMA is at 1.2523, seconded by the December low of 1.2500 (December 13) and the intermediate 55-day SMA at 1.2439. The loss of the latter exposes the weekly low of 1.2187 (November 10), which is followed by the October low of 1.2037 (October 3), the crucial 1.2000 level, and the 2023 bottom of 1.1802 (March 8). The daily RSI dropped to the sub-57 zone.
Resistance levels: 1.2827 1.2888 1.2995 (4H chart)
Support levels: 1.2612 1.2584 1.2500 (4H chart)
AUDUSD
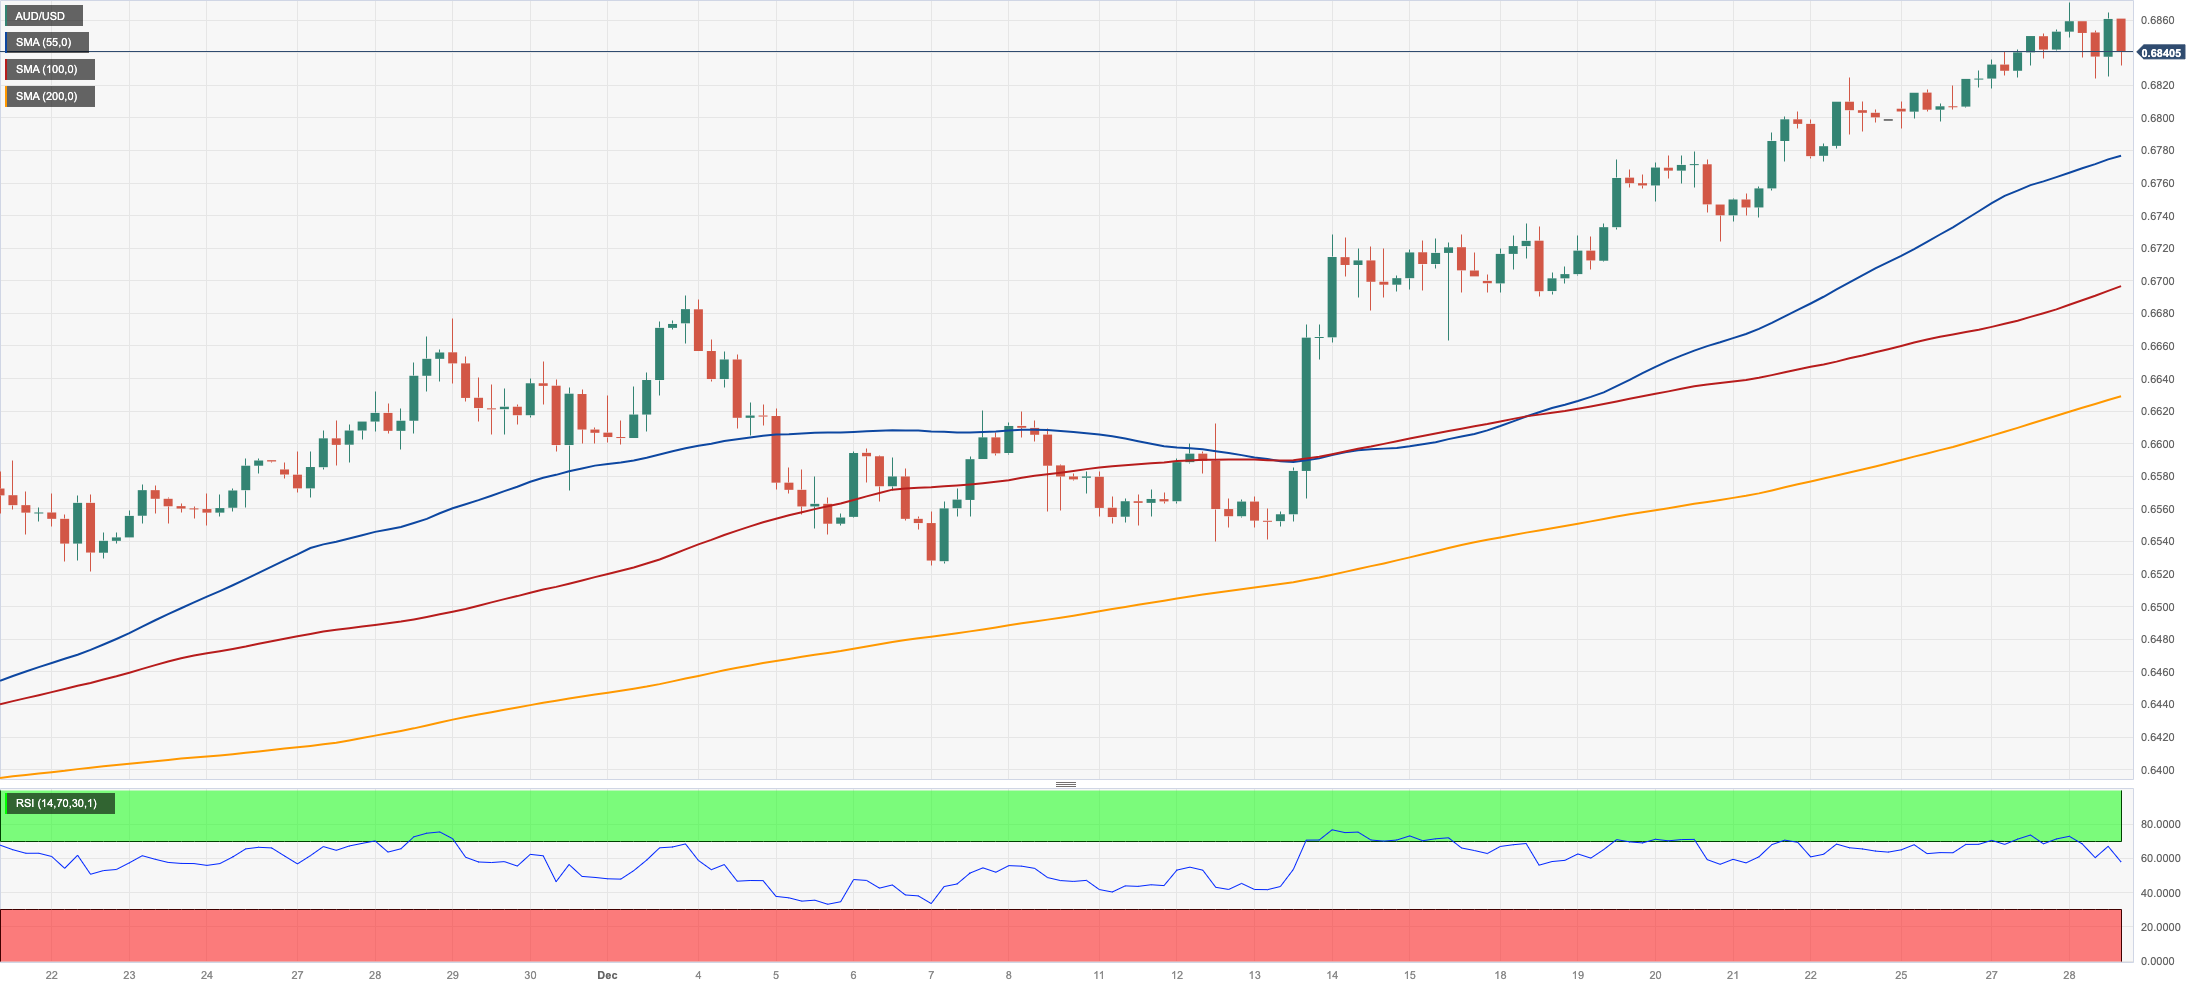
AUD/USD advanced to a new five-month top near 0.6870 before surrendering those gains and finishing the day in the low-0.6800s on Thursday.
Price action around the Aussie dollar was accompanied by the late bounce in the greenback, the generalized knee-jerk in the risk-linked assets, and the broad-based negative performance in the commodity complex.
There were no data releases scheduled in Oz on Thursday.
The breakout of the December peak of 0.6871 (December 28) may pave the way for a trip to the July high of 0.6894 (July 14) and the June top of 0.6899 (June 16), both of which are located just before the important 0.7000 yardstick. On the flip side, AUD/USD is projected to encounter immediate support at the key 200-day SMA of 0.6580, prior to the December low of 0.6525 (December 7). Further south, the 2023 low of 0.6270 (October 26) emerges ahead of the 0.6200 round level, while the loss of the latter exposes the 2022 bottom of 0.6169 (October 13). The daily RSI dropped below the 70 threshold, abandoning the overbought zone.
Resistance levels: 0.6871 0.6894 0.7029 (4H chart)
Support levels: 0.6723 0.6663 0.6525 (4H chart)
GOLD
The late rebound in the greenback prompted a small pullback in prices of the yellow metal on Thursday.
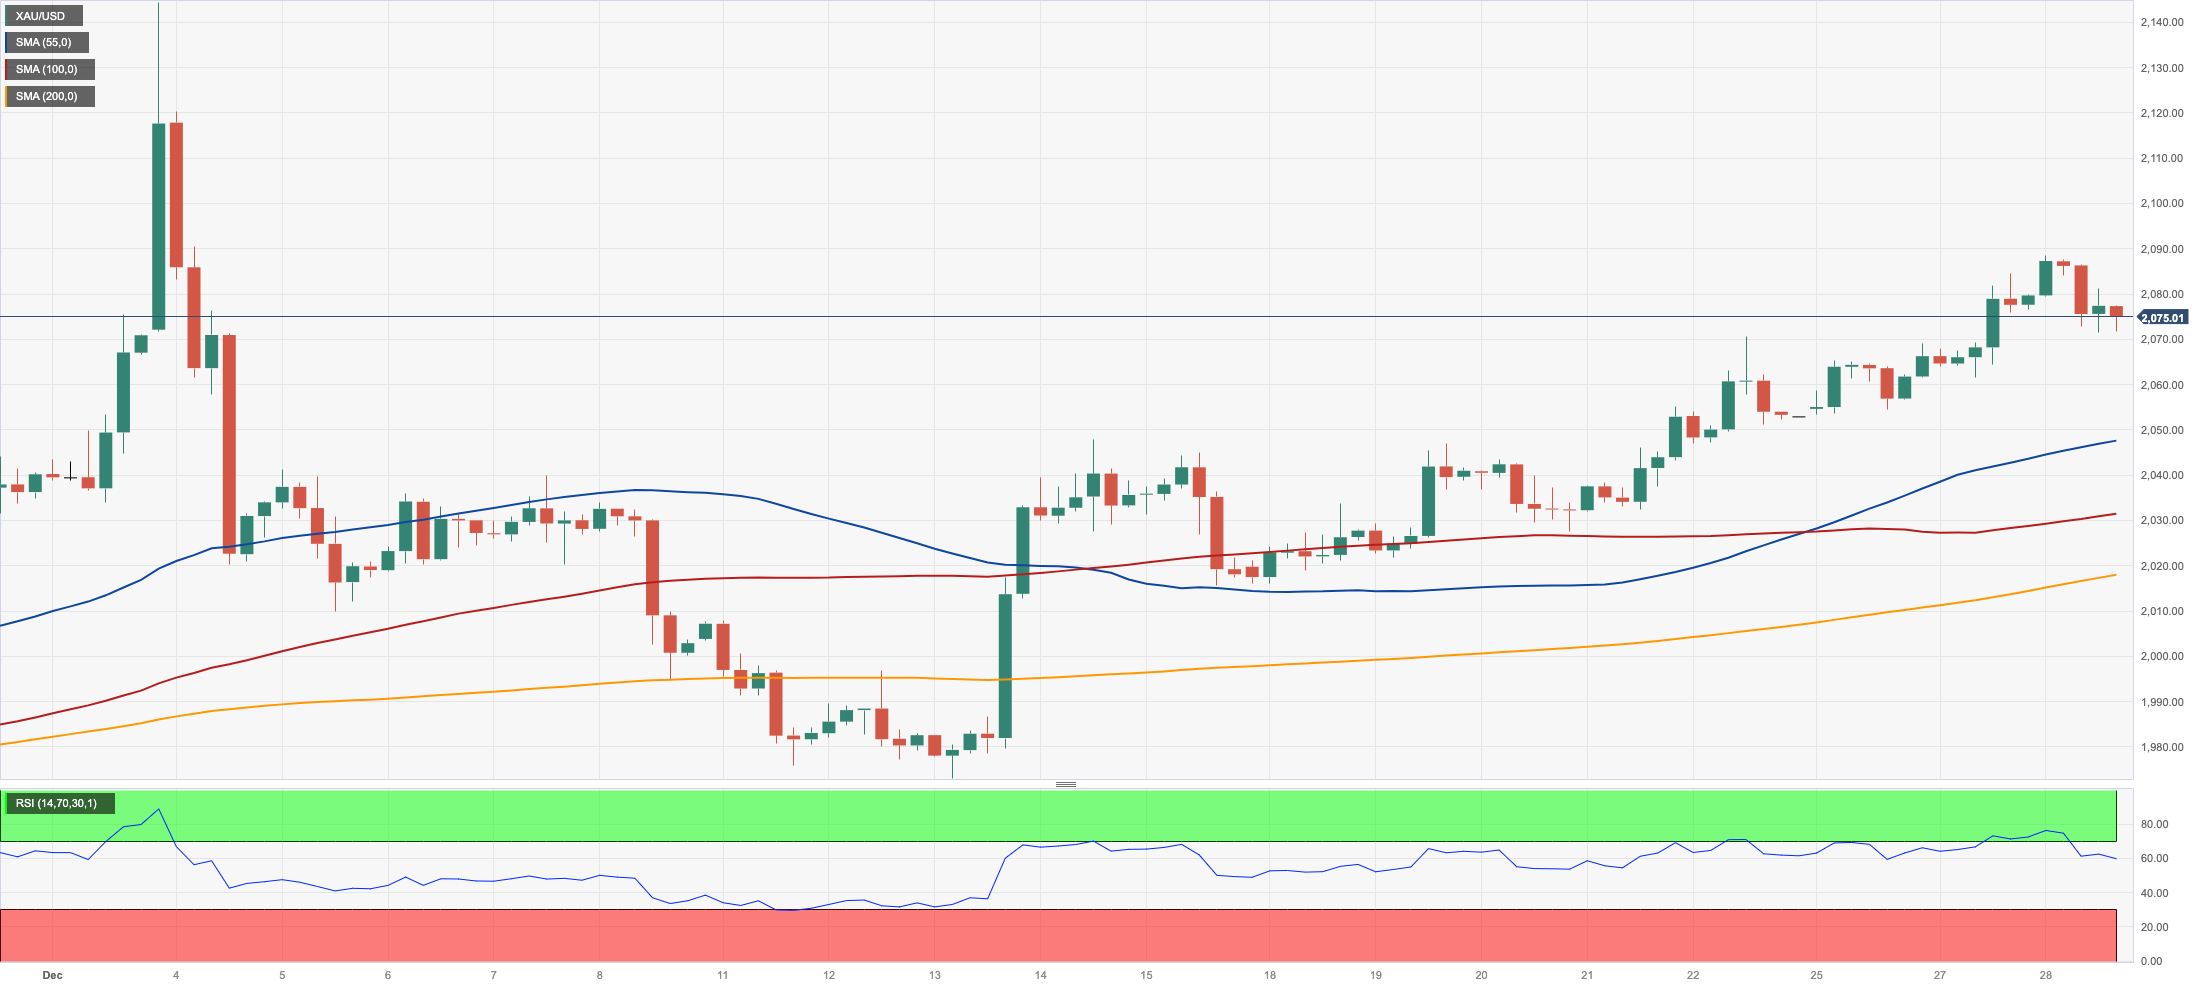
Indeed, gold prices halted their multi-session rally after hitting new three-week peaks near the $2090 mark per troy ounce.
The corrective move in the precious metal was also in tandem with the mild recovery in US yields across different timeframes.
Meanwhile, the sentiment surrounding gold is expected to continue to be influenced by speculation of interest rate cuts by the Fed in the second quarter of 2024.
If gold prices continue to rise, the next resistance level is expected to be the December high of $2088 (December 28), seconded by the all-time top of $2150 (December 4). In the opposite direction, immediate contention aligns around the $2000 zone. If this area is cleared, the metal might fall to the December bottom of $1973 (December 13), which comes ahead of the 200-day SMA of $1960 and the November low of $1931 (November 13). South of here, the October low of $1810 (October 6), the 2023 bottom of $1804 (February 28), and, eventually, the critical $1800 contention zone appear.
Resistance levels: $2088 $2149 (4H chart)
Support levels: $2047 $2014 $1973 (4H chart)
CRUDE WTI
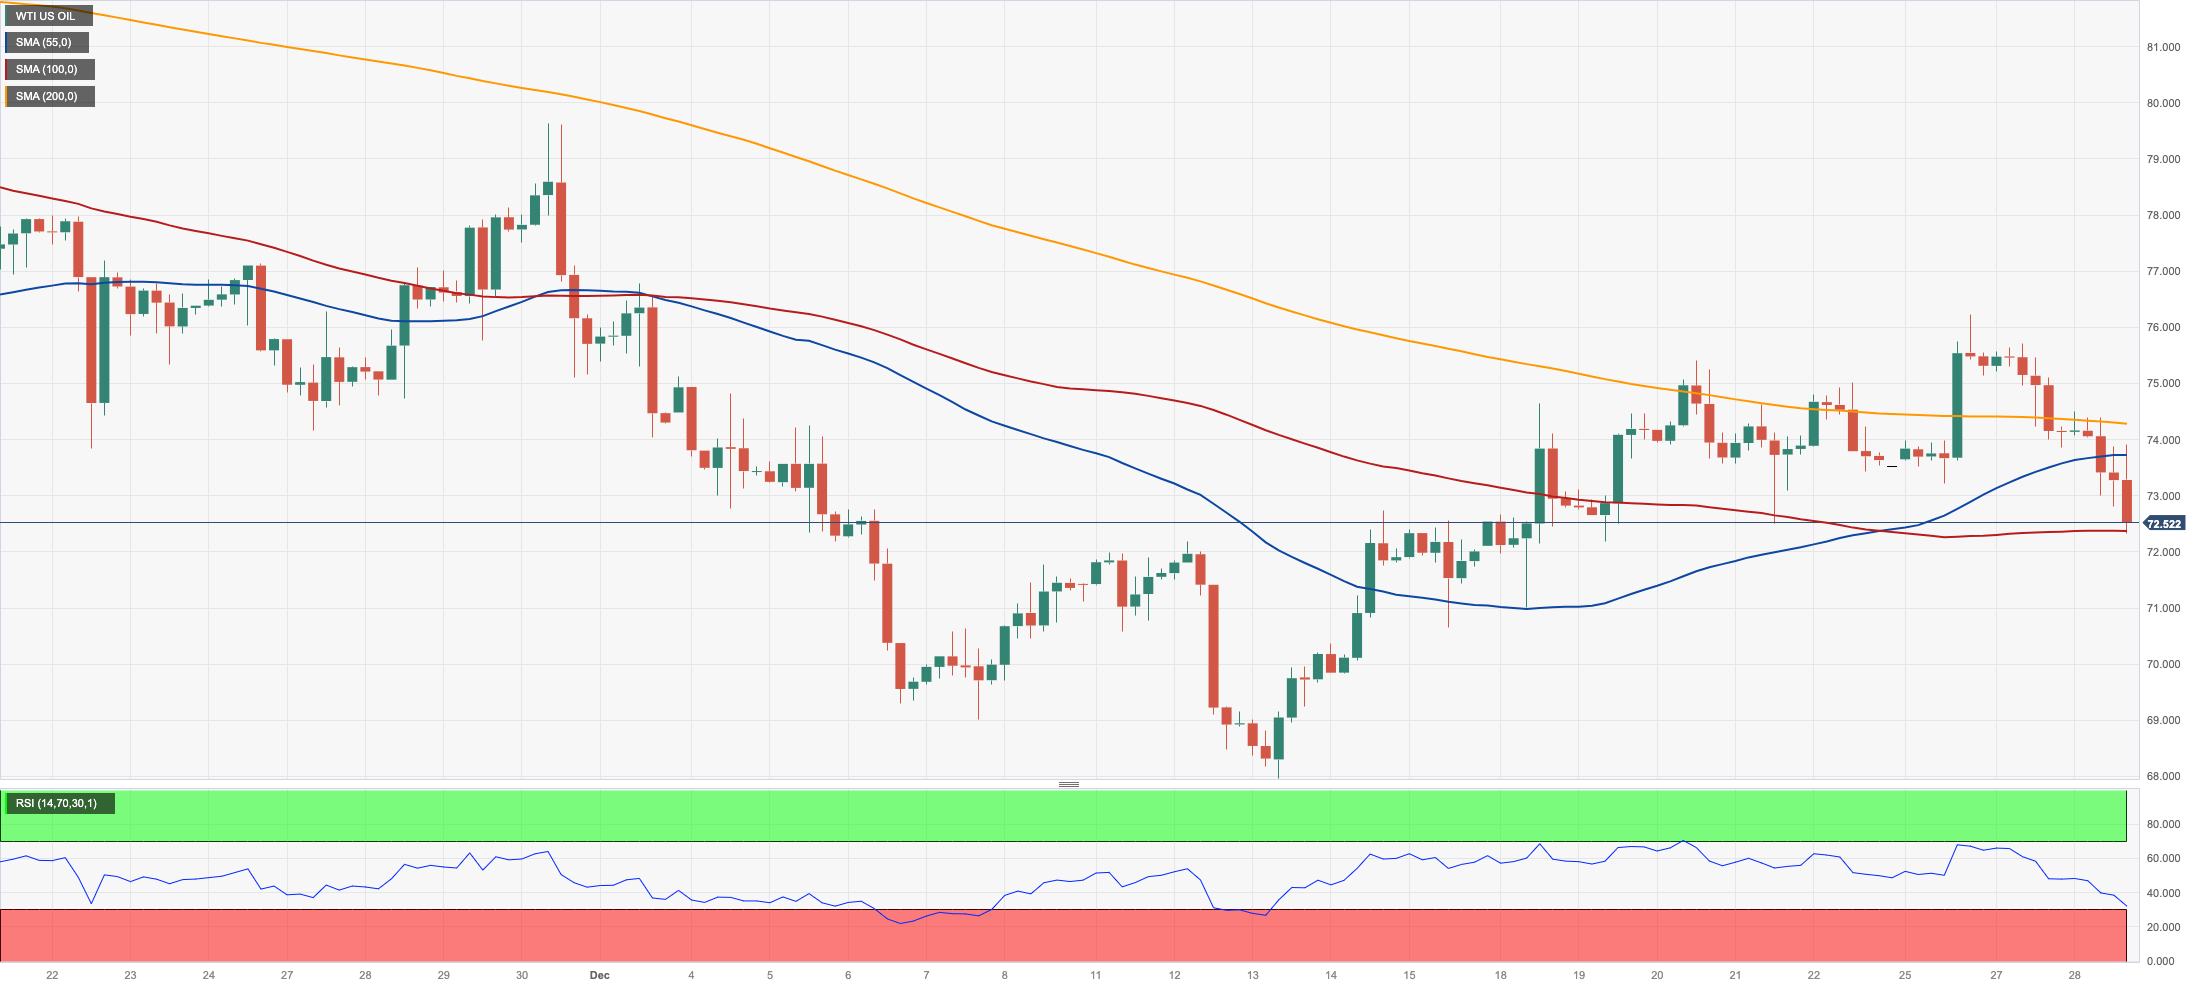
Prices of WTI added to Wednesday’s pullback and clinched fresh weekly lows in the vicinity of the $72.00 mark per barrel on Thursday.
The continuation of the corrective downside in the commodity came in response to news that shipping companies are expected to return to the Red Sea routes, which helps reduce concerns over potential disruptions after recent attacks by Houthi rebels.
Meanwhile, the ongoing Israel-Hamas conflict and increasing speculation of interest rate cuts by the Federal Reserve in the first half of 2024 seem to provide support for crude oil prices in the long term.
Looking at the calendar, the larger-than-anticipated decrease in weekly US crude oil inventories could not prevent the commodity from shedding further ground either.
On the latter, the EIA reported that US crude oil inventories shrank by 6.911M barrels in the week to December 22, while supplies at Cushing increased by 1.508M barrels, Weekly Distillate Stocks went up by 0.833M barrels and gasoline stockpiles dropped by 0.575M barrels.
The 200-day SMA at $77.84 is the next upward target for WTI, followed by the important $80.00 barrier and the November high of $80.15 (November 3). Further increases from here may take the market back to its weekly top of $89.83 (October 18), ahead of the 2023 peak of $94.99 (September 28) and the August 2022 high of $97.65 (August 30), all before the critical $100.00 level. Having said that, a break below the December low of $67.74 (December 13) might result in a further decline to the 2023 low of $63.61 (May 4) before the important $60.00 support.
Resistance levels: $76.14 $76.72 $79.56 (4H chart)
Support levels: $72.18 $70.28 $67.68 (4H chart)
DOW JONES
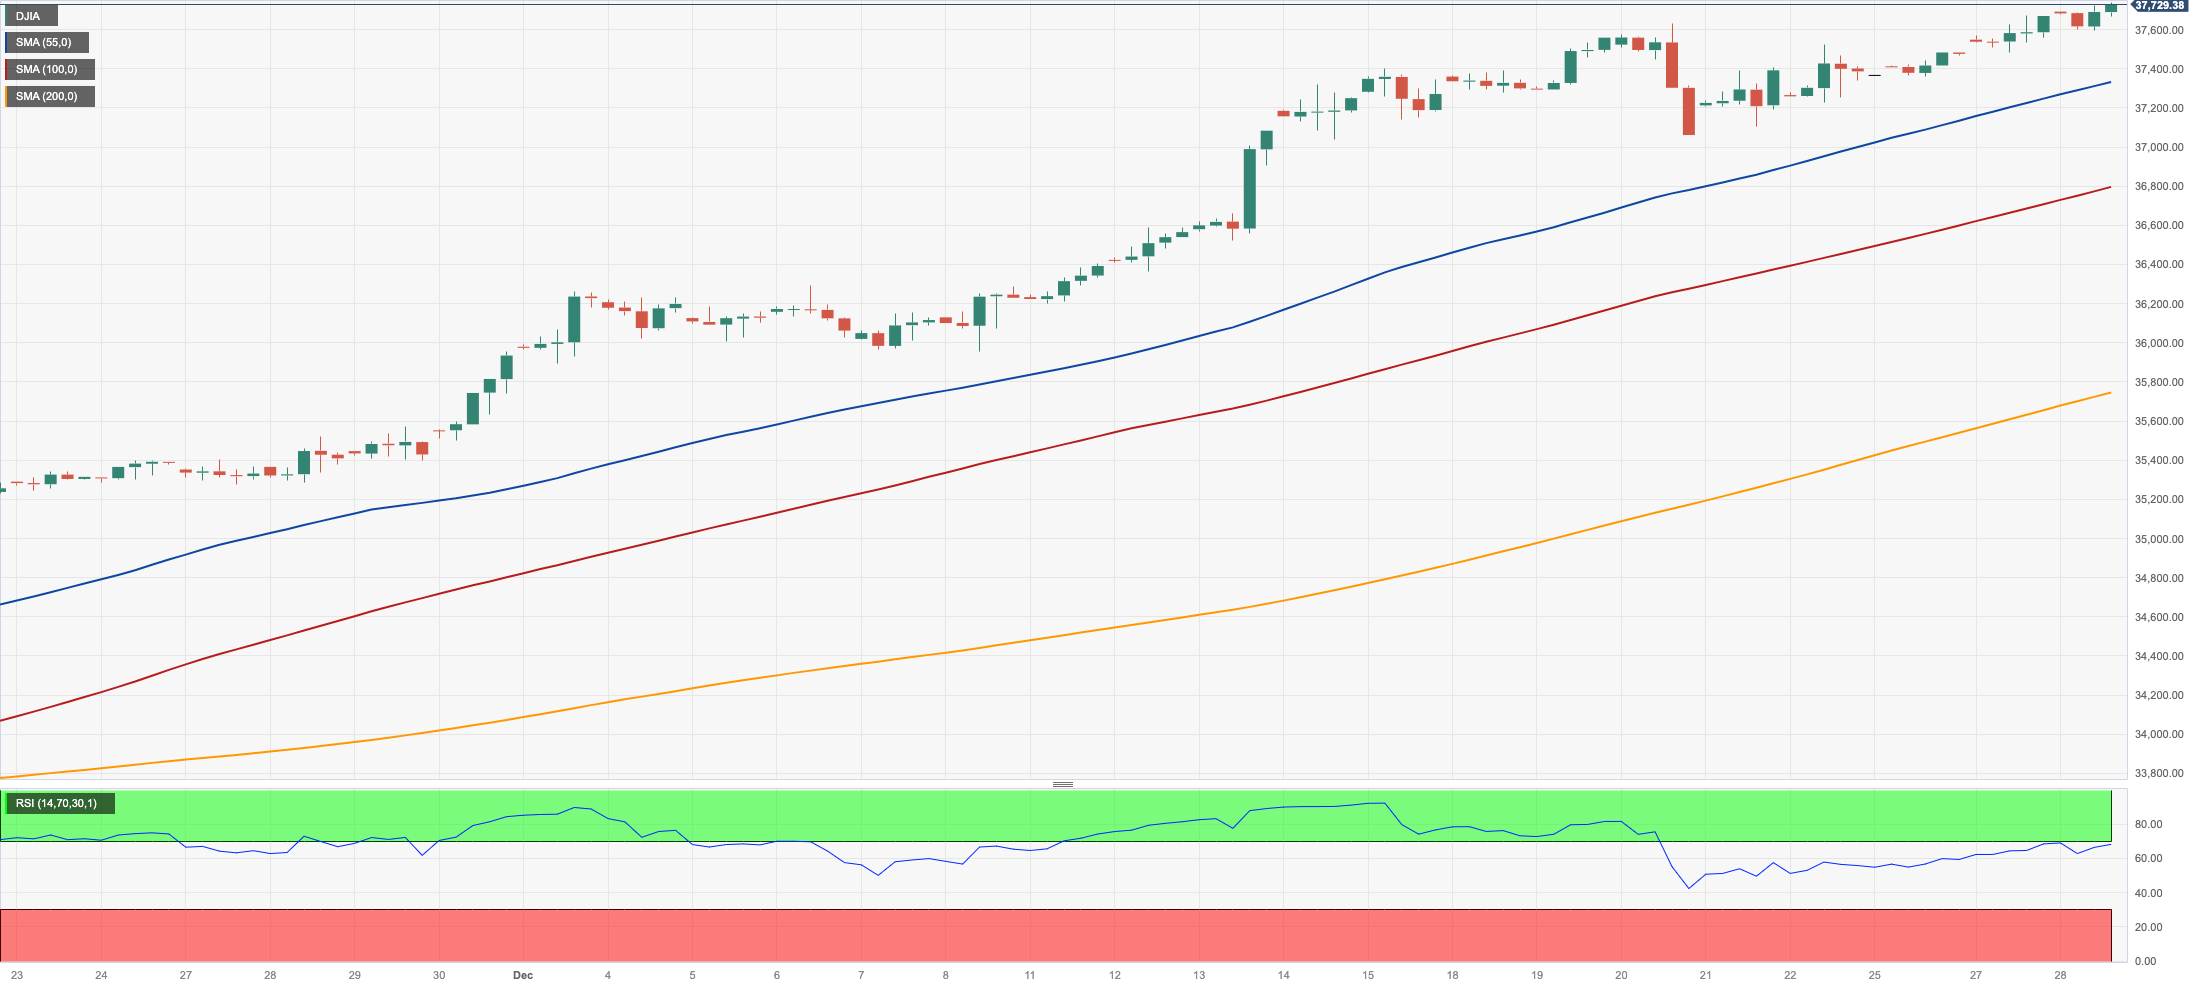
Another day, another record high in US stocks, as the benchmark Dow Jones rose to the 37750 region on Thursday amidst the continuation of the so-called "Santa Claus rally.
Furthermore, the Dow remained well on track to close its ninth consecutive week of gains and the second straight month in positive territory, all in all advancing more than 13% so far this year.
In the meantime, the upbeat mood among investors remained well underpinned by the firm conviction of interest rate cuts by the Fed as soon as at some point in the spring of 2024, all against the backdrop of the growing perception of a "soft landing" of the US economy.
On the whole, the Dow Jones rose 0.22% to 37740, the S&P500 gained 0.16% to 4789, and the tech-focused Nasdaq Composite advanced 0.14% to 15120.
If the bulls maintain control, the Dow's next target is the all-time high of 37752 (December 28). In the opposite direction, there is immediate support at the weekly low of 37073 (December 20), which is prior to the December low of 36010 (December 5), as well as the important 200-day SMA at 34269. The weekly low of 33859 (November 7) comes prior to the October low of 32327 (October 27) and the 2023 low of 31429 (March 15). The latter's drop reveals the 2022 low of 28660 (October 13). The daily RSI was still over 77, suggesting that the market remained overbought.
Top Performers: Nike, UnitedHealth, Goldman Sachs
Worst Performers: Boeing, Dow, Chevron
Resistance levels: 37752 (4H chart)
Support levels: 37073 36021 34740 (4H chart)
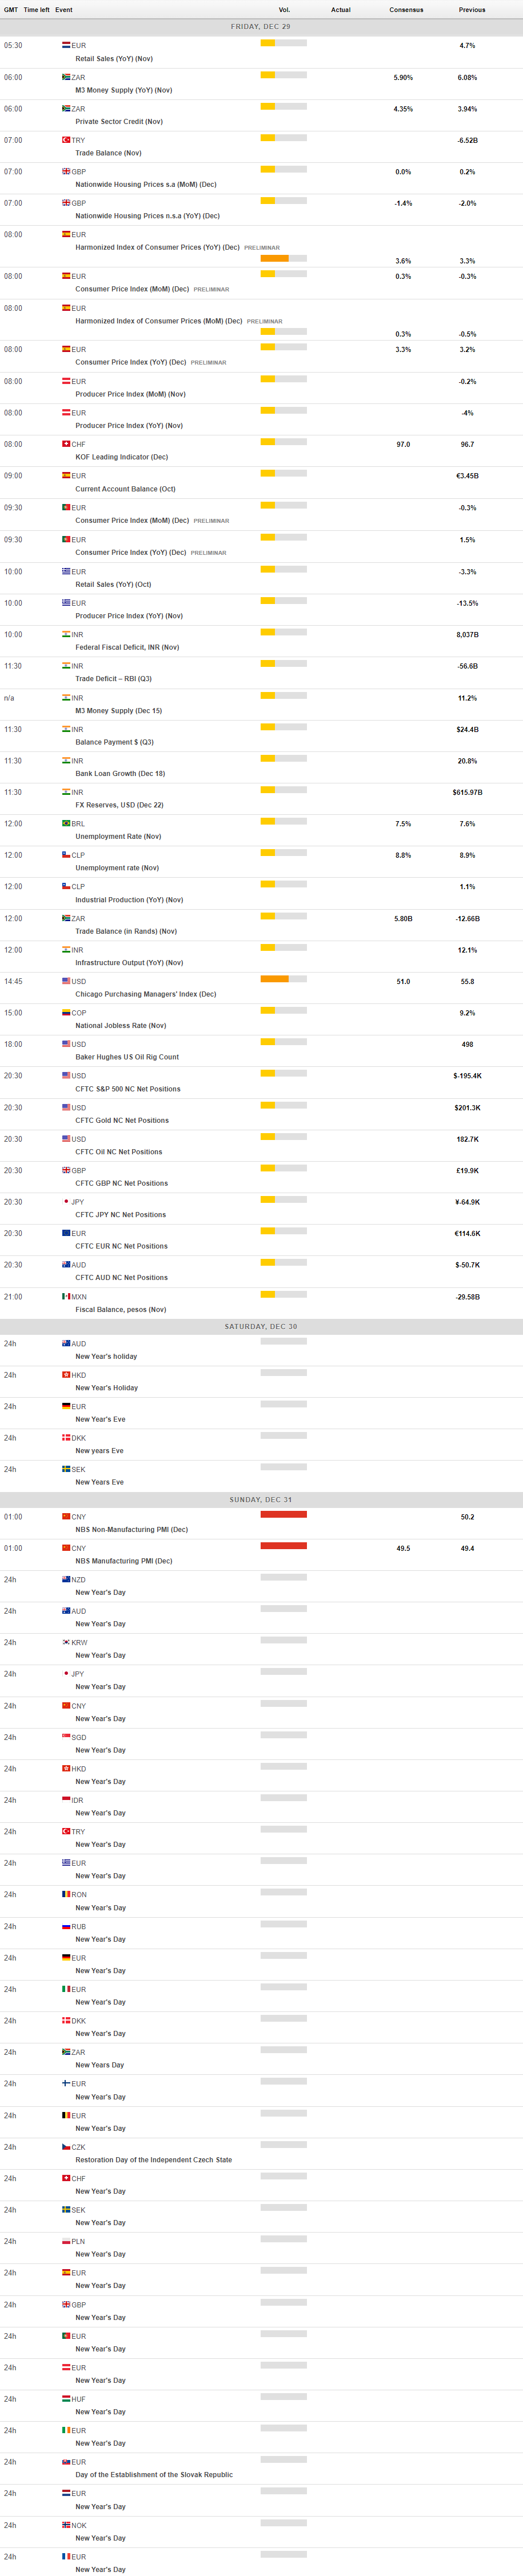
MACROECONOMIC EVENTS
All Information & Updates provided by:

All information relating to the financial markets available on this page has been prepared and issued by FXStreet (Forexstreet SL, Spain, Reg: B62498233) on the basis of publicly available information and all information believed to be reliable and does not conflict with Kuwaiti local laws, and all necessary care has been taken to before the company to ensure that the facts mentioned are correct from the source.
NCM Investment nor any of its directors or employees shall in any way be held responsible for the contents of this news, and the information contained on this page is intended only to provide clients with publicly available information and should not be construed as investment advice, report or analysis and/or constitute an offer or invitation to buy or sell financial instruments of any kind.
RISK WARNING: Forex and CFDs are highly risky leveraged products, as losses can exceed deposits. Please ensure you understand all the risks and take independent advice if necessary. NCM will segregate the clients based on the criteria of the regulator and its bylaws. NCM does not provide any advisory service; the material published does not constitute advice or a recommendation for a transaction in any financial instrument. NCM accepts no responsibility for any use of the content presented and any consequences of that use. Anyone acting on the information provided does so at their own risk.