
- Contact Us:
-

-

-

-


Daily Market Updates
03 Jan 2024
USDJPY
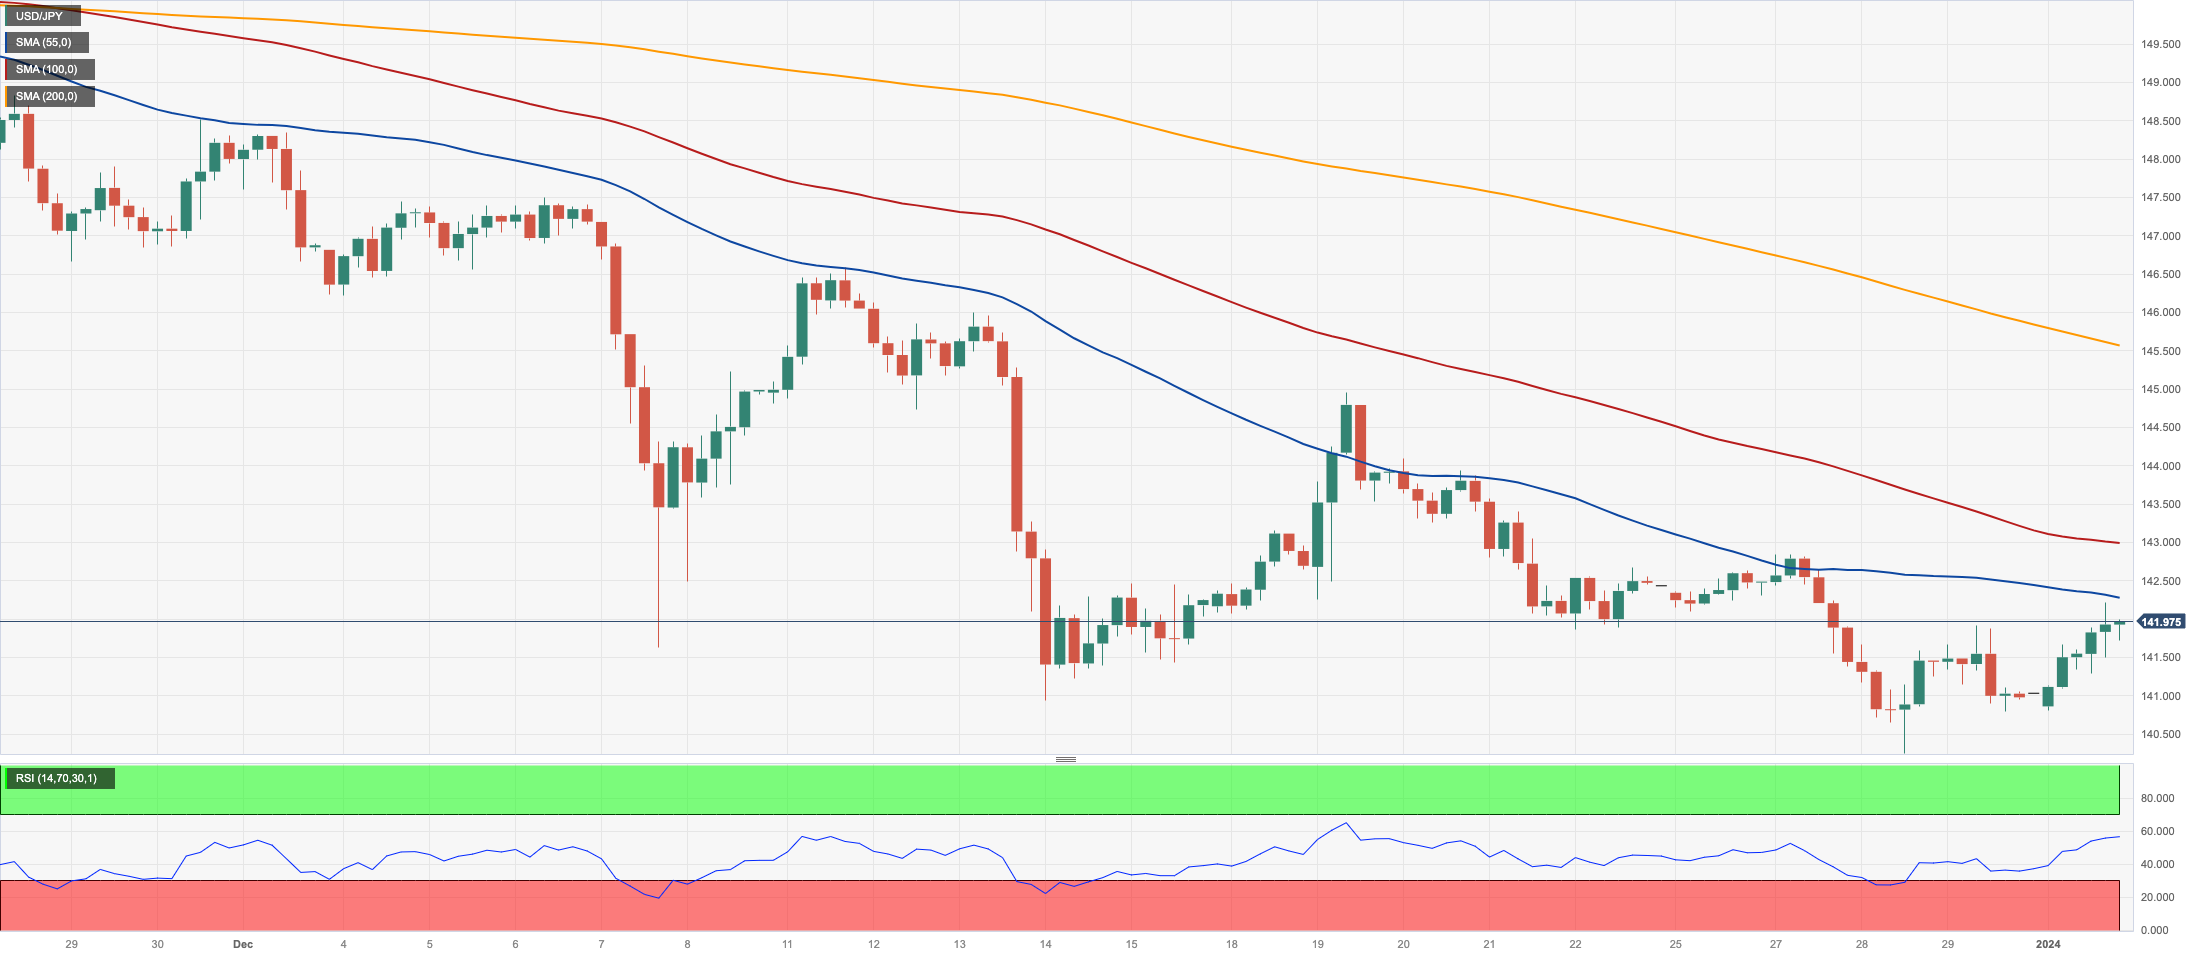
On Tuesday, USD/JPY recorded its first positive session after three consecutive daily declines, regaining the area beyond the 142.00 barrier and settling around that zone towards the end of the NA session as the new trading year kicked off.
The uptick in spot came pari passu with another significant rebound in the dollar, while US yields experienced a robust bounce vs. a marginal move in JGB 10-year yields.
There were no new data releases in Japan on turnaround Tuesday.
If selling pressure continues, USD/JPY may go back to its December 2023 low of 140.24 (December 28). If this zone fails, the market may attempt to break through the round level of 140.00 before the July 2023 low of 137.23 (July 14). The next objective down from here might be the March 2023 low of 129.63 (March 24). On the upside, the 200-day SMA of 143.05 comes first, followed by the transitory 55-day SMA of 147.38 and the 2023 high of 151.90 (November 13). North from here, the round number of 152.00 is aligned, prior to the 2022 top of 151.94 (October 21). The RSI leapt past the 38 level.
Resistance levels: 142.84 144.95 146.58 (4H chart)
Support levels: 140.24 138.05 137.23 (4H chart)
GBPUSD
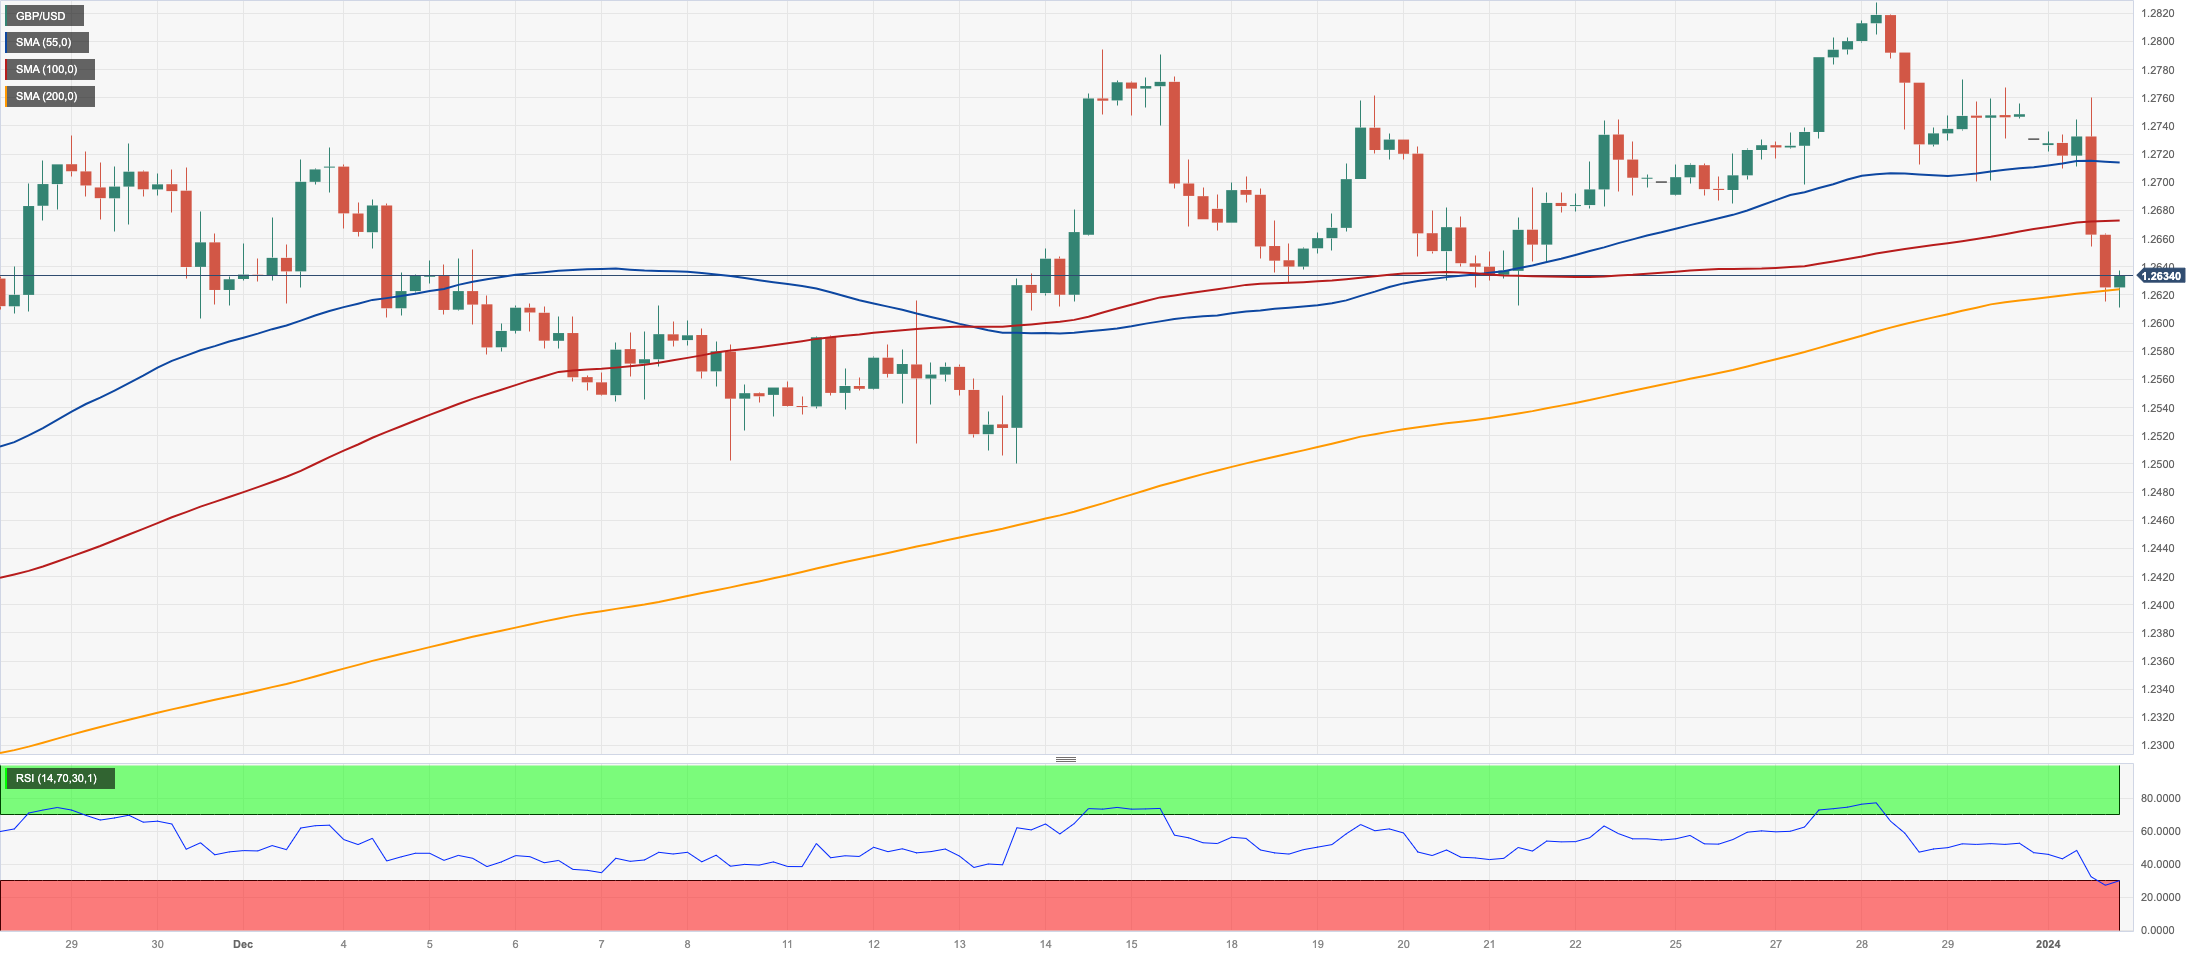
Additional buying interest in the greenback triggered another bout of weakness in risk-linked markets at the beginning of the year, causing GBP/USD to fall to its lowest point in several days near the 1.2610 zone on Tuesday.
The downward movement in Cable came in response to the equally marked retracement in its risky peers and extra rise in UK 10-year gilts, reaching highs not seen in several sessions around 3.70%.
In the UK docket, the final Manufacturing PMI eased a tad to 46.2 for the last month of 2023.
Further losses could see GBP/USD revisit the 200-day SMA at 1.2527 before the December 2023 low of 1.2500 (December 13) and the intermediate 55-day SMA at 1.2458. The loss of the latter exposes the weekly low of 1.2187 (November 10 2023), which precedes the October 2023 low of 1.2037 (October 3), the key 1.2000 level, and the 2023 bottom of 1.1802 (March 8). On the upside, initial resistance emerges at the December 2023 top of 1.2827 (December 28), followed by the weekly peak of 1.2995 (July 27 2023), which is just over the crucial 1.3000 mark. The daily RSI grinded lower to the 50 threshold.
Resistance levels: 1.2827 1.2888 1.2995 (4H chart)
Support levels: 1.2610 1.2500 1.2373 (4H chart)
AUDUSD
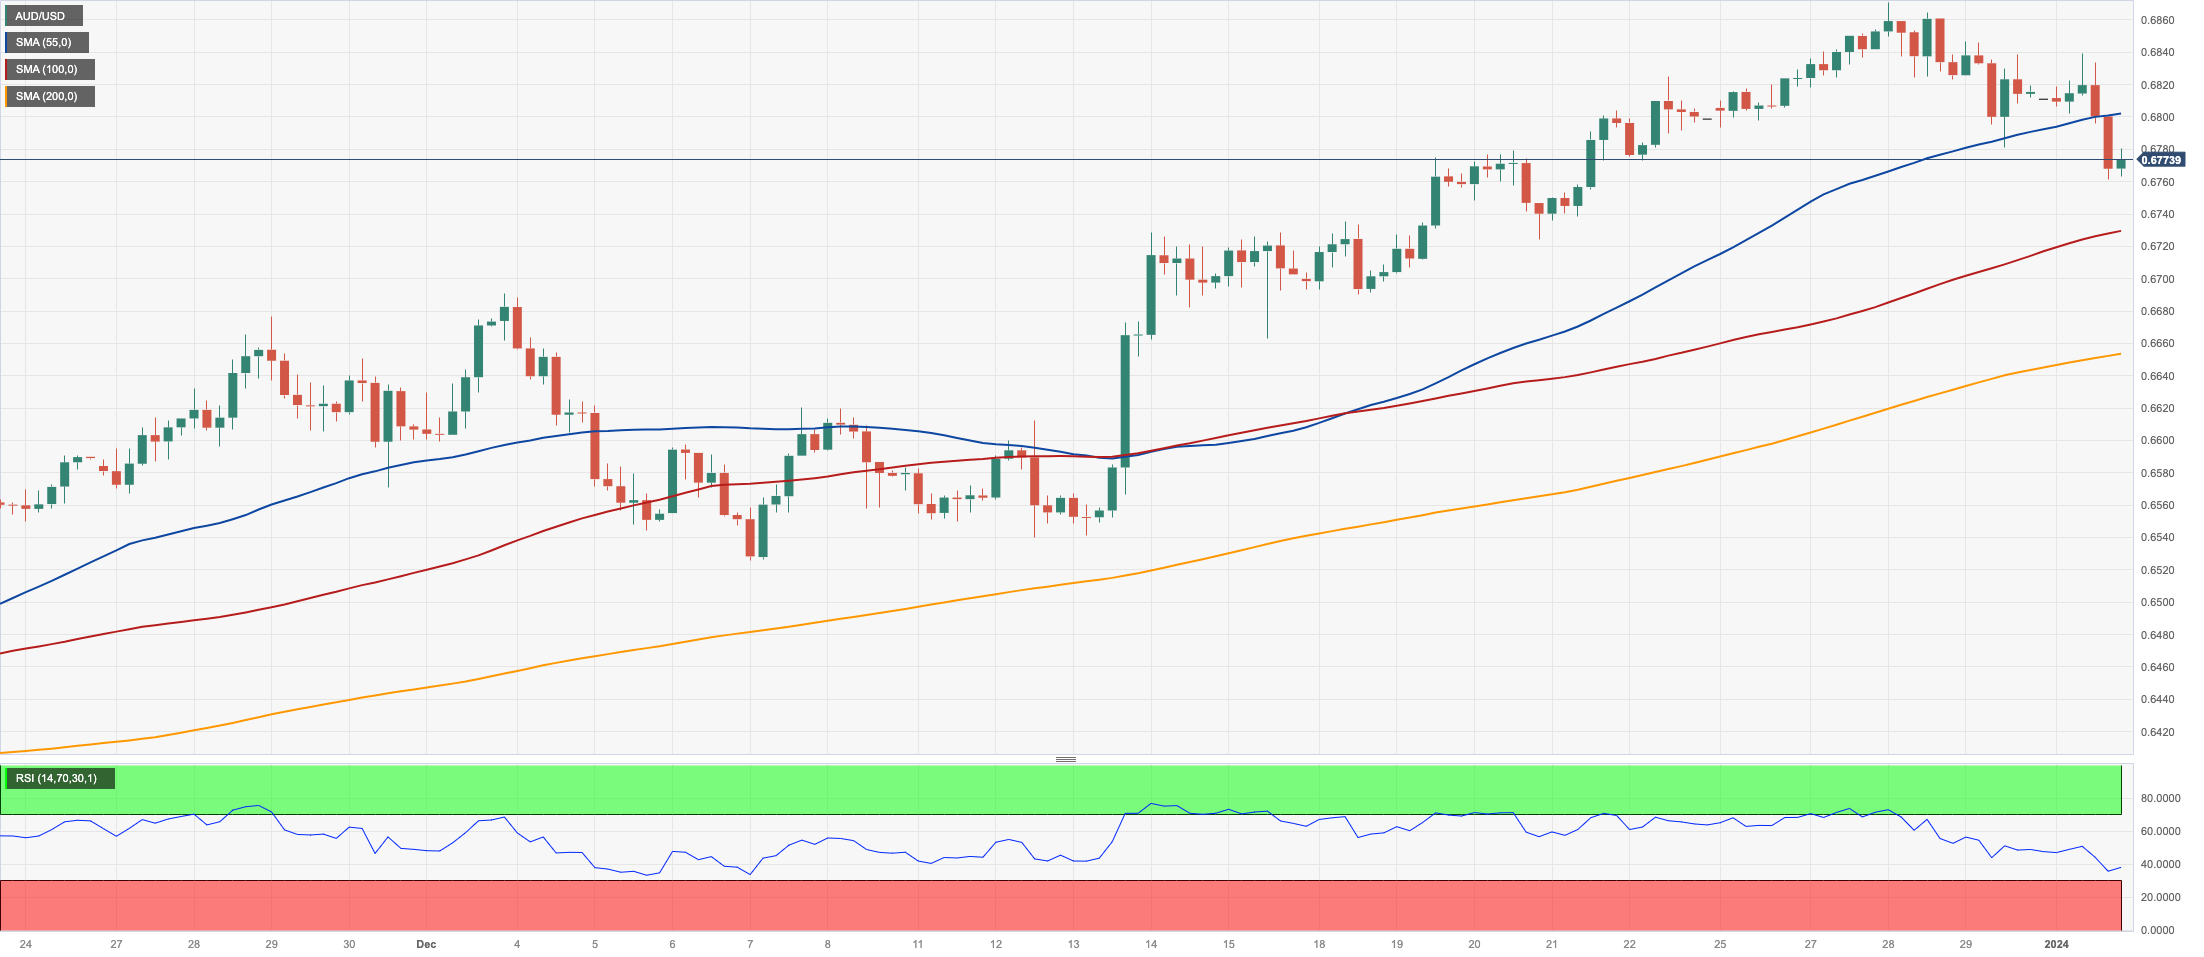
Aligned with the broader risk-associated market trends, the Aussie dollar extended the pessimism seen at the end of the last year and kicked off the 2024 with marked losses, motivating AUD/USD to revisit the 0.6770 zone.
The pair's consecutive decline over three days was a response to the greenback gaining further ground and the overall negative movements in commodity markets.
Of note, however, is that the pair has practically ignored another resilient performance of iron ore prices, hovering over the key $140.00 region per tonne, an area last visited in June 2022.
In Australia, final Judo Bank Manufacturing PMI turned up at 47.6 for the month of December.
The breakout of the December 2023 peak of 0.6871 (December 28) may pave the way for a trip to the July 2023 high of 0.6894 (July 14) and the June 2023 top of 0.6899 (June 16), both of which are located just before the important 0.7000 yardstick. AUD/USD, on the other hand, is projected to find immediate support near the 200-day SMA of 0.6582, before falling to the December 2023 low of 0.6525 (December 7). Further south, the 2023 low of 0.6270 (October 26) looks to be ahead of the 0.6200 round level, with the latter's decline exposing the 2022 low of 0.6169 (October 13). The daily RSI dropped to about 60.
Resistance levels: 0.6871 0.6894 0.7029 (4H chart)
Support levels: 0.6775 0.6723 0.6663 (4H chart)
GOLD
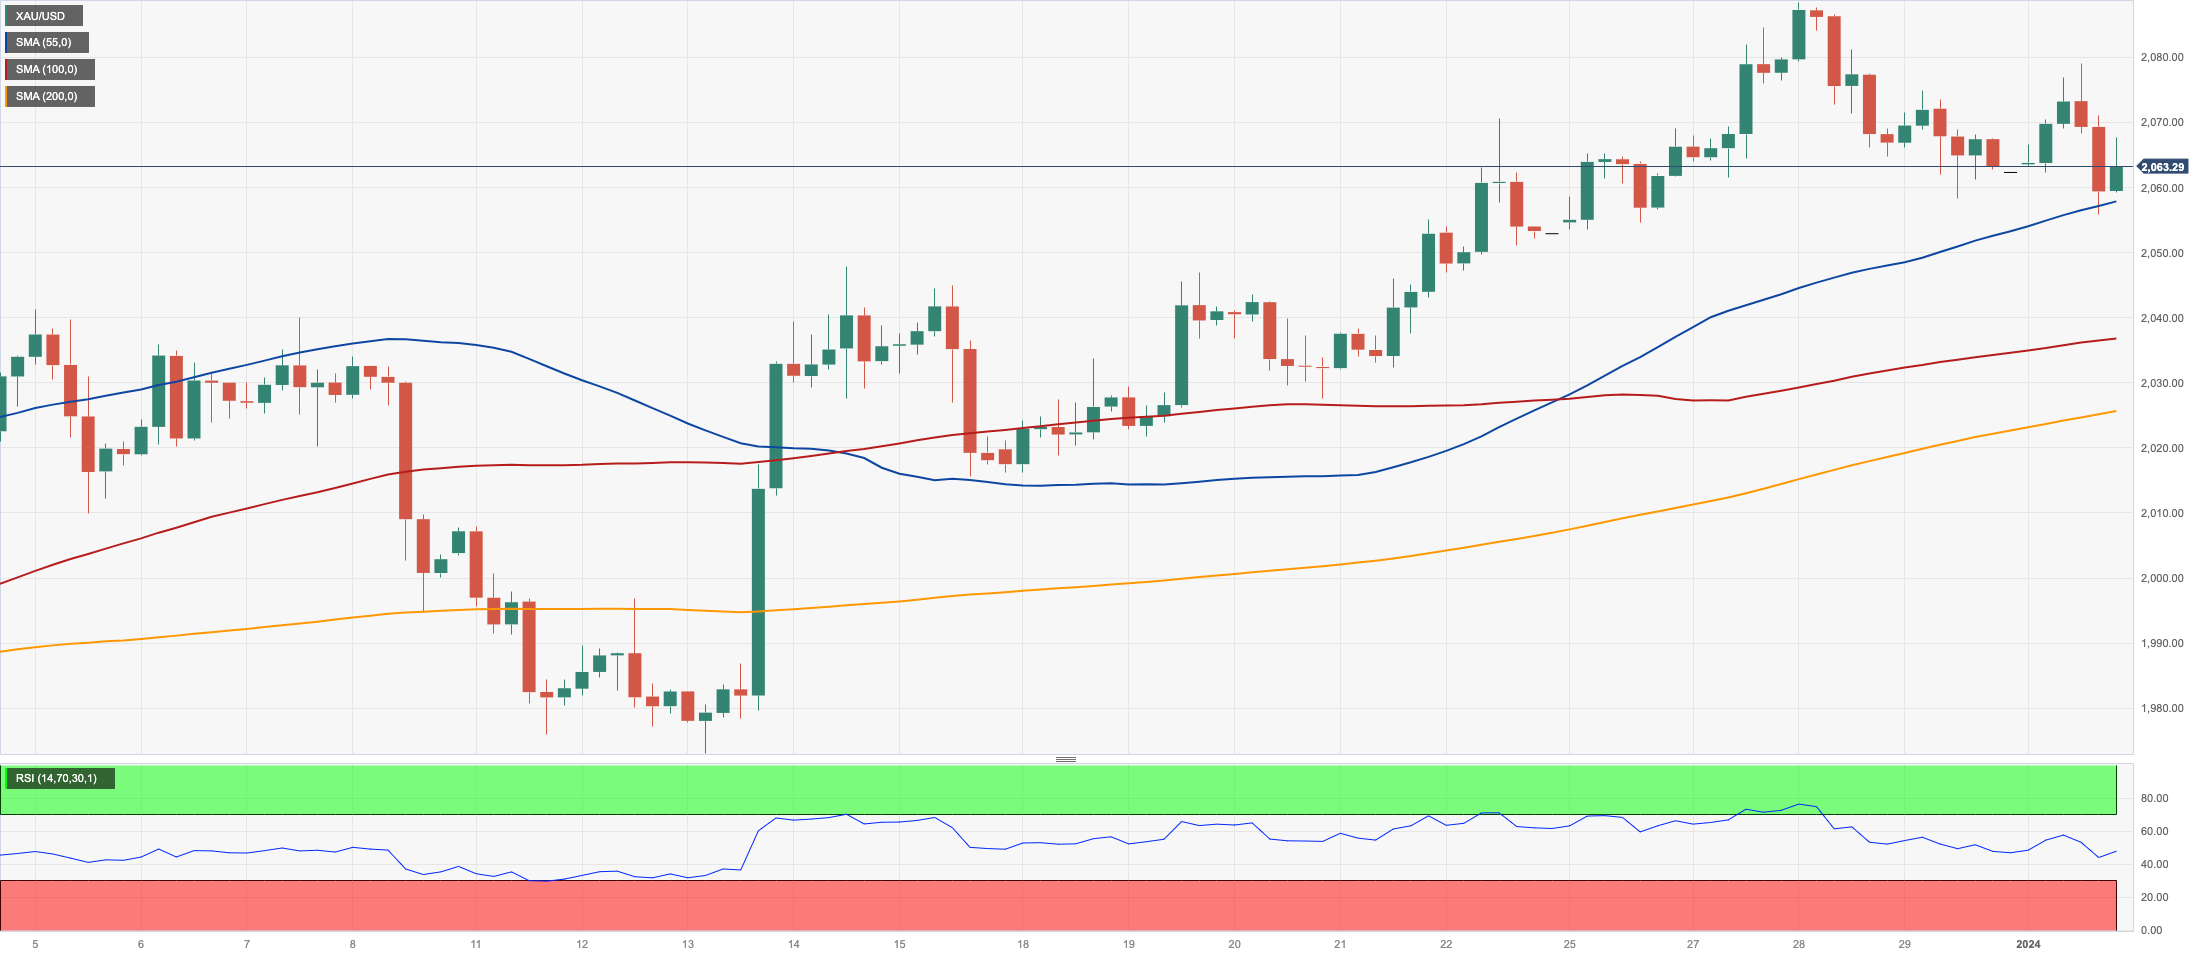
Gold prices appear to have by-passed the robust sentiment surrounding the US dollar at the beginning of the new trading year.
Indeed, the precious metal experienced an inconclusive session uptick and settled around the $2060 region, amidst the solid rebound in US yields across the curve and another positive day for the buck.
Moving forward, price action around the yellow metal is expected to follow the dynamics around the federal Reserve and its plans to start reducing its interest rates as soon as in Q2.
If gold prices continue to rise, the December 2023 peak of $2088 (December 28) will be the next level of resistance, seconded by the all-time high of $2150 (December 4 2023). In the other way, the current discussion is concentrated on the $2000 mark. If this area is cleared, the metal might fall to the December 2023 low of $1973 (December 13), which is above the 200-day SMA of $1960 and the November 2023 low of $1931 (November 13). South of here, the October 2023 low of $1810 (October 6), the 2023 low of $1804 (February 28), and, lastly, the crucial $1800 contention zone are seen.
Resistance levels: $2088 $2149 (4H chart)
Support levels: $2058 $2022 $2015 (4H chart)
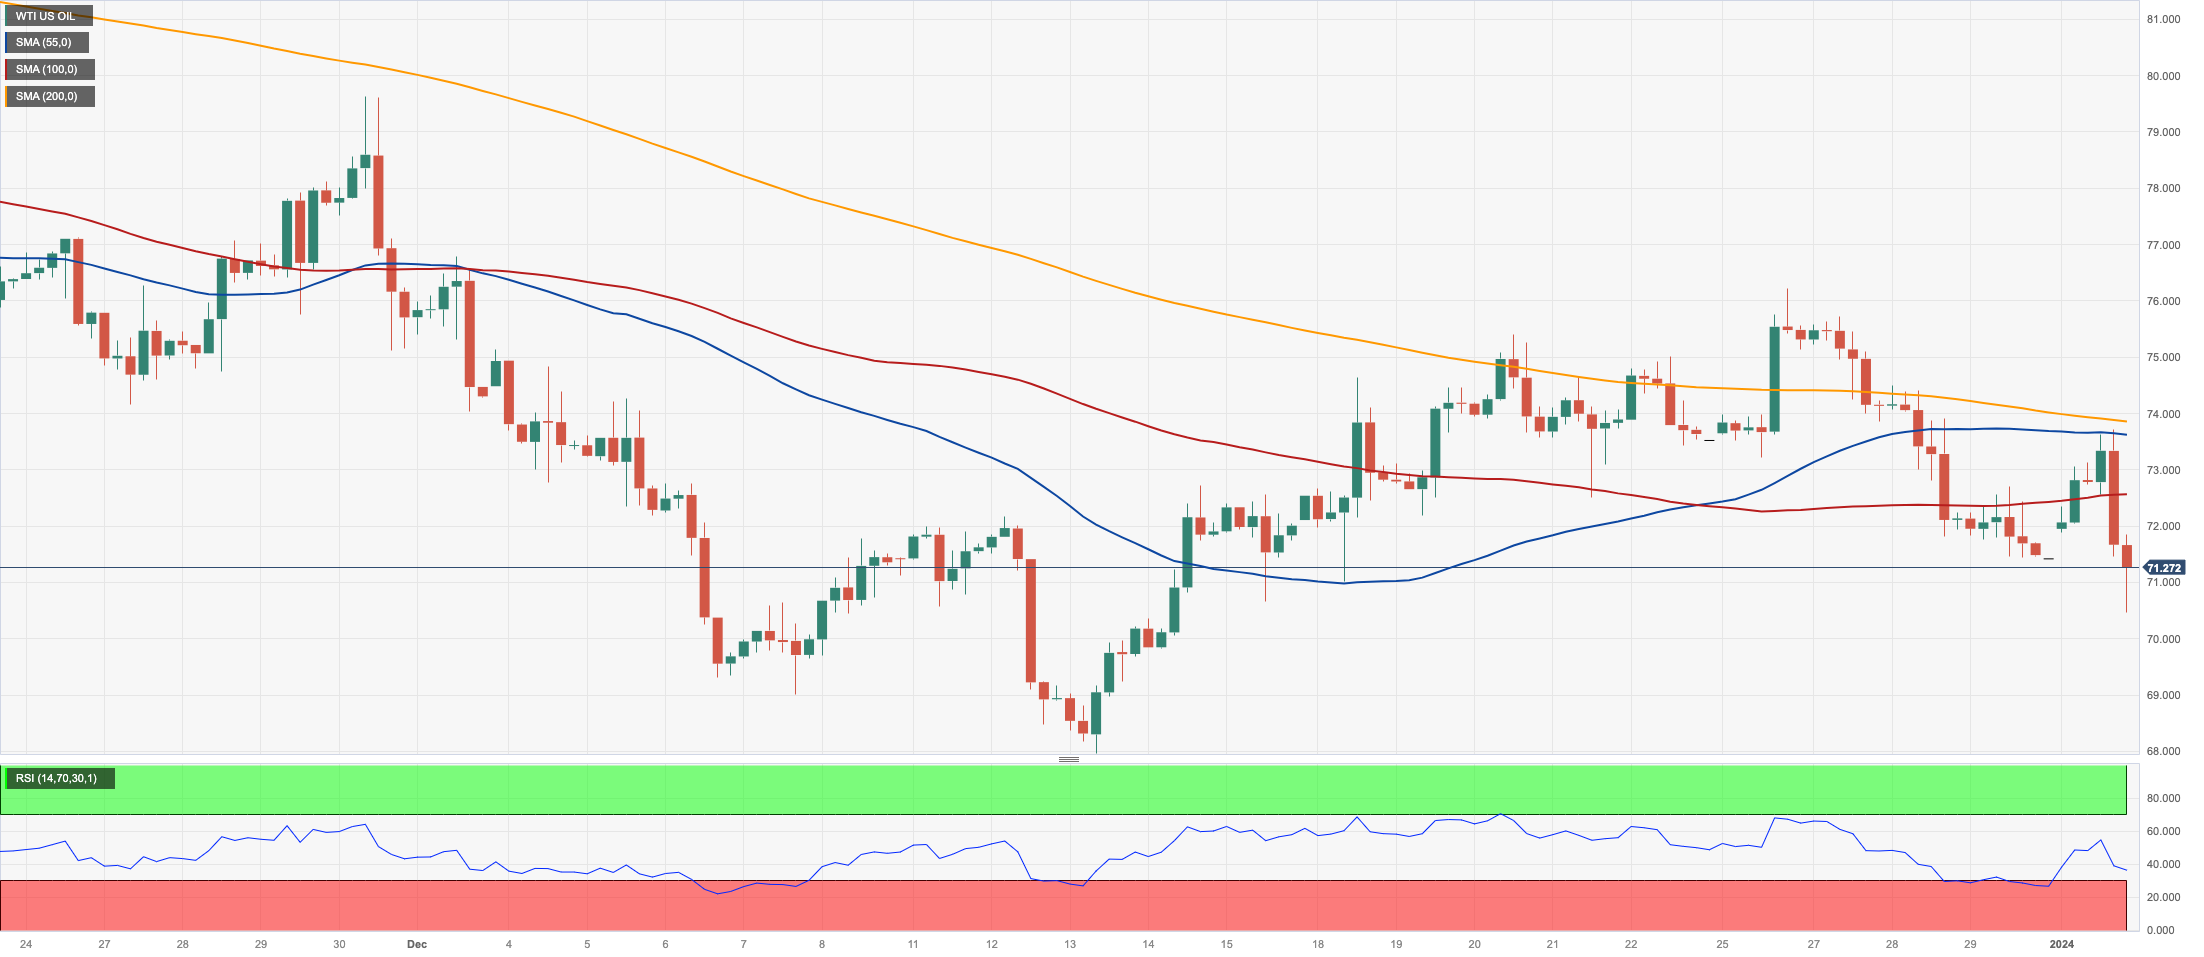
CRUDE WTI
Prices of the American reference for the sweet light crude oil started the 2024 in a negative fashion and quickly faded the initial move past the $73.00 mark per barrel on Tuesday.
The continuation of the downside bias in the commodity came in response to the resurgence of demand concerns, which offset exacerbated geopolitical concerns in the Red Sea, all after Iran sent a warship to the area in response to US attacks to Houthi rebels.
Also limiting the upside in WTI emerged the lower-than-expected prints from the Chinese manufacturing sector measured by the official NBS, which maintained the gloomy outlook over the recovery of that country.
The weekly top of $76.14 (December 26 2023) is next on the upside for WTI, followed by the critical 200-day SMA at $77.85, the vital $80.00 barrier, and the November 2023 peak of $80.15 (November 3). Further advances from here may send the market back to its weekly high of $89.83 (October 18 2023), before the 2023 top of $94.99 (September 28 2023) and the August 2022 high of $97.65 (August 30), all before the crucial $100.00 level. Instead, a break below the December 2023 low of $67.74 (December 13) might lead to a drop to the 2023 low of $63.61 (May 4) before reaching the important $60.00 support.
Resistance levels: $73.95 $76.14 $79.56 (4H chart)
Support levels: $71.20 $70.28 $67.68 (4H chart)
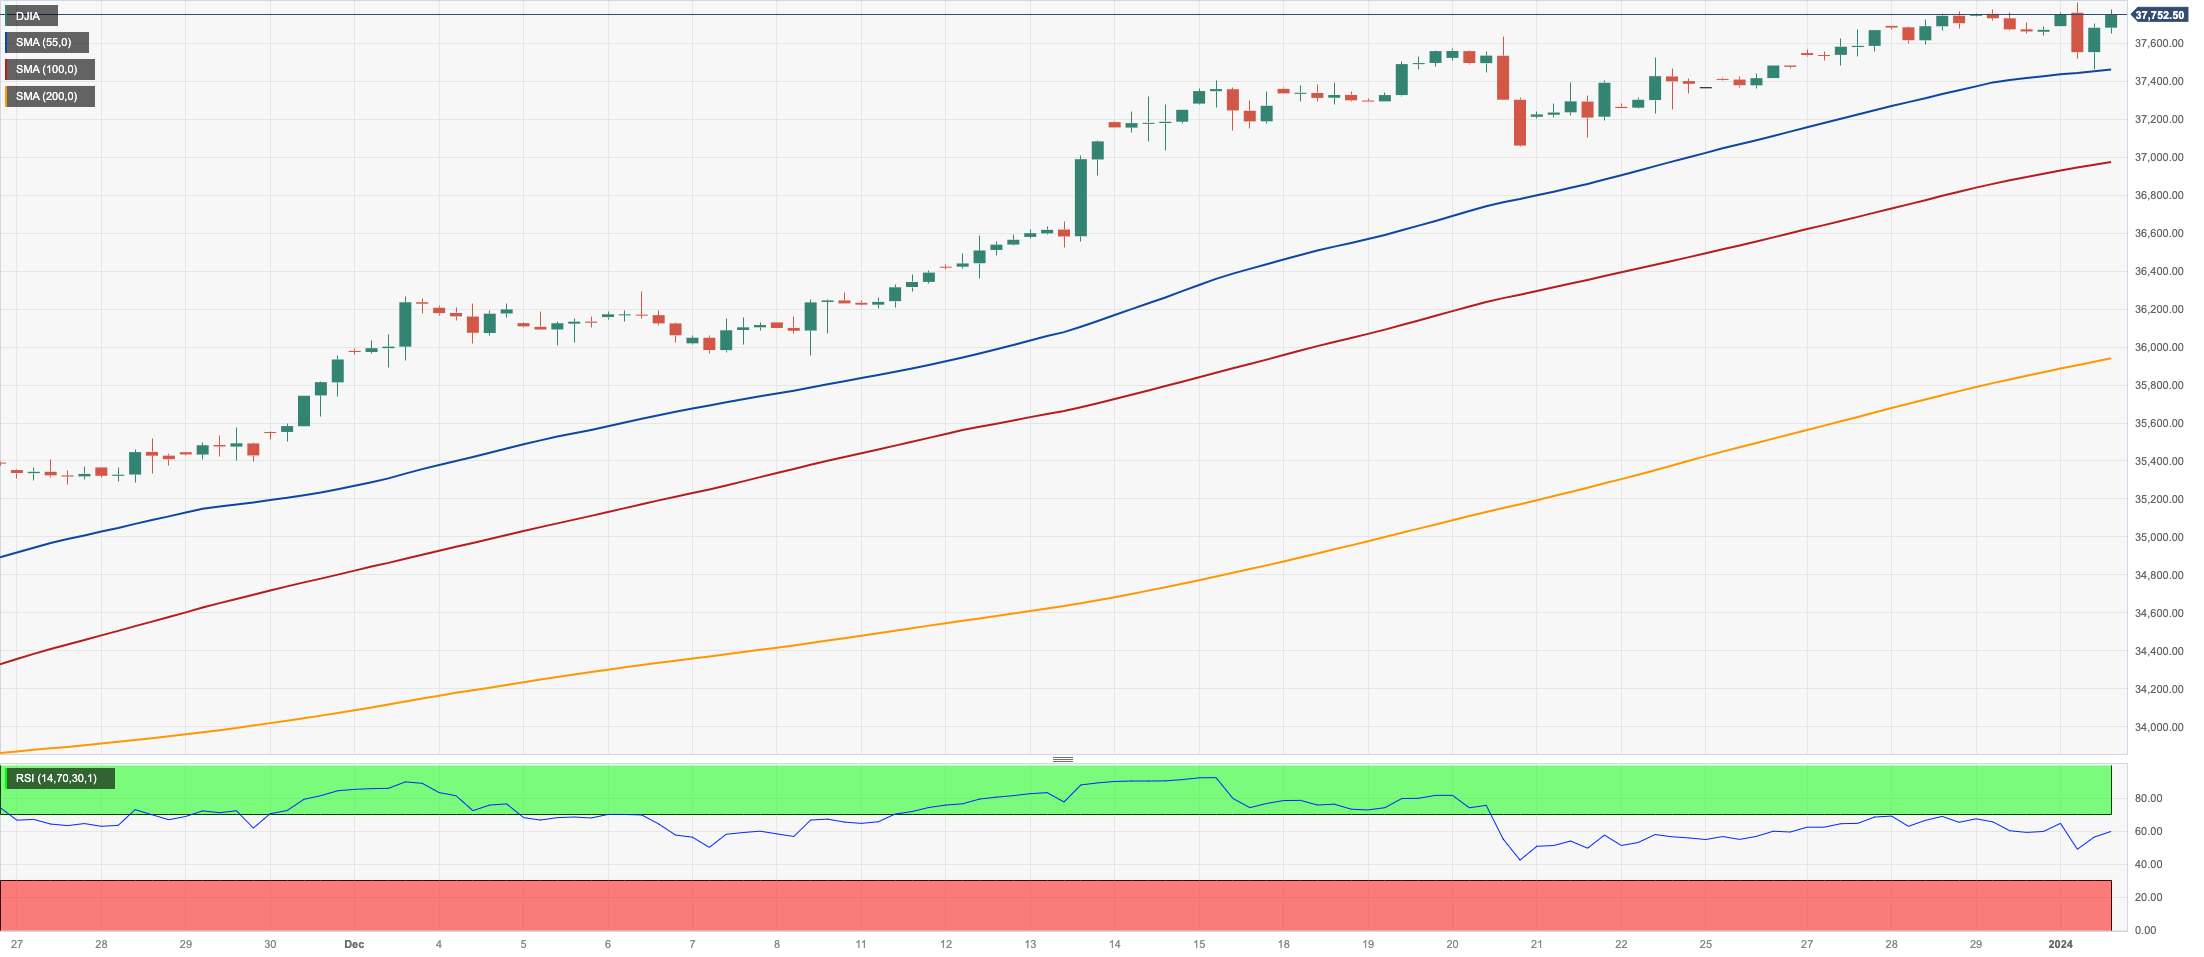
DOW JONES
US equities reversed their corrective move seen in the last trading session of 2023 and advanced to a new all-time top just below the 38000 yardstick when gauged by the Dow Jones on Tuesday.
That said, the index so far entered its tenth consecutive week of gains, all after the 13% gain recorded during last year.
Meanwhile, investors maintain an optimistic outlook, buoyed by their strong confidence in future interest rate cuts by the Fed, which are expected to take place at some point in the spring. This positive sentiment is also driven by the economy's unwavering resilience, persistent disinflationary pressures, and growing belief in a "soft landing."
Overall, the Dow Jones gained 0.16% to 37749, the S&P500 dropped 0.58% to 4742, and the tech-focused Nasdaq Composite deflated 1.64% to 14765.
If the bulls maintain control, the Dow's next target is the all-time high of 37790 (January 2). Immediate support may be located in the opposite direction at the weekly low of 37073 (December 20 2023), which is prior to the December 2023 low of 36010 (December 5), as well as the key 200-day SMA at 34326. The weekly low of 33859 (November 7 2023) aligns before the October 2023 low of 32327 (October 27) and the 2023 low of 31429 (March 15). A breakdown of the latter might put a test of the 2022 low of 28660 (October 13) on the table. The daily RSI remained over 77, indicating that the market remained well overbought.
Top Performers: Amgen, Merck&Co, Verizon
Worst Performers: Intel, Apple, Boeing
Resistance levels: 37778 (4H chart)
Support levels: 37073 36021 34774 (4H chart)
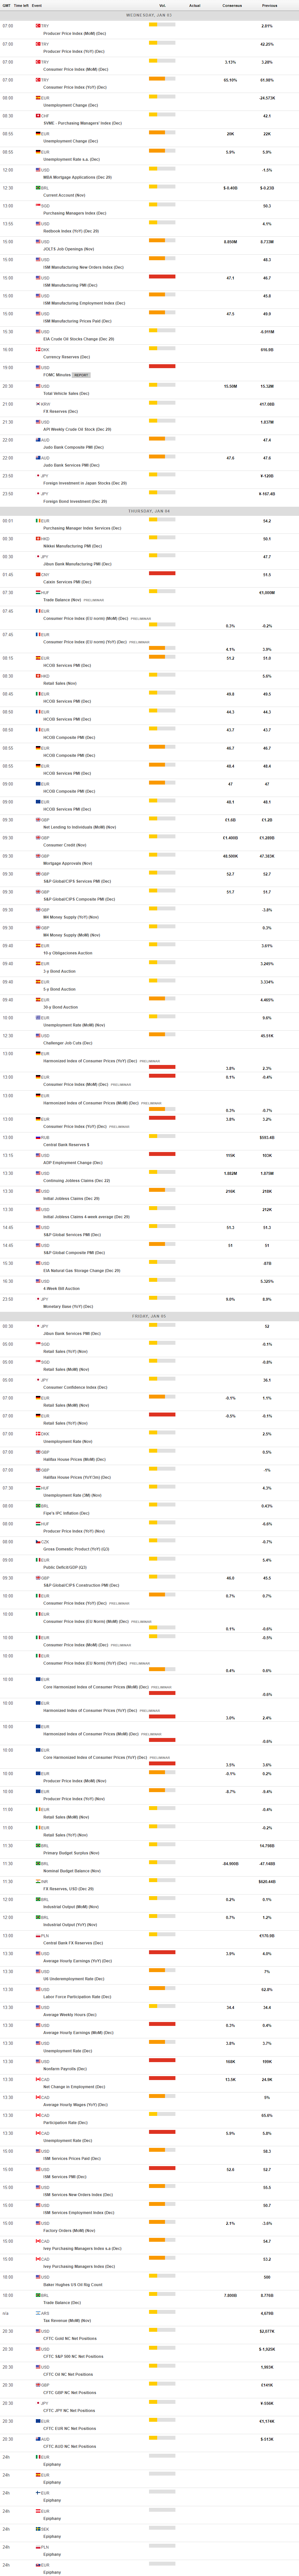
MACROECONOMIC EVENTS
All Information & Updates provided by:

All information relating to the financial markets available on this page has been prepared and issued by FXStreet (Forexstreet SL, Spain, Reg: B62498233) on the basis of publicly available information and all information believed to be reliable and does not conflict with Kuwaiti local laws, and all necessary care has been taken to before the company to ensure that the facts mentioned are correct from the source.
NCM Investment nor any of its directors or employees shall in any way be held responsible for the contents of this news, and the information contained on this page is intended only to provide clients with publicly available information and should not be construed as investment advice, report or analysis and/or constitute an offer or invitation to buy or sell financial instruments of any kind.
RISK WARNING: Forex and CFDs are highly risky leveraged products, as losses can exceed deposits. Please ensure you understand all the risks and take independent advice if necessary. NCM will segregate the clients based on the criteria of the regulator and its bylaws. NCM does not provide any advisory service; the material published does not constitute advice or a recommendation for a transaction in any financial instrument. NCM accepts no responsibility for any use of the content presented and any consequences of that use. Anyone acting on the information provided does so at their own risk.