
- Contact Us:
-

-

-

-


Daily Market Updates
04 Jan 2024
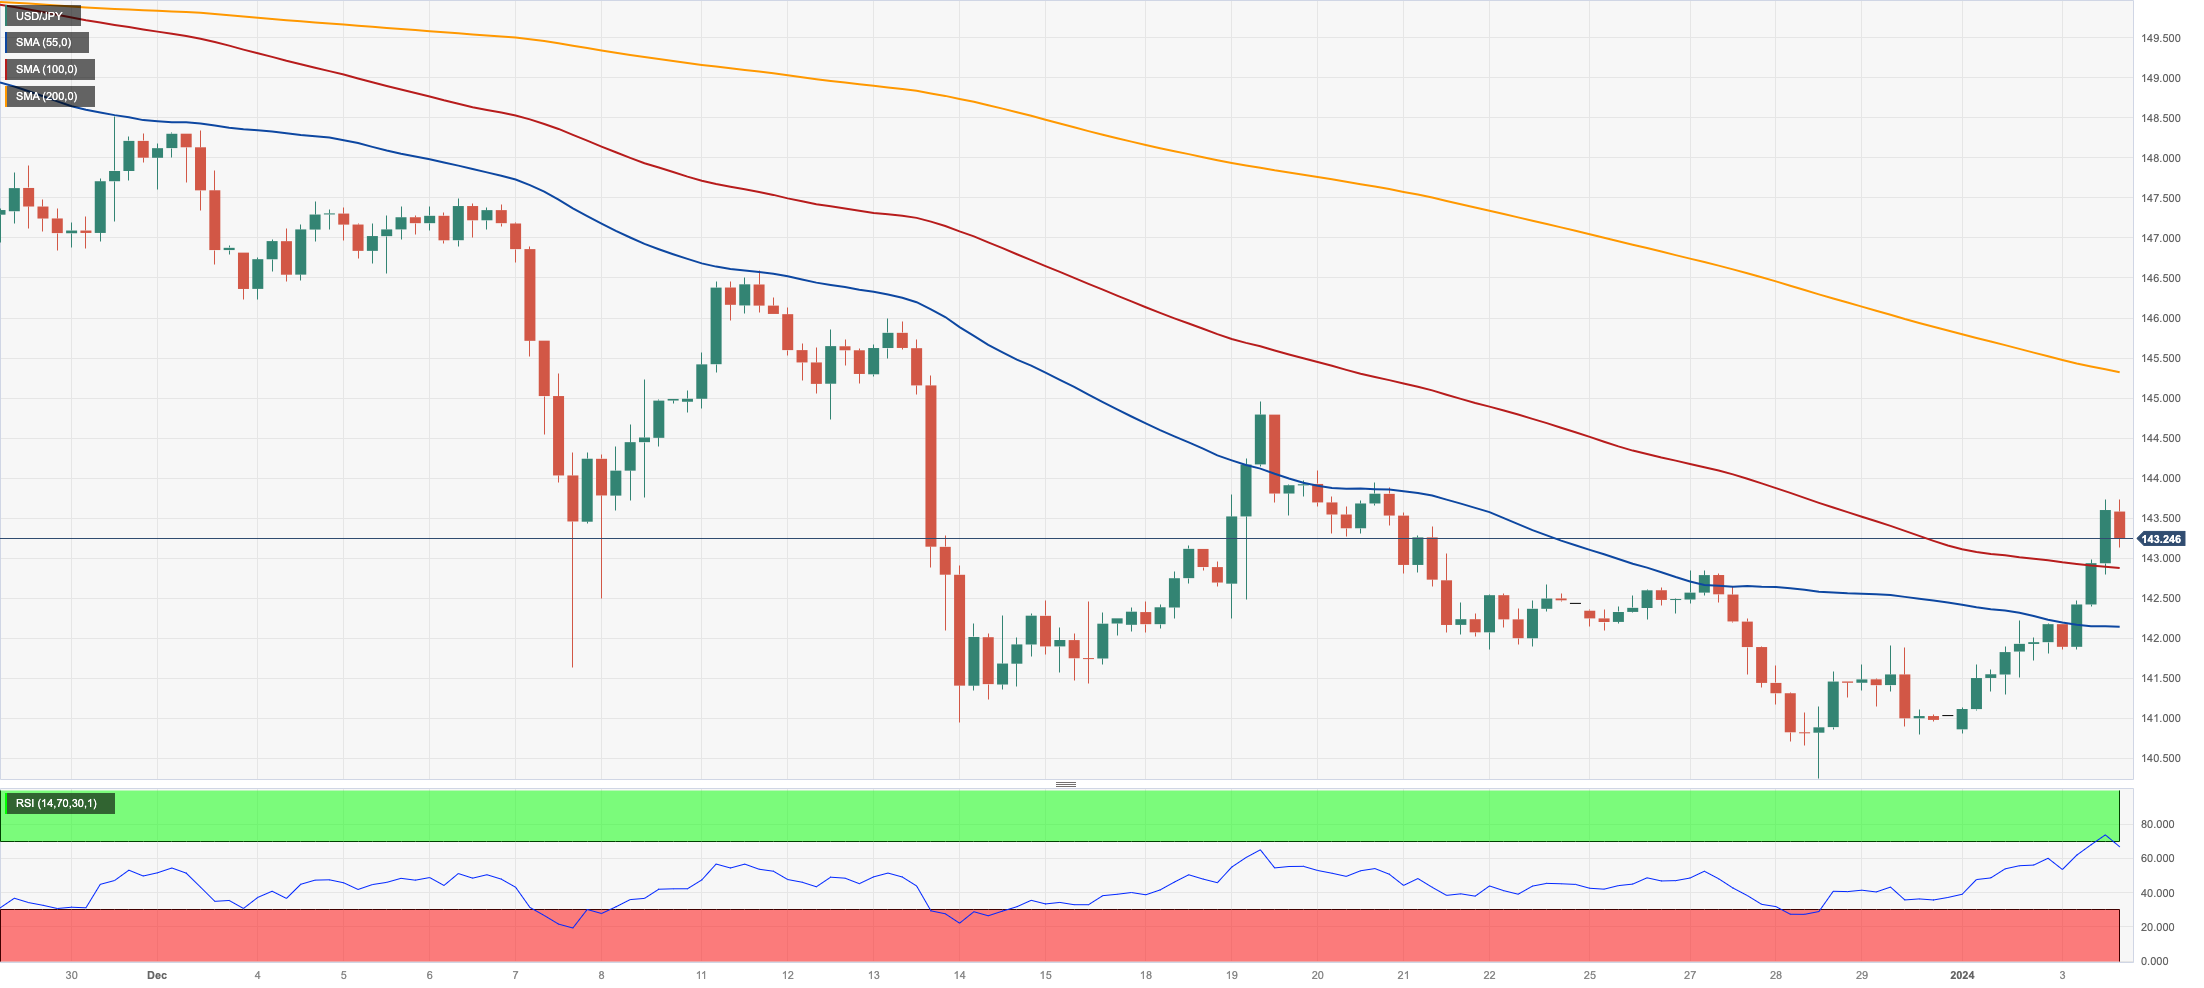
USDJPY
USD/JPY added to the ongoing auspicious start of the new year and surpassed the 14300 barrier to clock a new two-week high near 143.70 on Wednesday.
The pair’s price action came on the back of the strong recovery in the greenback, which propelled the USD Index (DXY) well north of the 102.00 hurdle, and the equally robust bounce in US yields across different maturities, all vs. flattish developments in the JGB 10-year yields.
The Japanese docket was empty on Wednesday.
If buying pressure persists, USD/JPY could retarget the transitory 55-day SMA of 147.27 ahead of the 2023 high of 151.90 (November 13). North from here emerges the 2022 top of 151.94 (October 21) just before the round number of 152.00. On the downside, the breakdown of the December 2023 bottom of 140.24 (December 28) should expose the round level of 140.00 prior to the July 2023 low of 137.23 (July 14). The next target down from here might be the March 2023 bottom of 129.63 (March 24). The day-to-day RSI surpassed the 45 level.
Resistance levels: 143.72 144.95 146.58 (4H chart)
Support levels: 140.24 138.05 137.23 (4H chart)
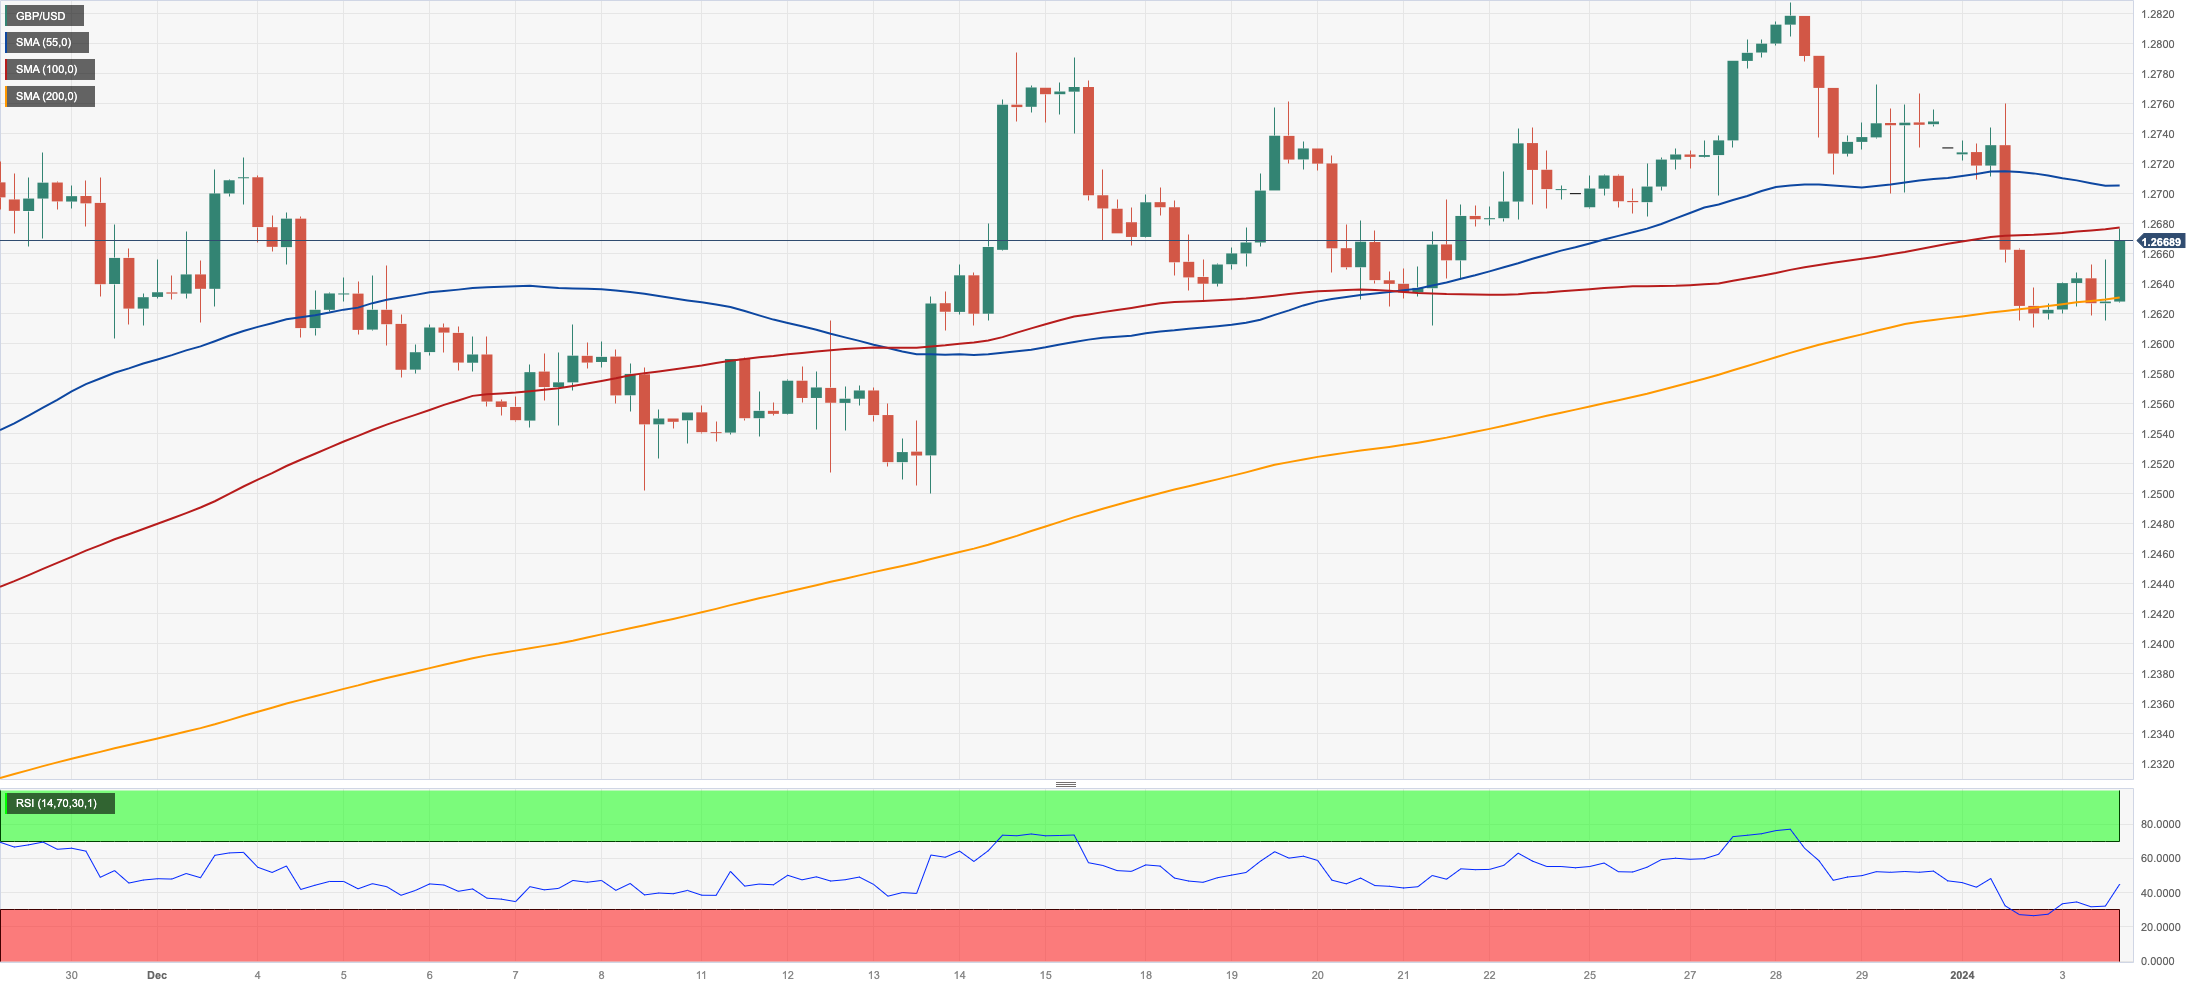
GBPUSD
The upside momentum in the greenback remained well and sound for yet another session on Wednesday.
However, the British pound managed to ignore the buying bias in the buck and encouraged GBP/USD to print decent gains and revisit the upper-1.2600s midweek.
Additionally, the rebound in Cable after three straight sessions of losses came amidst the continuation of the recovery in UK 10-year gilt yields, this time flirting with the 3.70% zone.
There were no data releases scheduled across the Channel on Wednesday.
GBP/USD may revisit the 200-day SMA at 1.2529 before the December 2023 low of 1.2500 (December 13) and the intermediate 55-day SMA at 1.2465 if losses continue. The breakdown of the latter reveals the weekly low of 1.2187 (November 10 2023), which comes before the October 2023 low of 1.2037 (October 3), the critical 1.2000 mark, and the 2023 bottom of 1.1802 (March 8). On the upside, initial resistance appears at the December 2023 high of 1.2827 (December 28), followed by the weekly top of 1.2995 (July 27 2023), which is just over the critical 1.3000 level. The daily RSI rebounded to the vicinity of 53.
Resistance levels: 1.2772 1.2827 1.2888 (4H chart)
Support levels: 1.2610 1.2500 1.2373 (4H chart)
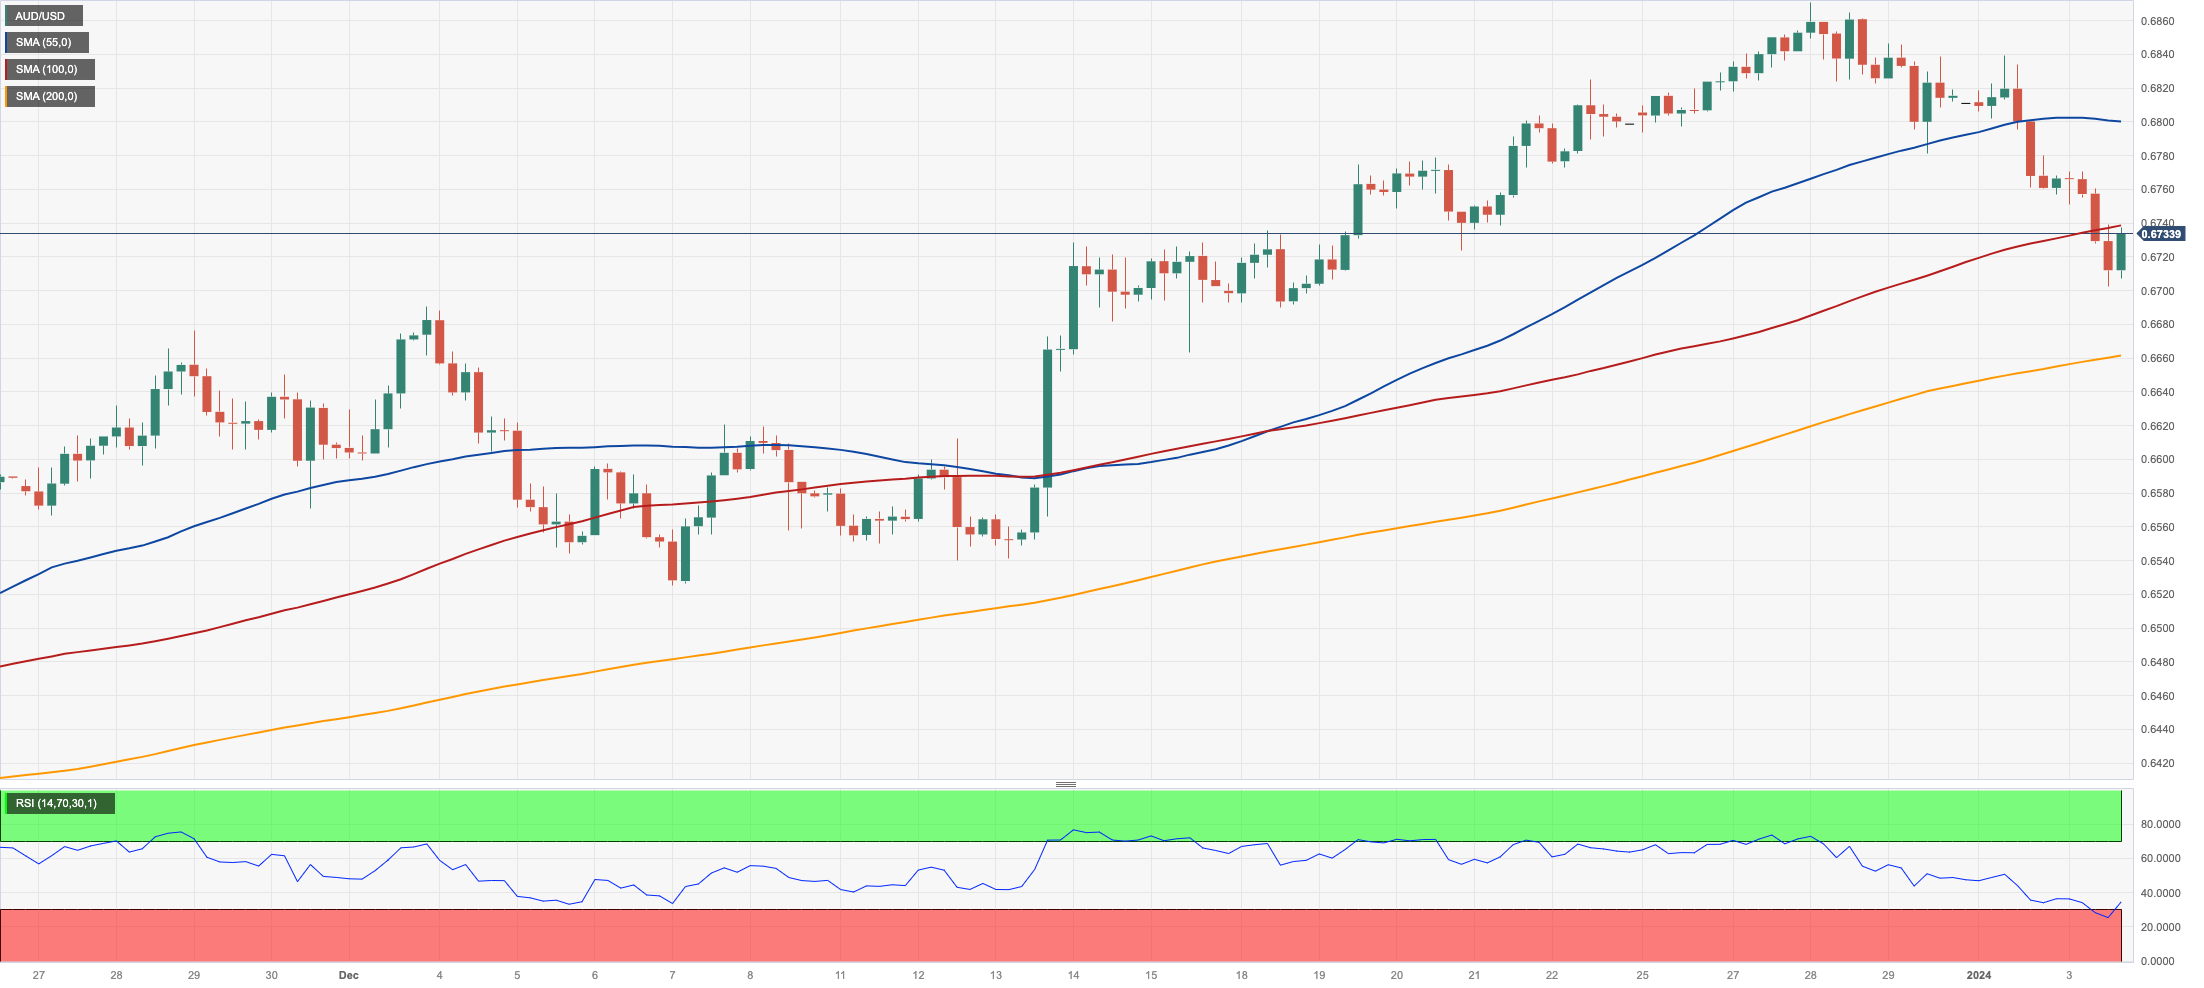
AUDUSD
The Australian dollar continued its downward trend from the latter part of last year, this time dragging AUD/USD to fresh two-week lows near the 0.6700 support on Wednesday.
This four-day consecutive drop in the pair was influenced by the extra strengthening of the greenback and another bearish day in the commodity galaxy, where the rally in iron ore prices seems to have taken a breather midweek.
There were no data releases in Oz on Wednesday.
Immediately to the downside for AUD/USD aligns the 2023 low of 0.6701 (January 3) ahead of the 200-day SMA of 0.6582. The loss of the latter exposes the December 2023 bottom of 0.6525 (December 7) prior to the 2023 low of 0.6270 (October 26) and the round level of 0.6200, all ahead of the 2022 low of 0.6169 (October 13). On the other hand, the trespass of the December 2023 high of 0.6871 (December 28) may open the way for a journey to the July 2023 top of 0.6894 (July 14) and the June 2023 peak of 0.6899 (June 16), both of which are placed just before the critical 0.7000 yardstick. The daily RSI fell to around 54.
Resistance levels: 0.6871 0.6894 0.7029 (4H chart)
Support levels: 0.6701 0.6663 0.6649 (4H chart)
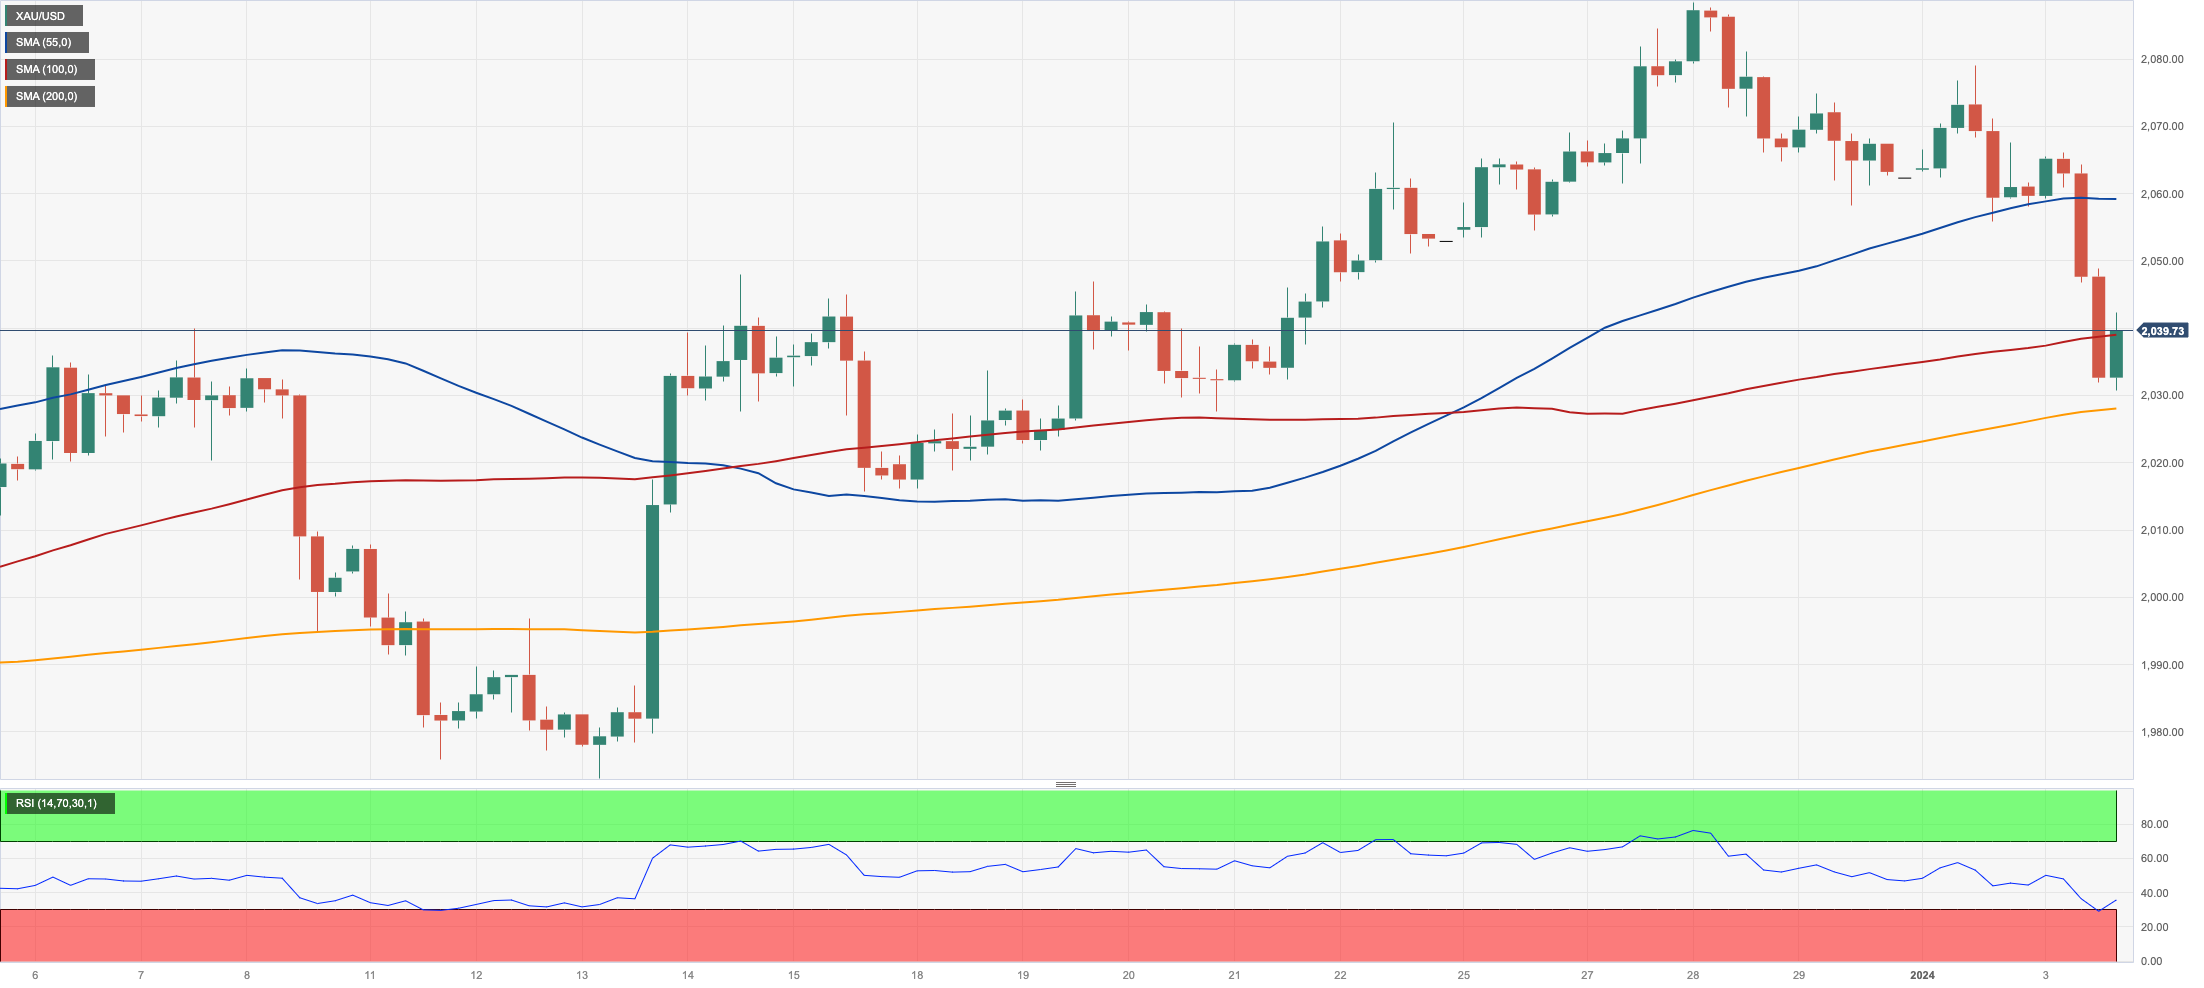
GOLD
The strong optimism surrounding the dollar at the start of the new trading year weighed further on gold prices on Wednesday.
Indeed, the price of the troy ounce of the yellow metal dropped markedly to fresh two-week lows near the $2030 region on the back of the broad-based strength in the greenback in combination with the march north in US yields across the board.
Looking ahead, the movement of gold prices is anticipated to be influenced by the actions of the Fed, particularly with its plan to lower interest rates starting in Q2, which should be supportive for the precious metal.
If gold prices drop further and breach the $2000 contention zone, they might then challenge the December 2023 low of $1973 (December 13), ahead of the 200-day SMA of $1961 and the November 2023 low of $1931 (November 13). South of here, the October 2023 low of $1810 (October 6), the 2023 low of $1804 (February 28), and, finally, the critical $1800 contention zone can be noted. On the opposite direction, the next level of resistance will be the December 2023 top of $2088 (December 28), followed by the all-time peak of $2150 (December 4 2023).
Resistance levels: $2088 $2149 (4H chart)
Support levels: $2030 $2025 $2015 (4H chart)
CRUDE WTI
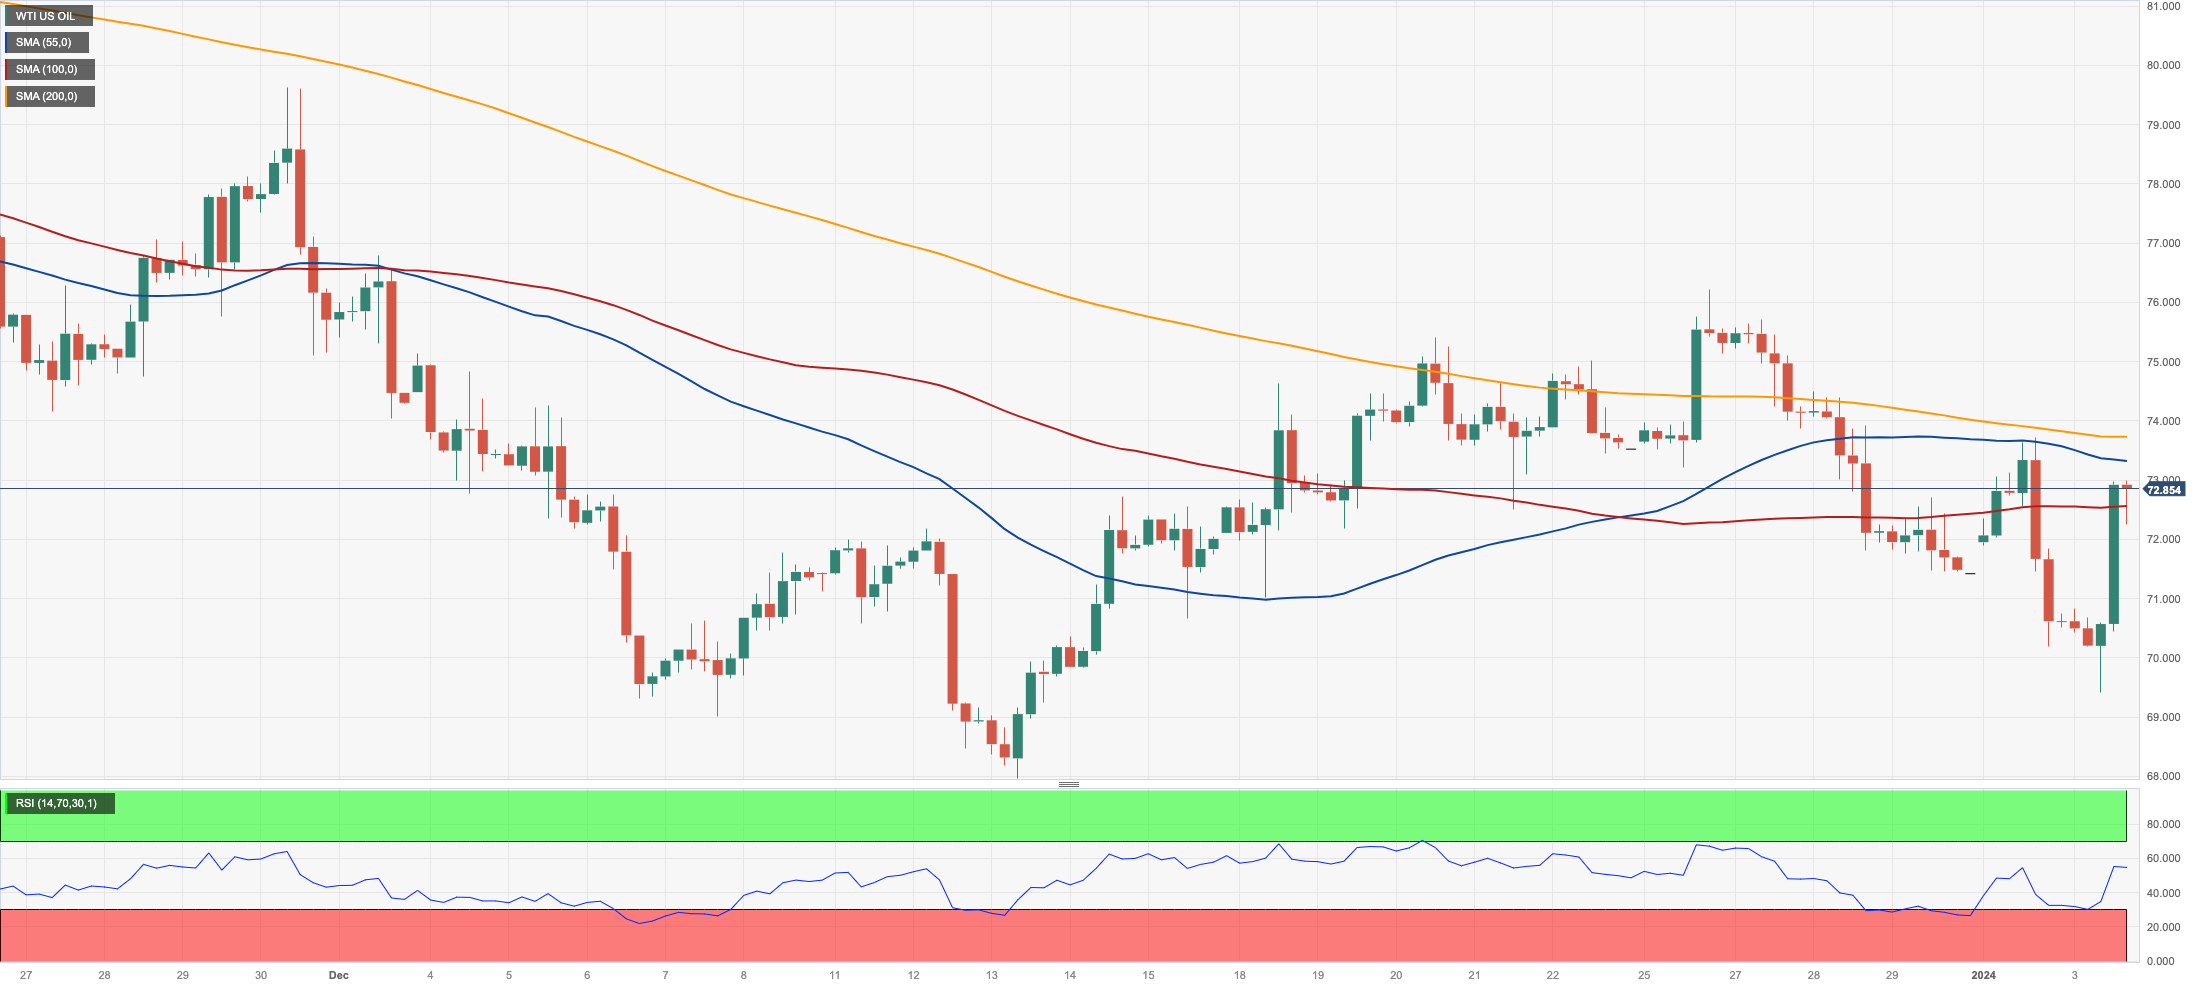
Finally, some respite for the prices of WTI.
In fact, crude oil prices regained a smile after a gloomy start to the year, rebounding markedly to the $73.00 mark per barrel on Wednesday.
The strong bounce in the commodity came after the shutdown of the Sharara oilfield in Libya, which seems to have reignited the tight supply narrative, adding at the same time to concerns hovering around the Red Sea and the Middle East.
Against that backdrop, WTI managed to leave behind some demand concerns stemming from China, while some prudence is expected to kick in ahead of upcoming key releases in the US docket.
The weekly high of $76.14 (December 26 2023) is the next target for WTI, followed by the key 200-day SMA at $77.86, the crucial $80.00 barrier, and the November 2023 top of $80.15 (November 3). Further gains from here may push the market back to its weekly peak of $89.83 (October 18 2023), ahead of the 2023 high of $94.99 (September 28 2023) and the August 2022 high of $97.65 (August 30), all before the critical $100.00 mark. Having said that, a break below the December 2023 low of $67.74 (December 13) might result in a plunge to the May 2023 low of $63.61 (May 4) before reaching the critical $60.00 support.
Resistance levels: $72.87 $73.61 $76.14 (4H chart)
Support levels: $71.20 $70.28 $67.68 (4H chart)
DOW JONES
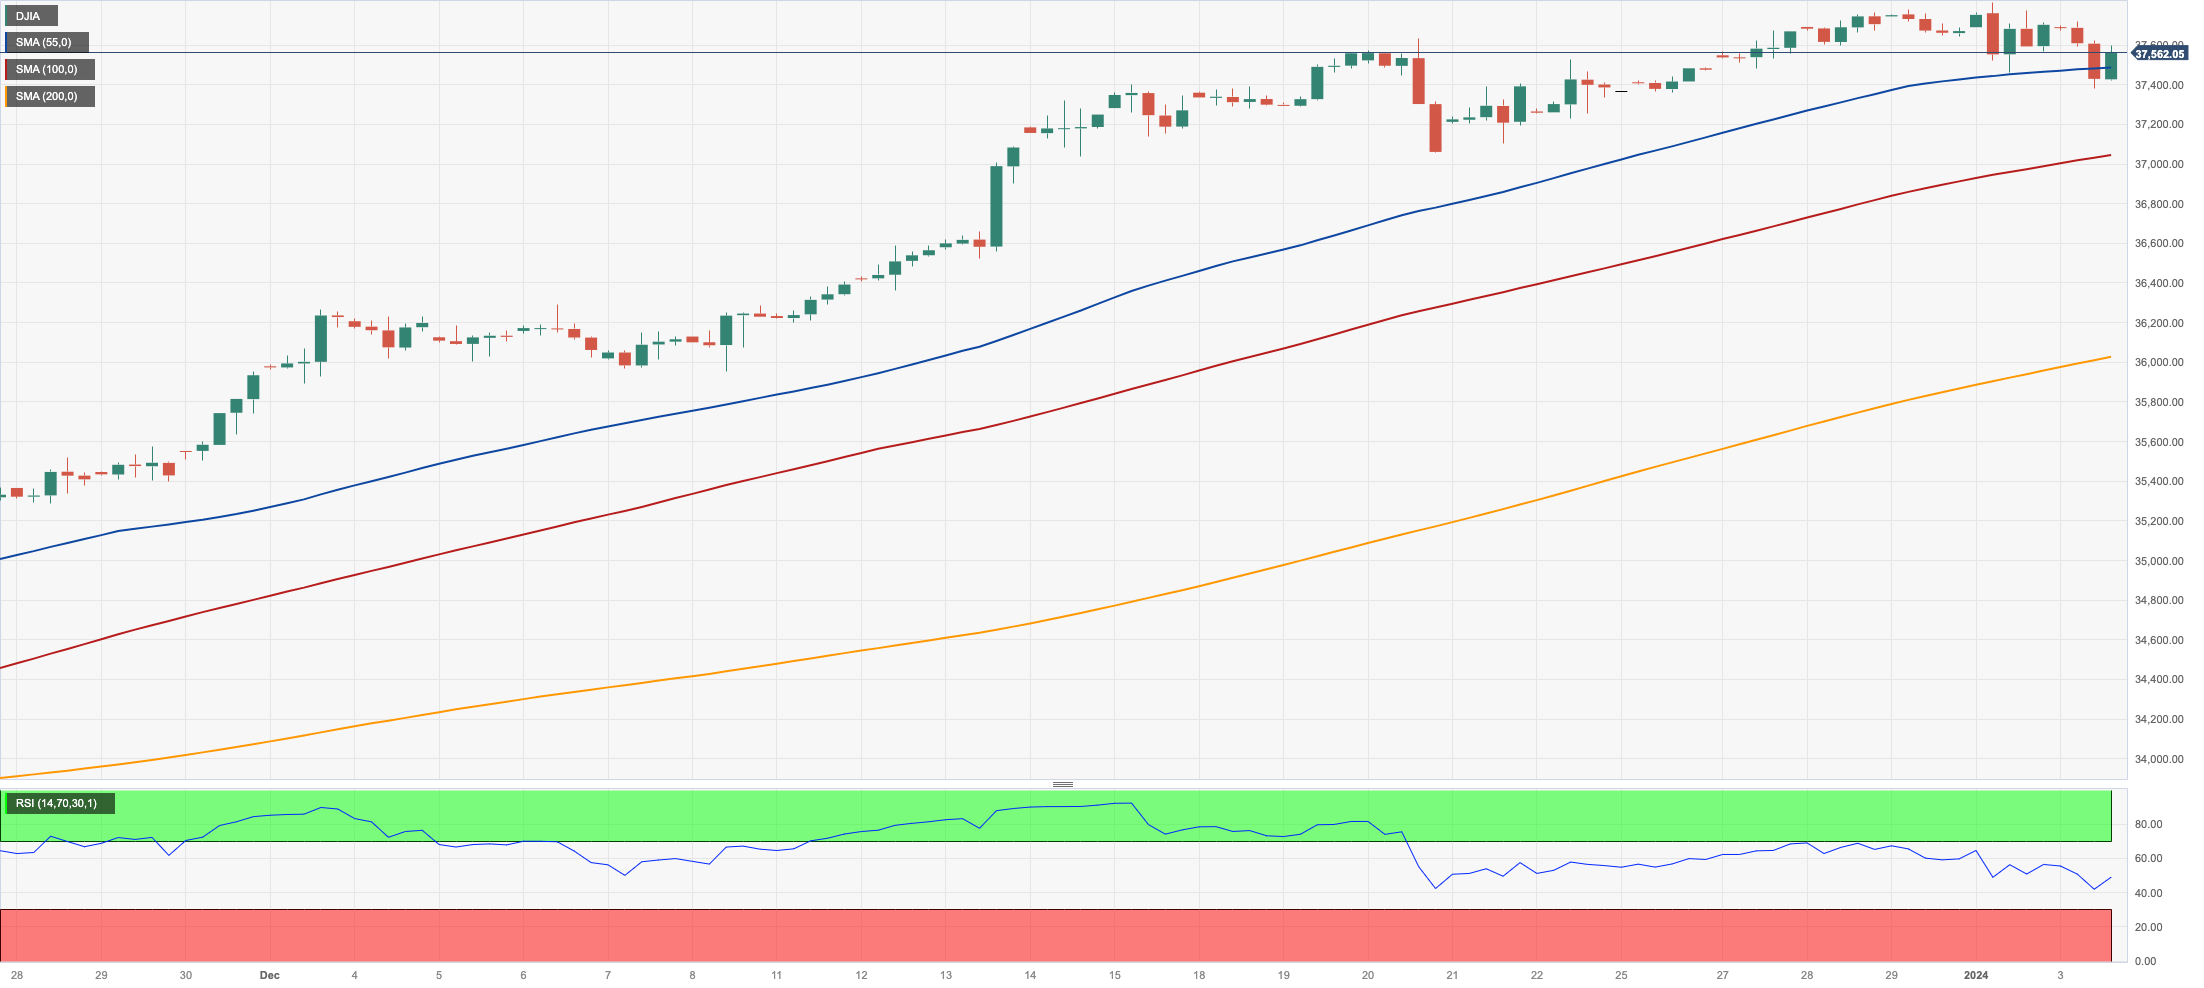
US stocks faded Tuesday’s move to a new record top and motivated the Dow Jones to retreat modestly to the 37400 region, where some initial contention appears to have emerged on Wednesday.
In the meantime, the broad backdrop remained unchanged as investors continued to hold an optimistic perspective, bolstered by their strong confidence in anticipated future interest rate reductions by the Fed. Furthermore, the release of the FOMC Minutes did not change this view.
This positive sentiment is further fueled by the economy's steadfast resilience, ongoing disinflationary pressures, and an increasing belief in a gradual economic slowdown without severe repercussions, all ahead of the release of the always-relevant labour market report on Friday.
On the whole, the Dow Jones retreated 0.31% to 37596, the S&P500 eased 0.34% to 4727, and the tech-heavy Nasdaq Composite dropped 0.65% to 14673.
If the bulls maintain control, the Dow will aim for its all-time high of 37790 (January 2). Immediate support in the opposite direction might be found at the weekly low of 37073 (December 20 2023), which is previous to the December 2023 low of 36010 (December 5), as well as the critical 200-day SMA at 34355. The weekly low of 33859 (November 7, 2023) emerges prior to the October 2023 low of 32327 (October 27) and the 2023 low of 31429 (March 15). A breach of the latter might lead to a test of the 2022 low of 28660 (October 13). The daily RSI stayed near 73, suggesting that the market was still overbought.
Top Performers: Merck&Co, Chevron, Amgen
Worst Performers: Boeing, Walgreen Boots, Caterpillar
Resistance levels: 37790 (4H chart)
Support levels: 37073 36021 34811 (4H chart)
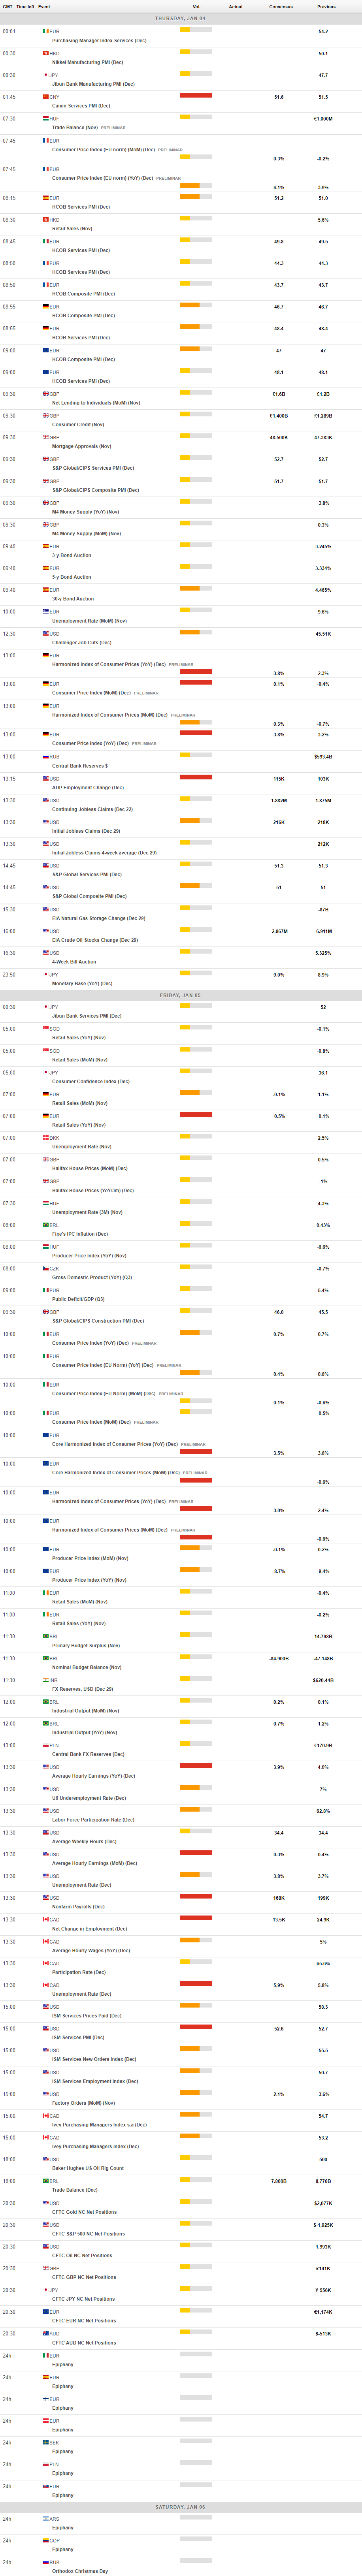
MACROECONOMIC EVENTS
All Information & Updates provided by:

All information relating to the financial markets available on this page has been prepared and issued by FXStreet (Forexstreet SL, Spain, Reg: B62498233) on the basis of publicly available information and all information believed to be reliable and does not conflict with Kuwaiti local laws, and all necessary care has been taken to before the company to ensure that the facts mentioned are correct from the source.
NCM Investment nor any of its directors or employees shall in any way be held responsible for the contents of this news, and the information contained on this page is intended only to provide clients with publicly available information and should not be construed as investment advice, report or analysis and/or constitute an offer or invitation to buy or sell financial instruments of any kind.
RISK WARNING: Forex and CFDs are highly risky leveraged products, as losses can exceed deposits. Please ensure you understand all the risks and take independent advice if necessary. NCM will segregate the clients based on the criteria of the regulator and its bylaws. NCM does not provide any advisory service; the material published does not constitute advice or a recommendation for a transaction in any financial instrument. NCM accepts no responsibility for any use of the content presented and any consequences of that use. Anyone acting on the information provided does so at their own risk.