
- Contact Us:
-

-

-

-


Daily Market Updates
05 Jan 2024
EURUSD
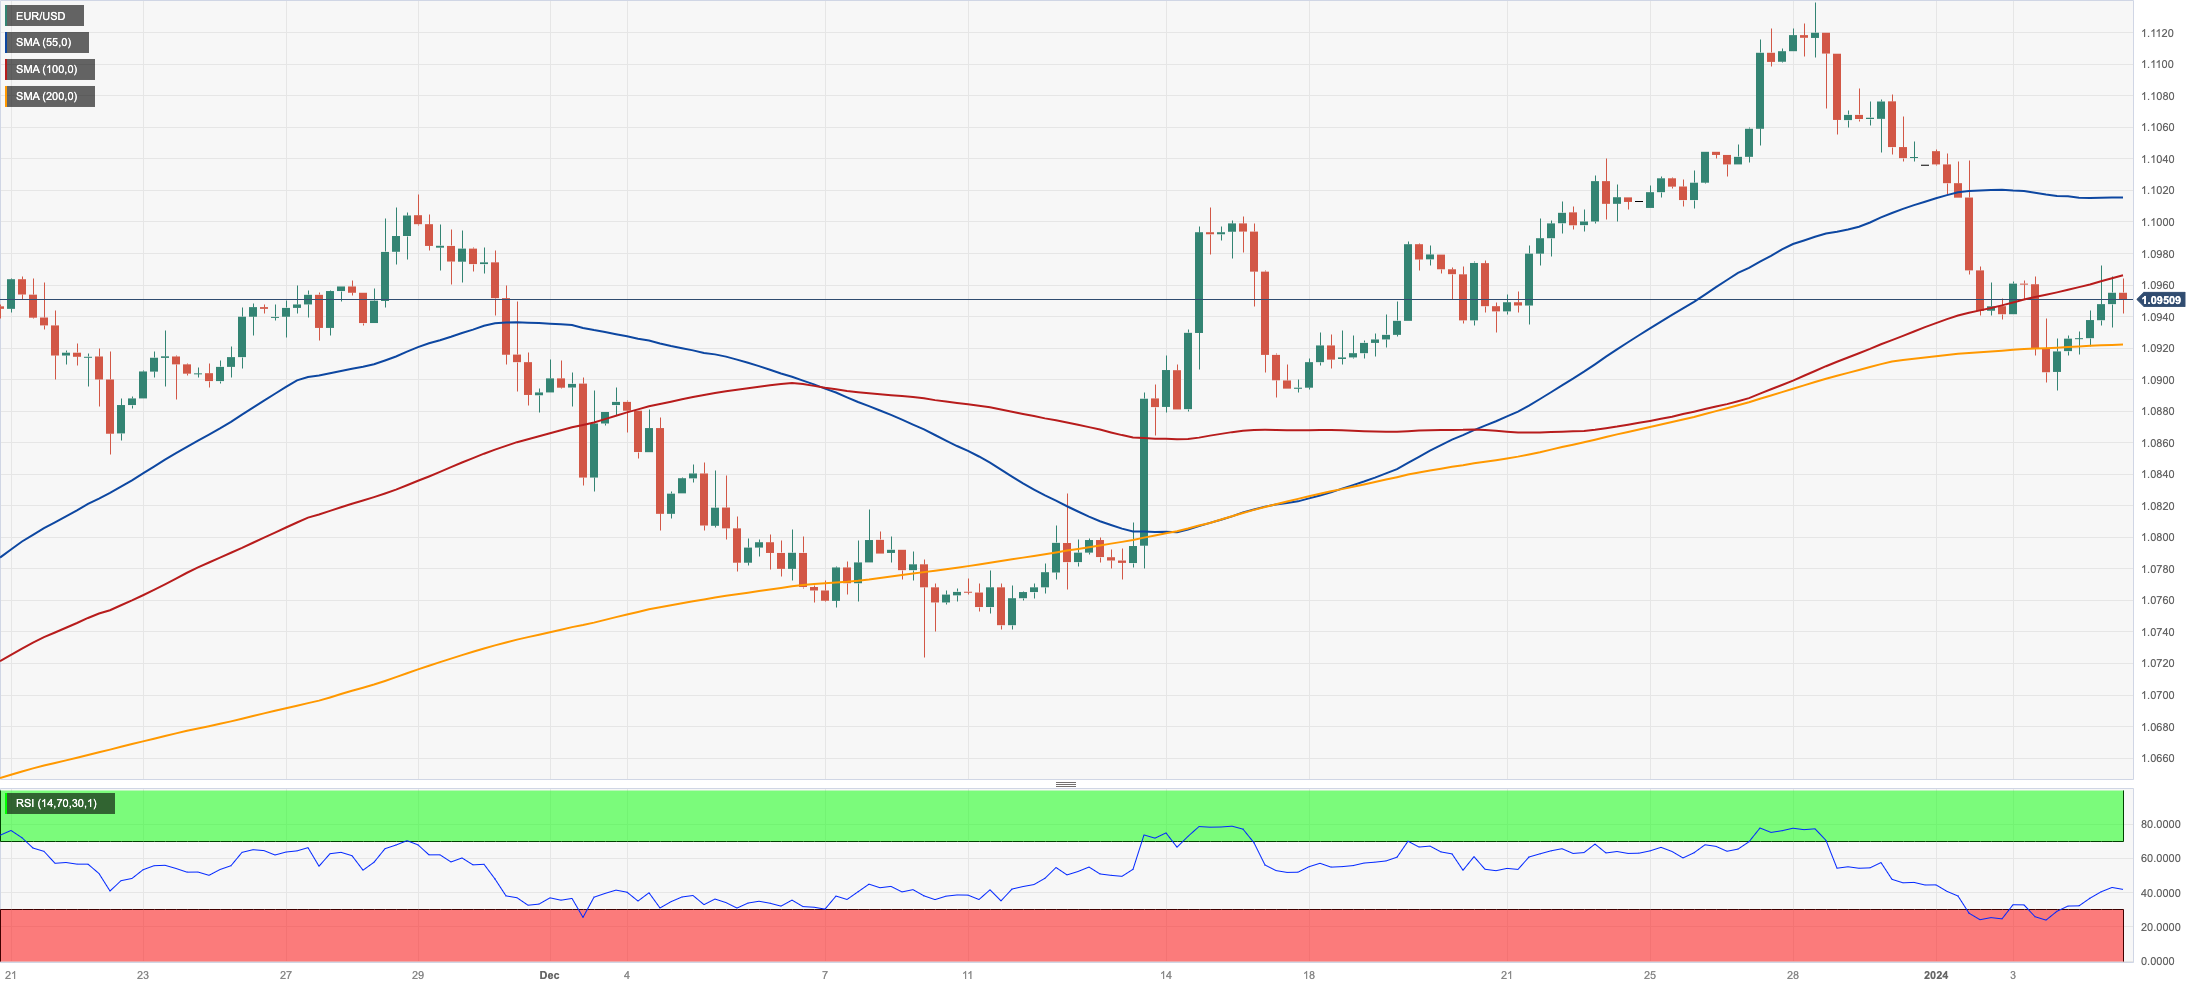
EUR/USD partially reversed the multi-session retracement and managed to revisit the 1.0970 zone on Thursday, regaining some balance following Wednesday’s drop to the sub-1.0900 zone.
The greenback, on the other hand, traded mostly on the defensive against the backdrop of the improvement in appetite for the risk-associated universe, while the continuation of the upside momentum in US yields across different timeframes and the hawkish tone from the FOMC Minutes seem to have somewhat limited the downside in the USD Index (DXY).
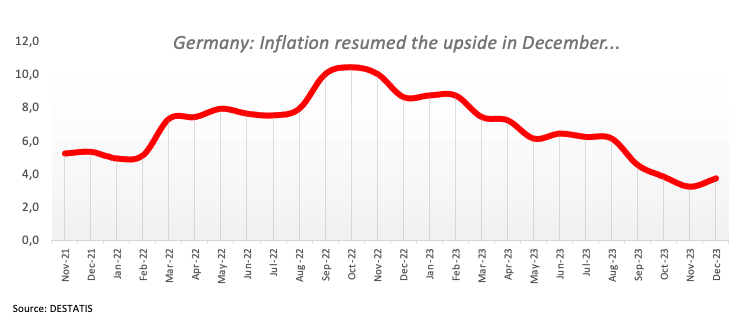
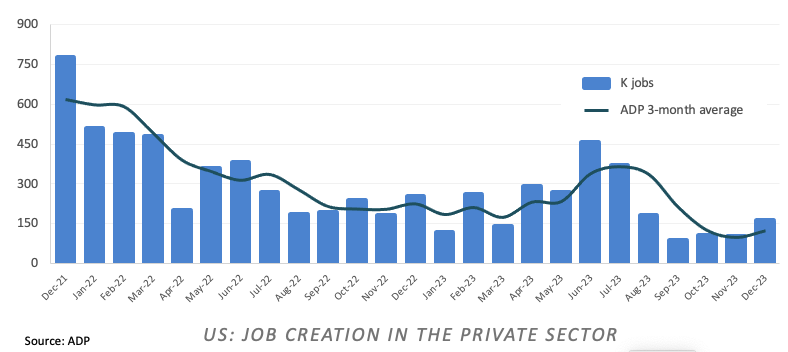
There was no reaction in the FX world after Germany’s flash CPI rose more than expected by 3.7% in the year to December, while the ADP report showed the US private sector creating more jobs than initially estimated in December (+164K). Finally, usual weekly Initial Claims rose by 202K in the week to December 30.
Additional data in the euro docket saw the final Services PMI come in at 49.3 in Germany and 48.8 in Euroland. In the US, the final Services PMI turned up at 51.4 in the last month of 2023.
If EUR/USD breaks below the YTD low of 1.0892 (January 3), it may revisit the critical 200-day SMA of 1.0845, as well as the transitory 55-day SMA of 1.0832, all ahead of the December 2023 low of 1.0723 (December 8). If the latter is breached, a test of the weekly low of 1.0495 (October 13, 2023) before the 2023 low of 1.0448 (October 3) and the round level of 1.0400 might begin to form. Just the opposite, there is an immediate up barrier at the December 2023 peak of 1.1139 (December 27) prior to the weekly high of 1.1149 (July 27 2023), which is also supported by the 200-week SMA at 1.1150, both of which precede the 2023 top of 1.1275 (July 18). On the daily chart, the RSI climbed past the 51 level.
Resistance levels: 1.0972 1.1009 1.1139 (4H chart)
Support levels: 1.0892 1.0888 1.0723 (4H chart)
USDJPY
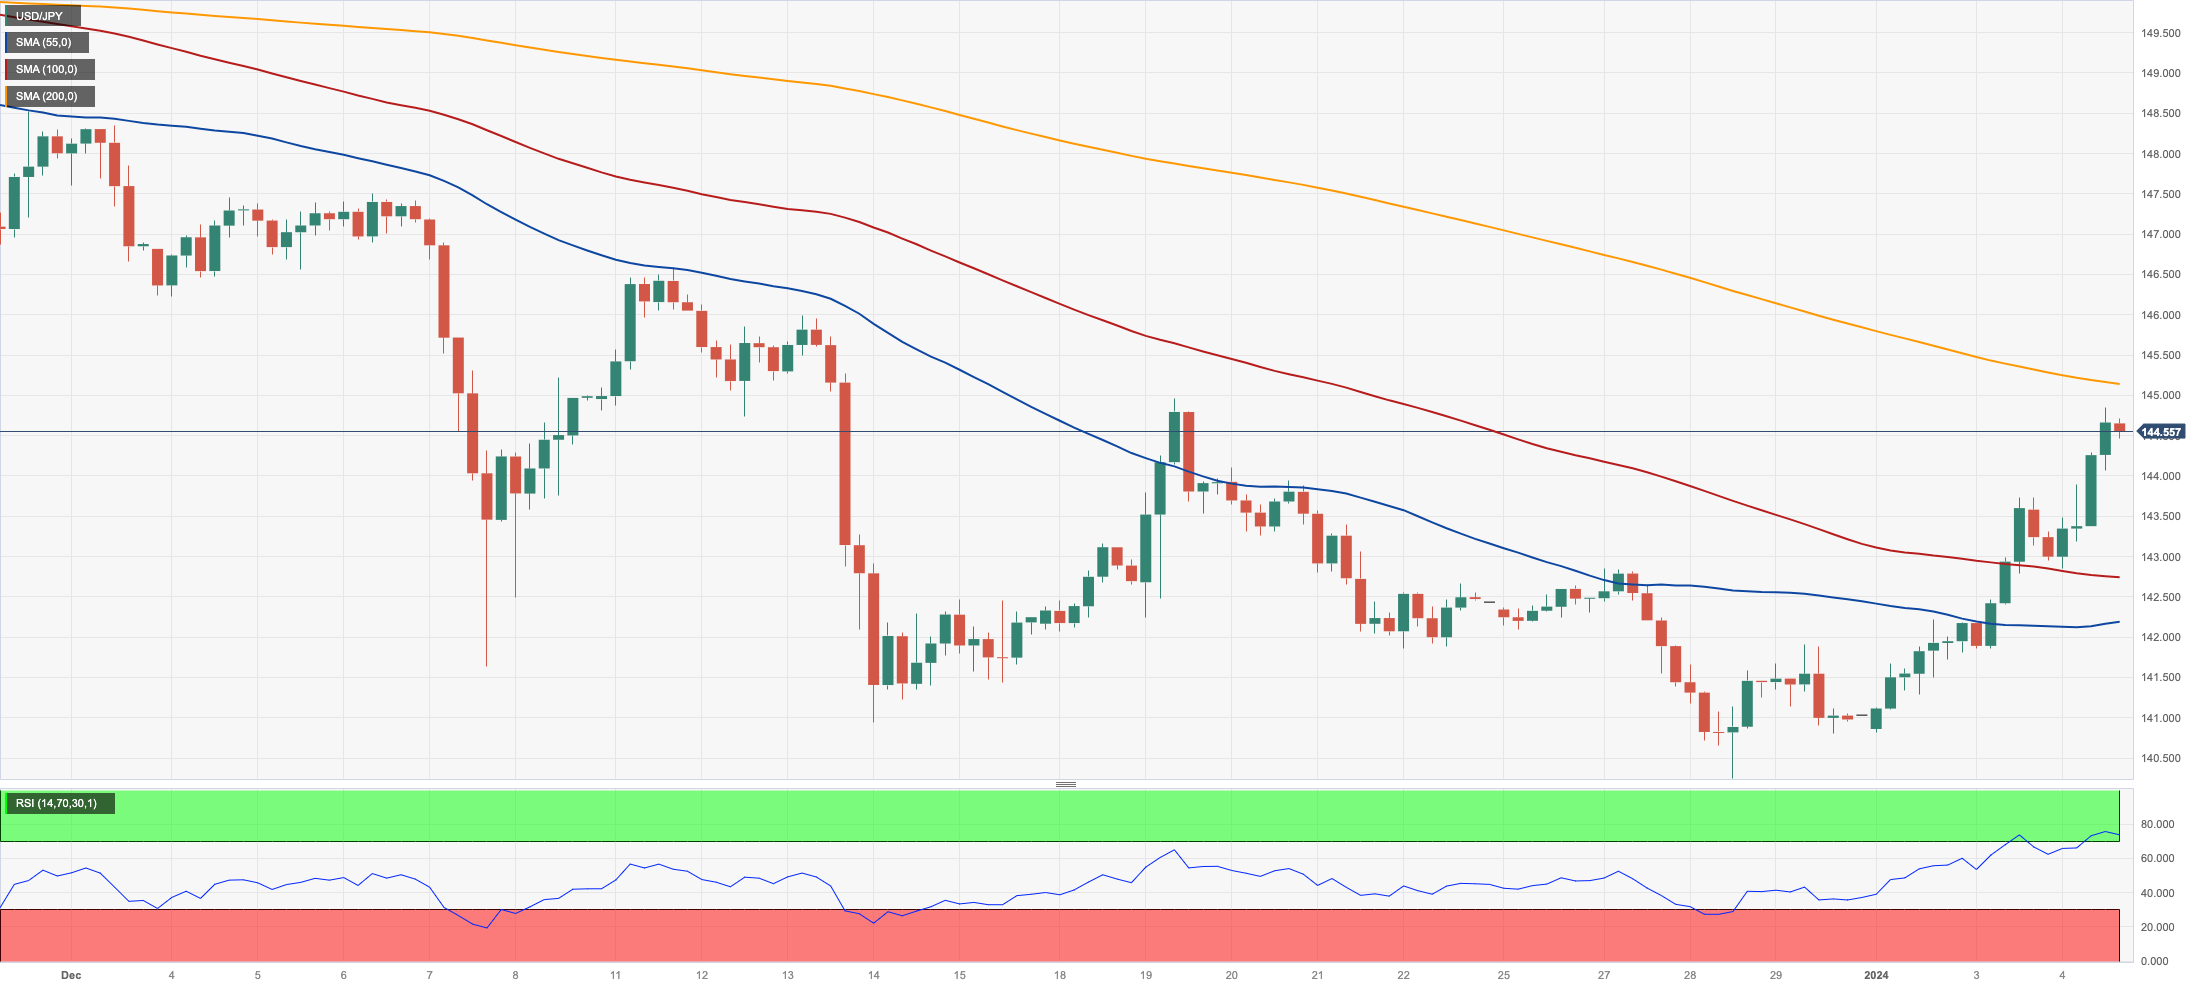
The intense depreciation of the Japanese yen lent extra wings to USD/JPY and motivated it to poke with the area of three-week tops just below the 145.00 yardstick on Thursday.
The prevailing risk-on mood in combination with the robust recovery in US yields across different maturities and further flat-lined developments in the JGB 10-year yields all contributed to another strong advance in spot.
In Japan, the final Jibun Bank Manufacturing PMI came in at 47.9 in December.
If buying pressure remains, USD/JPY may retarget the weekly high of 144.95 (December 19 2023) ahead of the transitory 55-day SMA of 147.17. North from here emerges the key 150.00 threshold prior to the 2023 top of 151.90 (November 13), the 2022 peak of 151.94 (October 21) and the round figure of 152.00. On the downside, a break below the December 2023 low of 140.24 (December 28) should expose the round level of 140.00 before to the July 2023 low of 137.23. (July 14) and the March 2023 low of 129.63 (March 24). The daily RSI climbed to the vicinity of 52.
Resistance levels: 144.84 144.95 146.58 (4H chart)
Support levels: 142.36 140.24 138.05 (4H chart)
GBPUSD
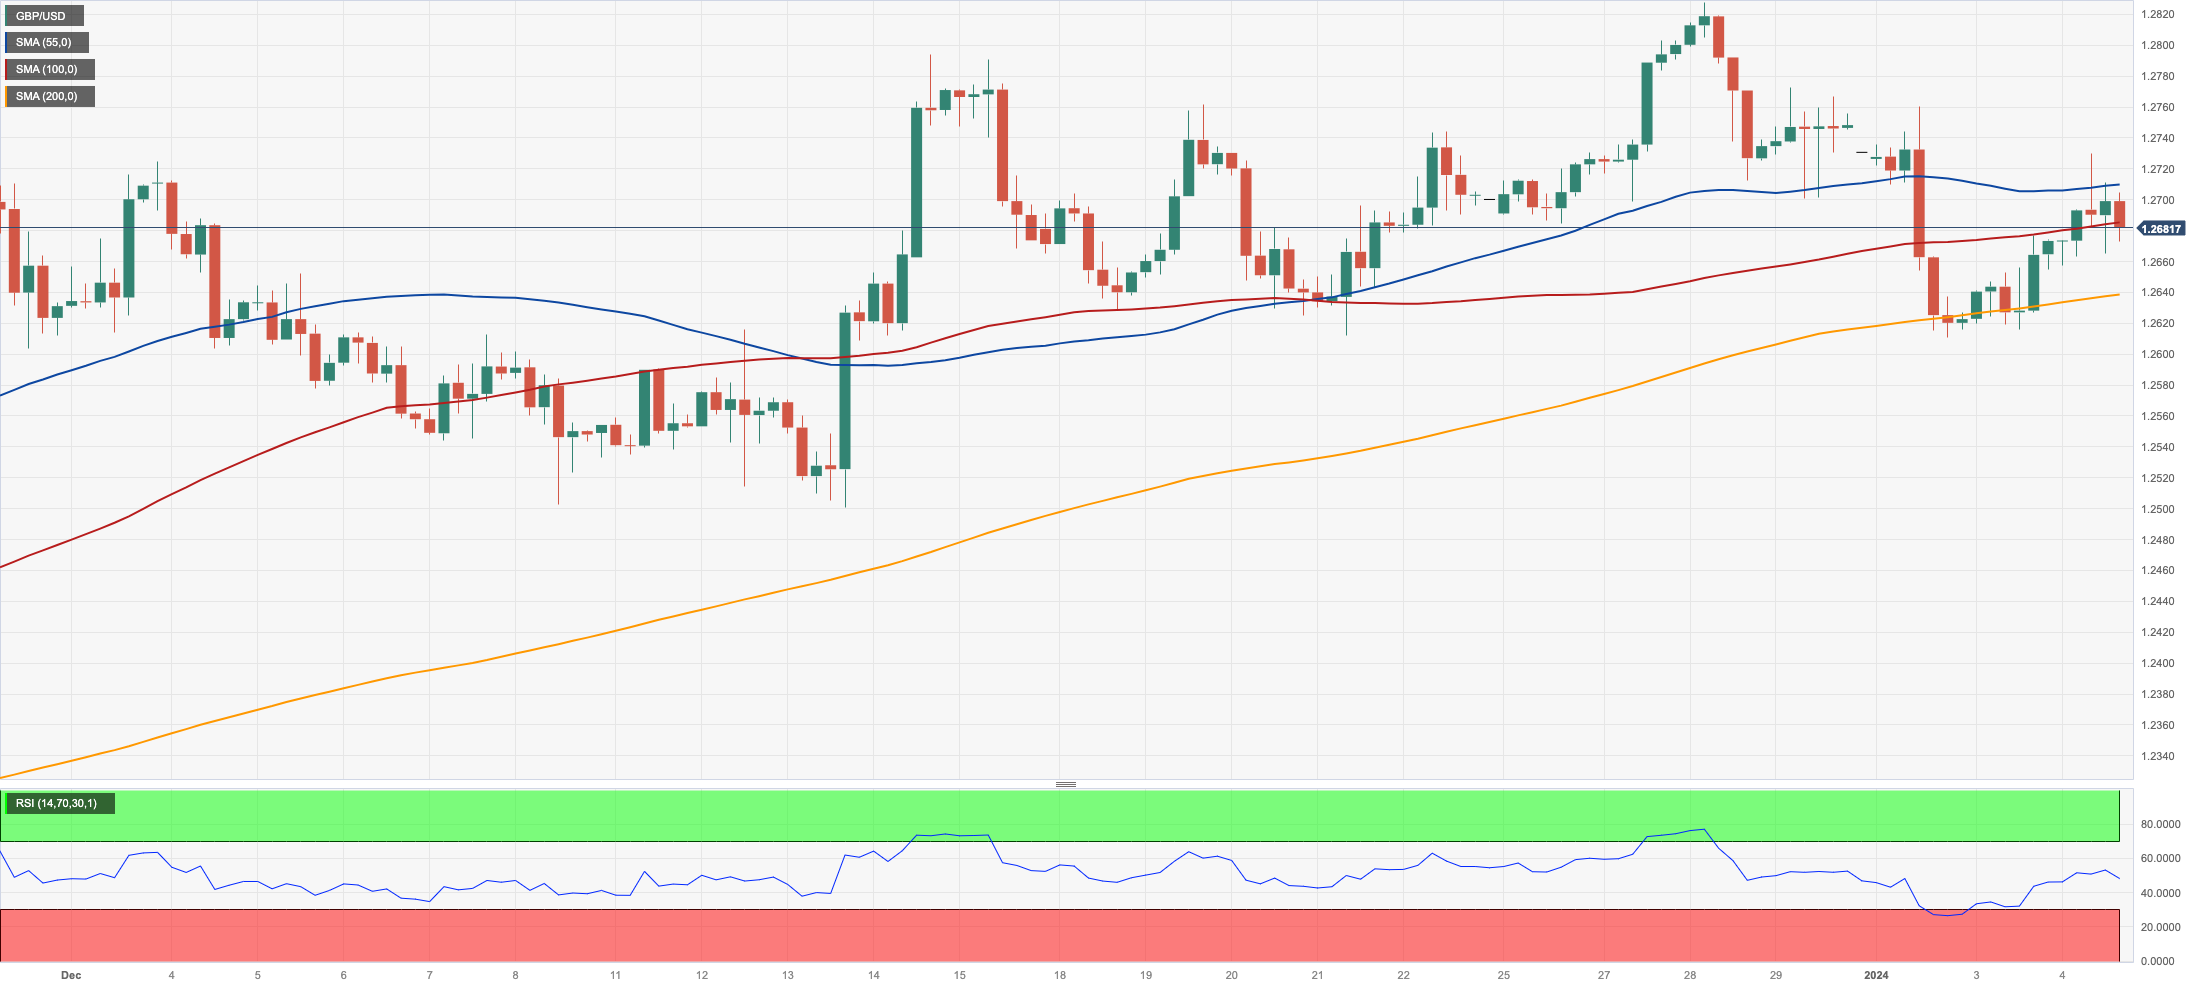
GBP/USD benefited from the corrective decline in the dollar and added to Wednesday’s gains north of 1.2700 the figure on Thursday. The initial uptick, however, ran out of steam, prompting the pair to eventually return to the 1.2680 region.
Further improvement in Cable came on the back of the renewed bout of selling pressure in the buck and an auspicious final print from the UK Services PMI for the month of December.
Collaborating with the buying bias in sterling came extra gains in the UK 10-year gilt yields, which rose to three-week highs near 3.75%.
In the UK, final Services PMI improved to 53.4 in December, while Mortgage Approvals increased by 50.067K in November and Mortgage Lending shrank by £0.039B in the same month.
If the recovery continues, GBP/USD may revisit the December 2023 high of 1.2827 (December 28), seconded by the weekly top of 1.2995 (July 27 2023), which is just over the crucial 1.3000 barrier. On the downside, the loss of the so far 2024 low of 1.2610 (January 2) could prompt the pair to dispute the key 200-day SMA at 1.2530 before the December 2023 low of 1.2500 (December 13) and the intermediate 55-day SMA at 1.2475. The latter is broken down to indicate a weekly low of 1.2187 (November 10 2023), which comes before the October 2023 low of 1.2037 (October 3), the key 1.2000 level, and the 2023 bottom of 1.1802 (March 8). The daily RSI recovered past 53.
Resistance levels: 1.2729 1.2772 1.2827 (4H chart)
Support levels: 1.2610 1.2500 1.2373 (4H chart)
AUDUSD
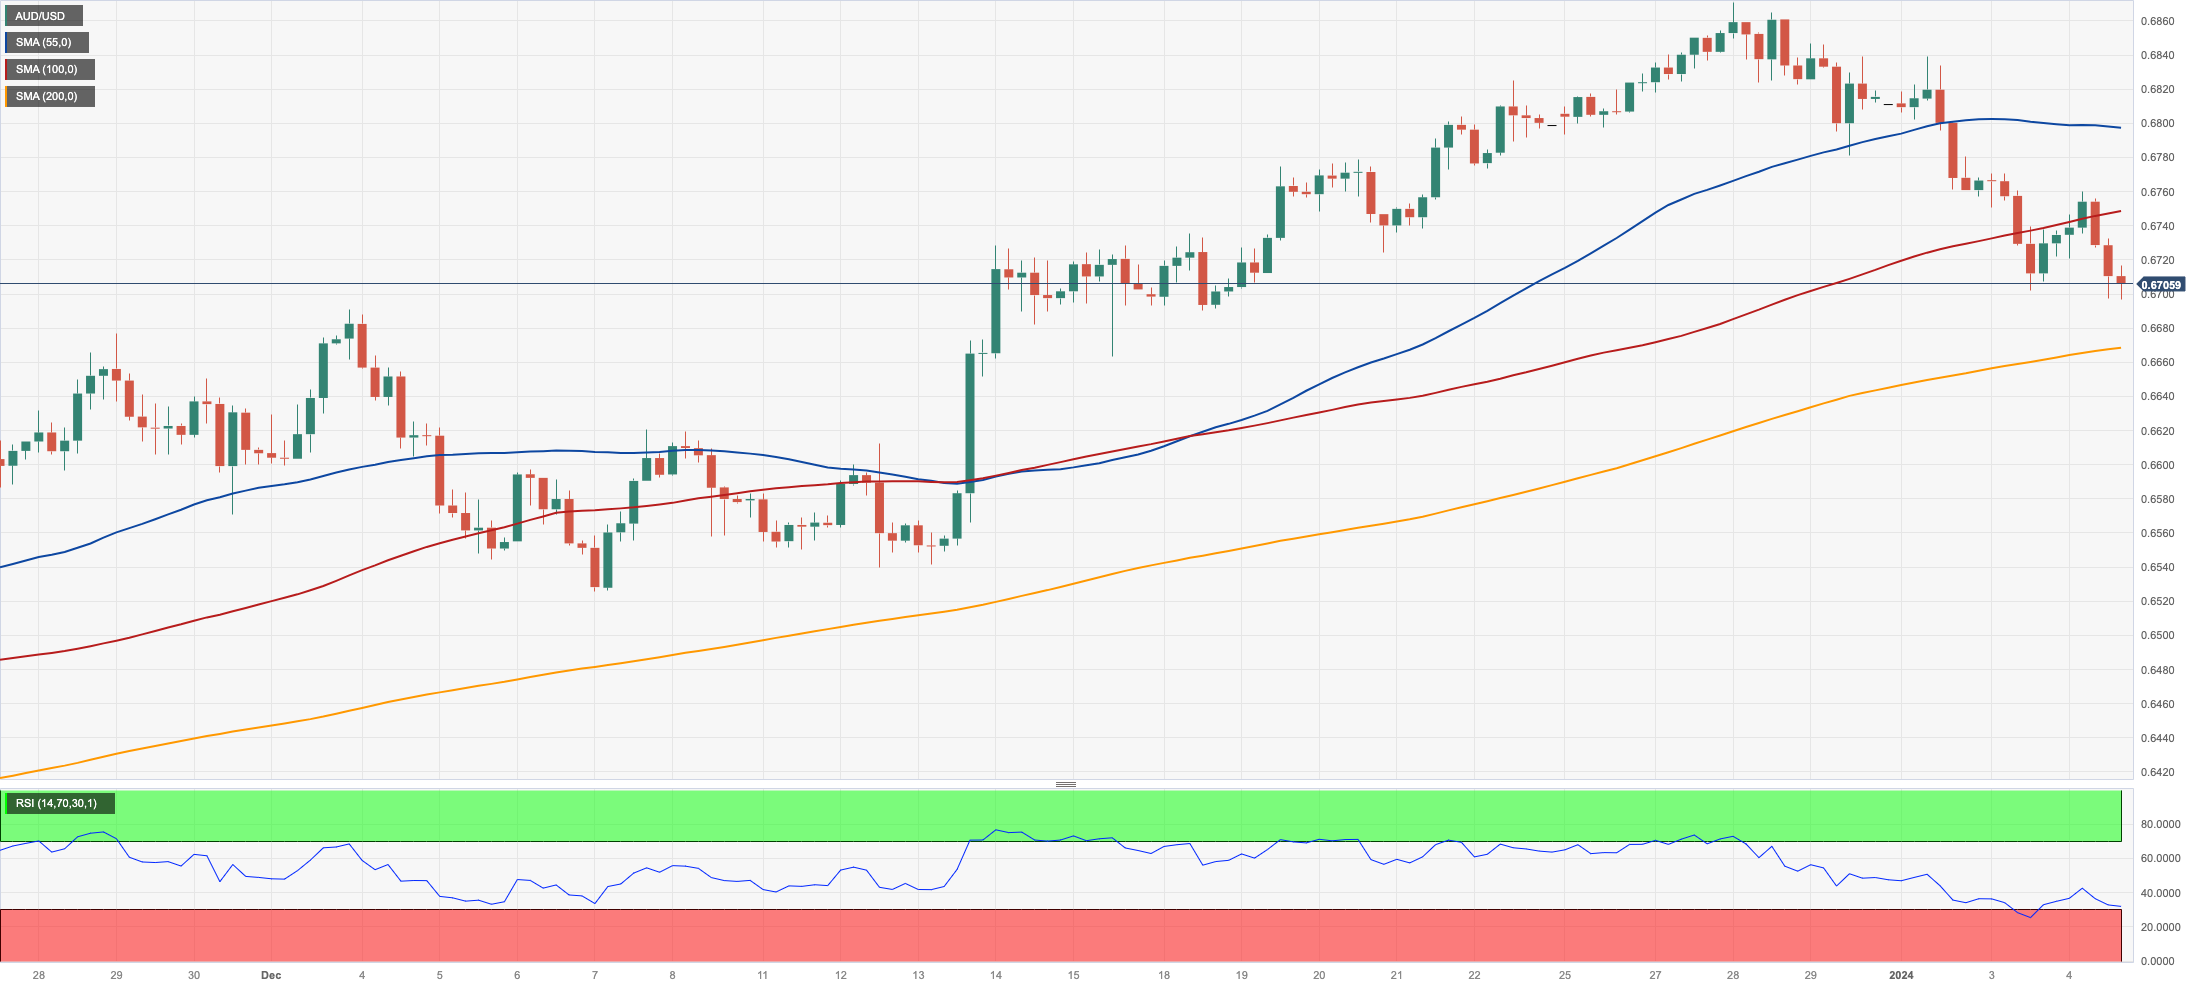
AUD/USD continued to retrace the December rally and briefly flirted with the 0.6700 contention zone once again on Thursday.
The fifth consecutive session of losses in the Aussie dollar came despite the modest pullback in the greenback and the persistent bearish tone in the commodity complex, while fresh multi-month peaks in iron ore prices failed to bring some respite to the currency.
The Australian calendar was empty on Thursday.
The 2023 low of 0.6697 (January 4) is immediately to the downside for AUD/USD, as is the 200-day SMA of 0.6582. The breakdown of the latter reveals the December 2023 bottom of 0.6525 (December 7), which precedes the 2023 low of 0.6270 (October 26) and the round level of 0.6200, all of which are ahead of the 2022 low of 0.6169 (October 13). On the flip side, the trespass of the December 2023 high of 0.6871 (December 28) may pave the way for a trip to the July 2023 top of 0.6894 (July 14) and the June 2023 peak of 0.6899 (June 16), both of which are located just before the important 0.7000 yardstick. The daily RSI dropped to the boundaries of 51.
Resistance levels: 0.6791 0.6871 0.6894 (4H chart)
Support levels: 0.6697 0.6663 0.6649 (4H chart)
GOLD
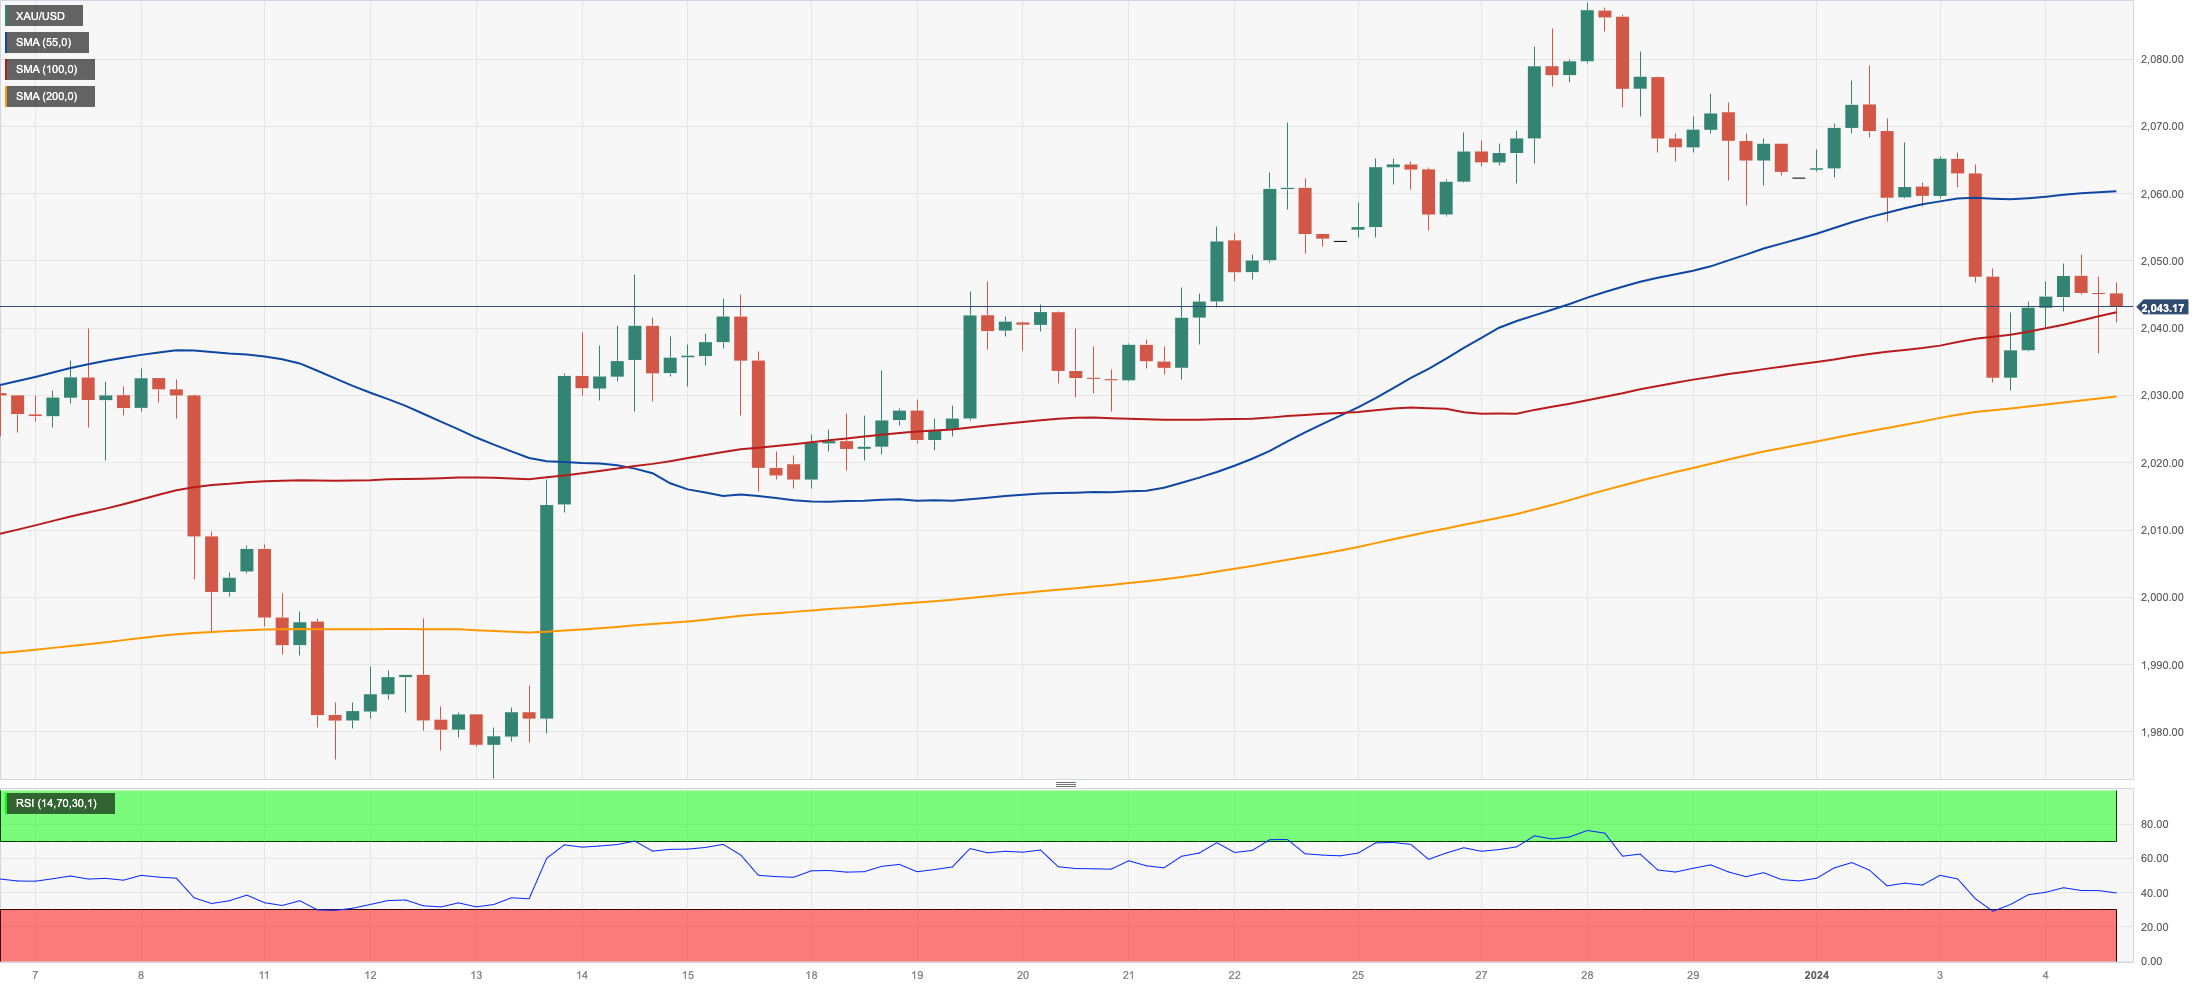
Finally, some respite for the yellow metal came from the renewed selling pressure hitting the greenback on Thursday.
In fact, the dollar lost part of its recent shine and allowed bullion to regain some composure, despite US yields extending further their recovery across the curve. That said, the precious metal revisited the $2050 zone per troy ounce after four daily drops in a row, including Wednesday’s pullback to multi-session lows near $2030.
Moving forward, gold faces the next risk event at Friday’s Nonfarm Payrolls for the month of December and its implications on the Fed’s plans to start reducing its interest rates in the next few months.
Further weakness in gold prices should meet the next support at the 2023 low of $2030 (January 3) prior to the key contention zone of $2000. The breakdown of this region exposes a potential decline to the December 2023 bottom of $1973 (December 13), ahead of the 200-day SMA of $1961 and the November 2023 low of $1931 (November 13). South of here, the October 2023 low of $1810 (October 6), the 2023 low of $1804 (February 28), and, lastly, the important $1800 support area can be seen. On the contrary, the next level of resistance will be the December 2023 high of $2088 (December 28), followed by the all-time top of $2150 (December 4 2023).
Resistance levels: $2078 $2088 $2149 (4H chart)
Support levels: $2042 $2027 $2015 (4H chart)
CRUDE WTI
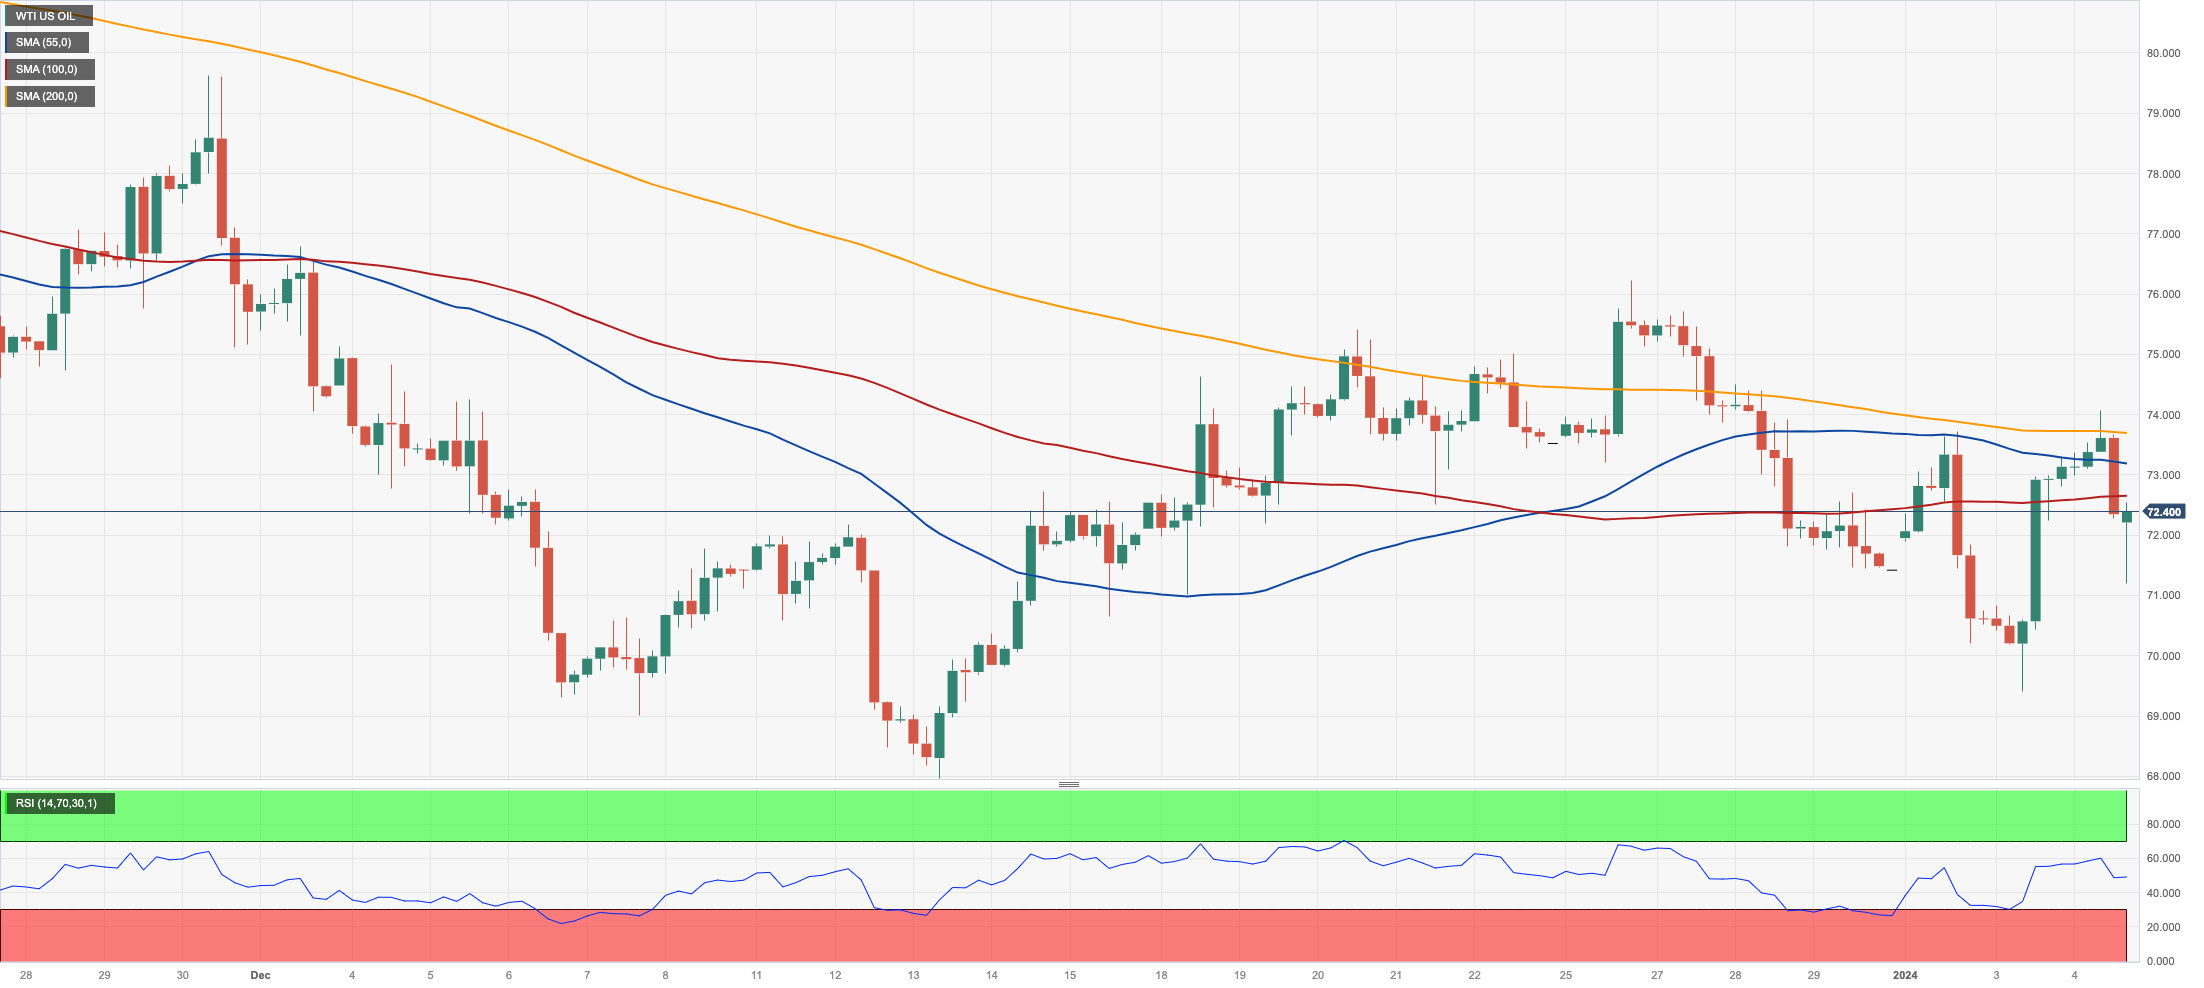
Wednesday’s recovery in WTI prices was short-lived.
Indeed, crude oil prices resumed the downside on the back of the resurgence of demand concerns, which seem to have been enough to eclipse persistent geopolitical effervescence as well as fresh supply disruption worries stemming from Libya.
In addition, WTI practically ignored the larger-than-expected drop in weekly US crude oil supplies, as per the EIA report. On the latter, US crude oil inventories dropped by 5.503M barrels in the week to December 29, while supplies at Cushing rose by 0.706M barrels, Weekly Distillate Stocks increased by 10.09M barrels, and gasoline stockpiles went up by 10.9M barrels.
If losses accelerate, WTI could revisit the 2023 low of $69.31 (January 3) ahead of the December 2023 low of $67.74 (December 13) and the May 2023 low of $63.61 (May 4), all before reaching the important $60.00 support. On the other hand, the immediate up-barrier is seen at the weekly peak of $76.14 (December 26 2023), prior to the significant 200-day SMA at $77.88, the critical $80.00 barrier, and the November 2023 high of $80.15 (November 3). Further advances from here may propel the market back to its weekly top of $89.83 (October 18 2023), ahead of the 2023 peak of $94.99 (September 28 2023) and the August 2022 high of $97.65 (August 30), all before the important $100.00 threshold.
Resistance levels: $73.96 $76.14 $79.56 (4H chart)
Support levels: $72.20 $69.25 $67.68 (4H chart)
DOW JONES
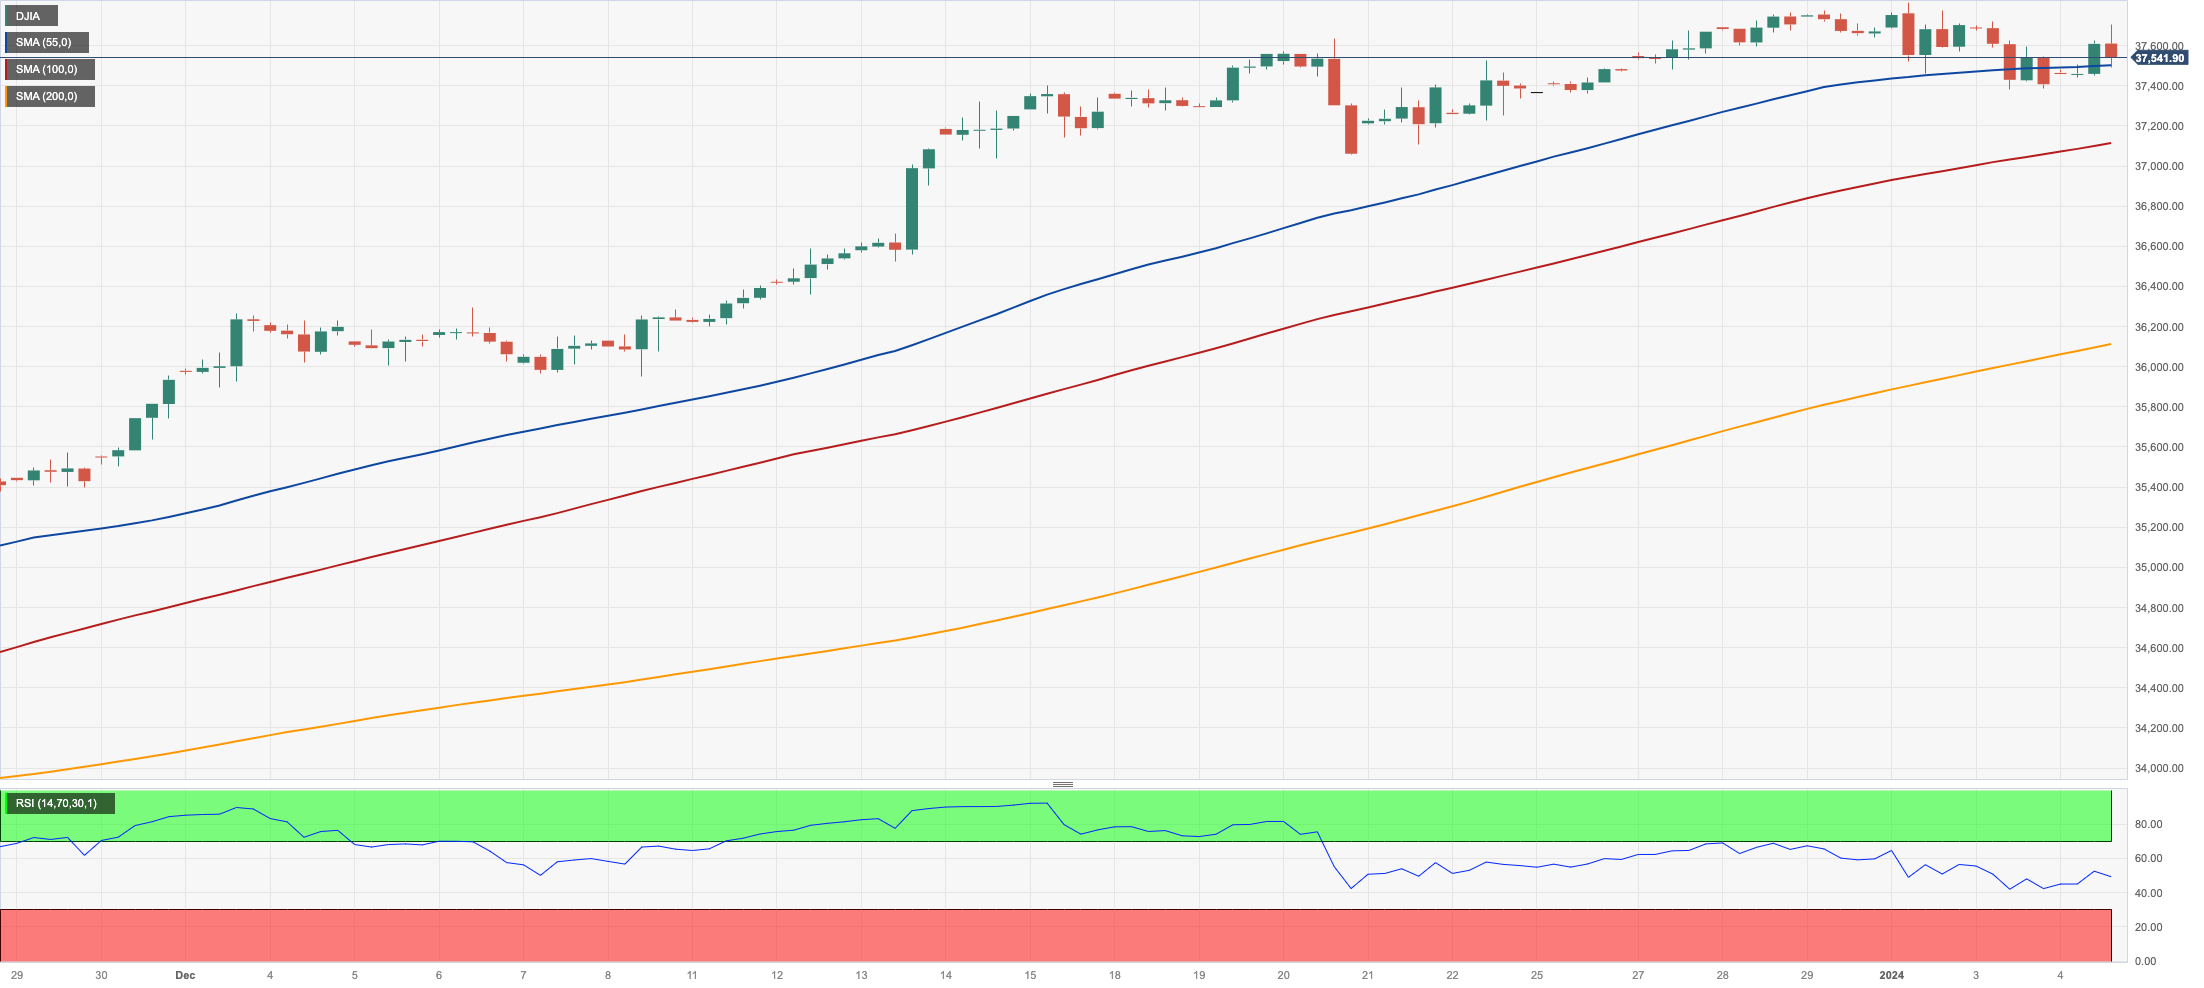
US equities gauged by the Dow Jones quickly left behind Wednesday’s pullback and rose markedly to the vicinity of the 37800 zone on Thursday.
The resumption of optimism among investors seems to have followed encouraging readings from the ADP report in December and weekly Claims, all of which should underpin hopes of positive Nonfarm Payrolls on Friday.
Meanwhile, the overall situation remained the same, with investors maintaining an optimistic outlook, in turn fueled by their strong belief in the Fed’s expected future interest rate cuts.
All in all, the Dow Jones advanced 0.56% to 37640, the S&P500 gained 0.21% to 4714, and the tech-benchmark Nasdaq Composite eased 0.06% to 14582.
If the bulls keep control, the Dow will attempt to reach its all-time top of 37790 (January 2). Immediate support might be found in the opposite direction at the weekly low of 37073 (December 20 2023), which is prior to the December 2023 low of 36010 (December 5), as well as the important 200-day SMA at 34381. The weekly low of 33859 (November 7, 2023) appears before the October 2023 low of 32327 (October 27) and the 2023 low of 31429 (March 15). If the latter is breached, the 2022 low of 28660 may be tested (October 13). The daily RSI remained above 70, indicating that the market was still overbought.
Top Performers: Merck&Co, JPMorgan, Boeing
Worst Performers: Walgreen Boots, Walt Disney, Apple
Resistance levels: 37790 (4H chart)
Support levels: 37073 36021 34834 (4H chart)
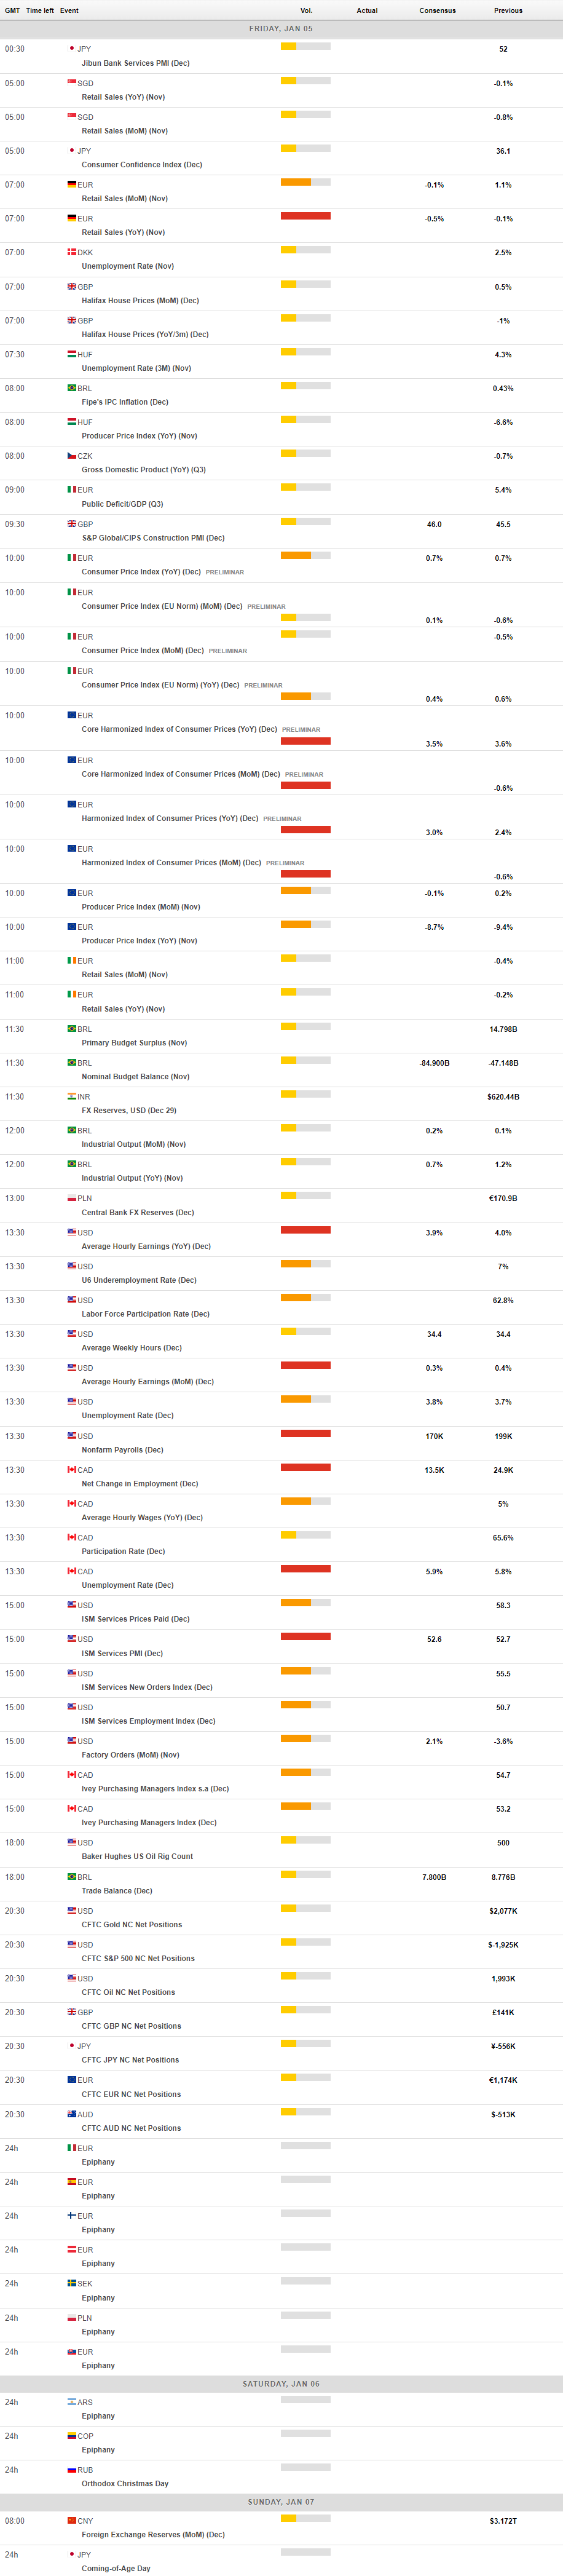
MACROECONOMIC EVENTS
All Information & Updates provided by:

All information relating to the financial markets available on this page has been prepared and issued by FXStreet (Forexstreet SL, Spain, Reg: B62498233) on the basis of publicly available information and all information believed to be reliable and does not conflict with Kuwaiti local laws, and all necessary care has been taken to before the company to ensure that the facts mentioned are correct from the source.
NCM Investment nor any of its directors or employees shall in any way be held responsible for the contents of this news, and the information contained on this page is intended only to provide clients with publicly available information and should not be construed as investment advice, report or analysis and/or constitute an offer or invitation to buy or sell financial instruments of any kind.
RISK WARNING: Forex and CFDs are highly risky leveraged products, as losses can exceed deposits. Please ensure you understand all the risks and take independent advice if necessary. NCM will segregate the clients based on the criteria of the regulator and its bylaws. NCM does not provide any advisory service; the material published does not constitute advice or a recommendation for a transaction in any financial instrument. NCM accepts no responsibility for any use of the content presented and any consequences of that use. Anyone acting on the information provided does so at their own risk.