
- Contact Us:
-

-

-

-


Daily Market Updates
08 Jan 2024
EURUSD
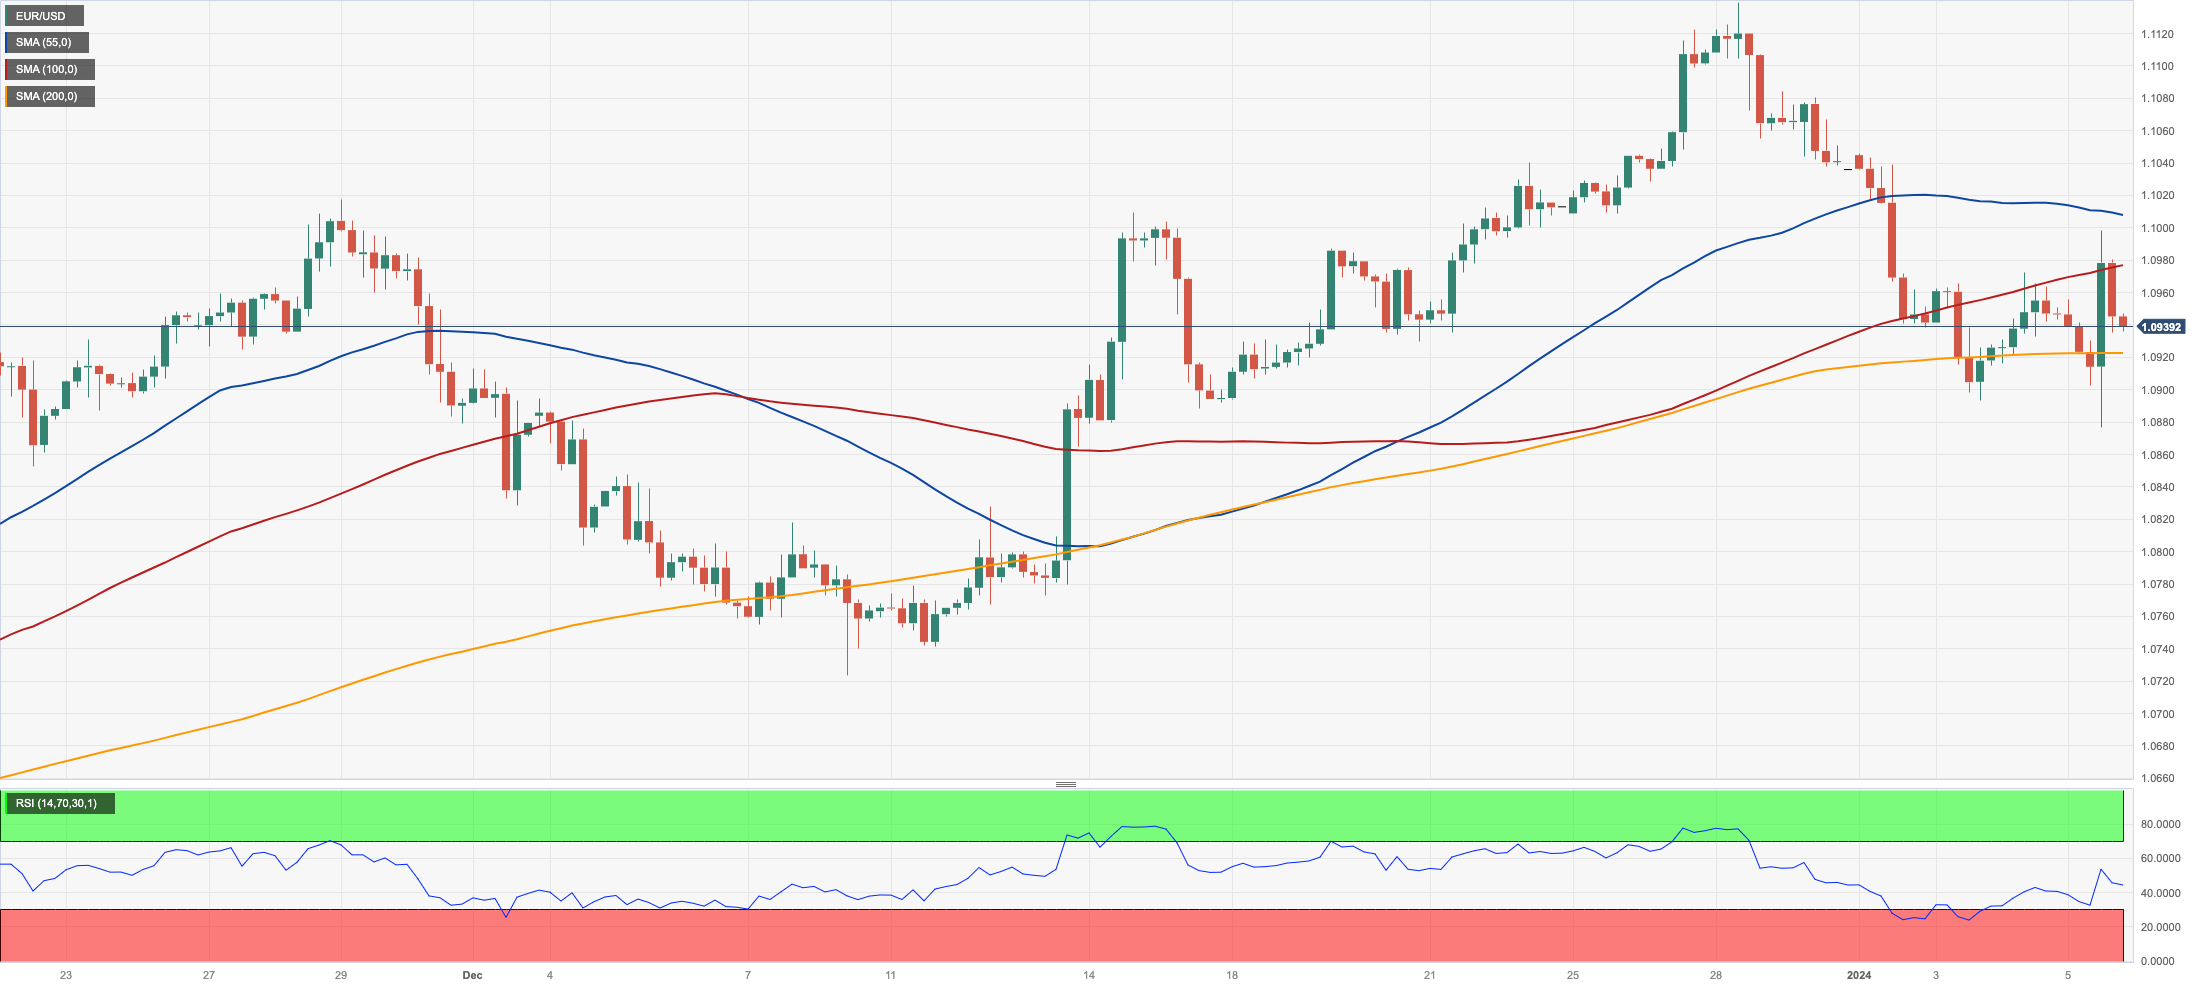
The humble advance in the greenback left EUR/USD empty-handed around 1.0940 despite hitting the boundaries of the psychological 1.1000 hurdle soon after the release of US Nonfarm Payrolls on Friday. Looking at the weekly chart, the pair reversed three consecutive gains to start the year with marked losses.
It was quite a volatile session for the greenback as well, motivating the USD Index (DXY) to climb past 103.00 the figure, or three-week highs, and eventually returning to square one around 102.50, along with the upside bias in US yields across different timeframes.
In the meantime, risk appetite trends remained mixed at the end of the week, although the firmer-than-expected US NFP readings lent extra support to the view of a “soft landing” of the economy, exacerbating its resilience at the same time (like if it was needed).
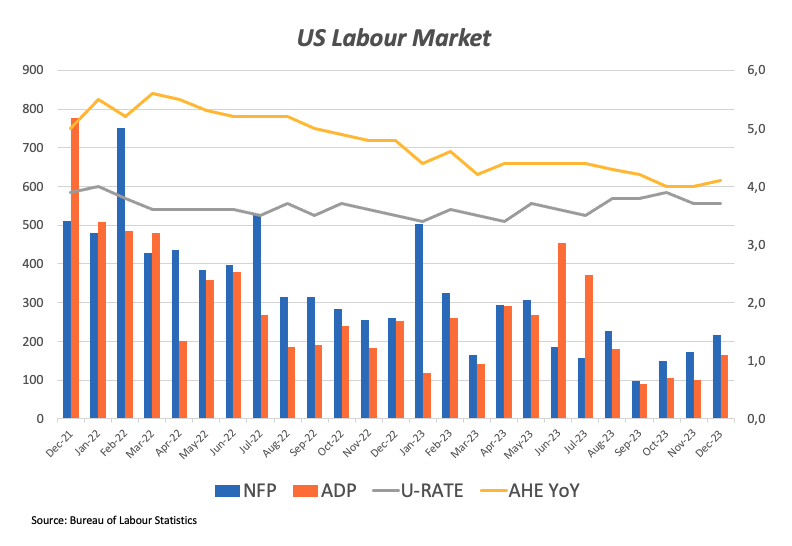
On the US docket, the economy added 216K jobs in December, surpassing consensus for a 150K gain, according to Nonfarm Payrolls. In addition, the jobless rate held steady at 3.7%, Average Hourly Earnings rose by 4.1% from a year earlier, and the Participation Rate eased to 62.5%. Closing the daily calendar, the ISM Services PMI eased to 50.6 in December, and Factory Orders expanded by 2.6% MoM in November.
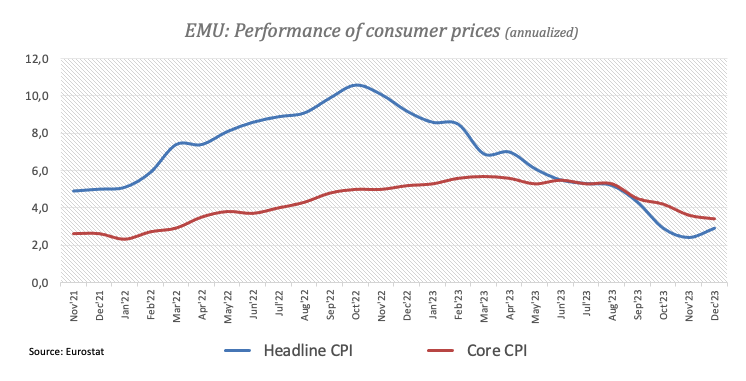
In the domestic calendar, Retail Sales in Germany contracted 2.4% in the year to November, and the final inflation figures in the euro area showed the headline CPI rising 2.9% YoY and 3.4% over the last twelve months when excluding food and energy costs.
The surpass of the weekly high of 1.0998 (January 5) should encourage EUR/USD to revisit the December 2023 peak of 1.1139 (December 27), which is also supported by the 200-week SMA at 1.1150, both of which precede the 2023 top of 1.1275 (July 18). Having said that, the loss of the 2024 low of 1.0892 (January 3), could put a test of the key 200-day SMA of 1.0845 back on the radar ahead of the transitory 55-day SMA of 1.0839, all before the December 2023 bottom of 1.0723 (December 8). If the latter is broken, a visit to the weekly low of 1.0495 (October 13, 2023) before the 2023 low of 1.0448 (October 3) and the round level of 1.0400 may occur. The everyday RSI receded to the proximity of 50.
Resistance levels: 1.0998 1.1009 1.1139 (4H chart)
Support levels: 1.0892 1.0888 1.0723 (4H chart)
USDJPY
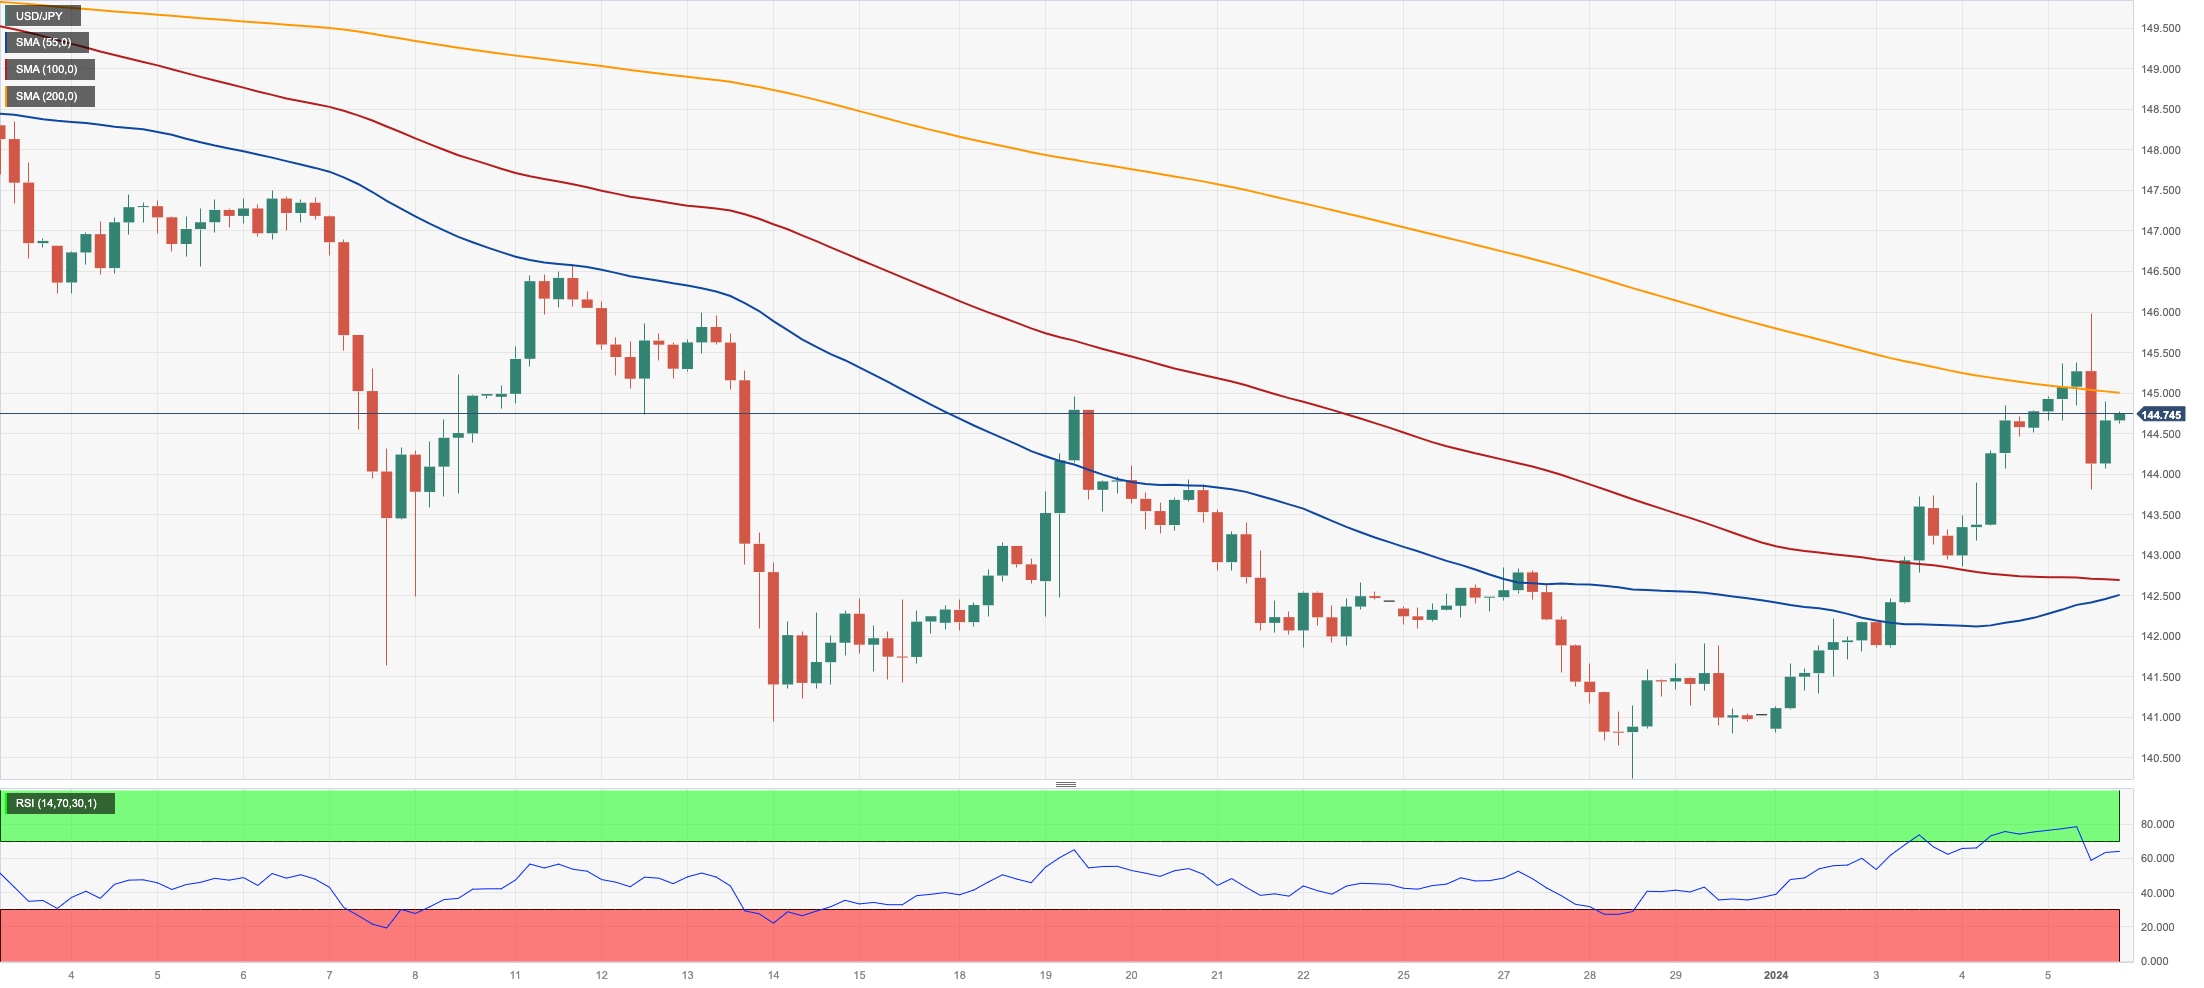
Following a sharp increase to a new three-week high around 146.00, USD/JPY lost some shine along with the retracement in the greenback, all resulting in spot ending Friday’s session near 144.80.
The fourth daily advance in the pair came on the back of the irresolute price action in the dollar, along with another positive session in US yields across the board.
In the Japanese docket, the final Jibun Bank Services PMI rose to 51.5 in December, and Consumer Confidence improved to 37.2 in the same period.
If the buying interest persists, USD/JPY may retest the so far 2024 high of 145.97 (January 5) before testing the temporary 55-day SMA of 147.08. The critical 150.00 barrier appears north of here, prior to the 2023 top of 151.90 (November 13), the 2022 peak of 151.94 (October 21), and the round figure of 152.00. Just the opposite, a break below the December 2023 low of 140.24 (December 28) will expose the round level of 140.00 before the July 2023 low of 137.23 (July 14) and the March 2023 low of 129.63 (March 24). The daily RSI looked stable just below 53.
Resistance levels: 145.97 146.58 147.49 (4H chart)
Support levels: 143.80 140.24 138.05 (4H chart)
GBPUSD
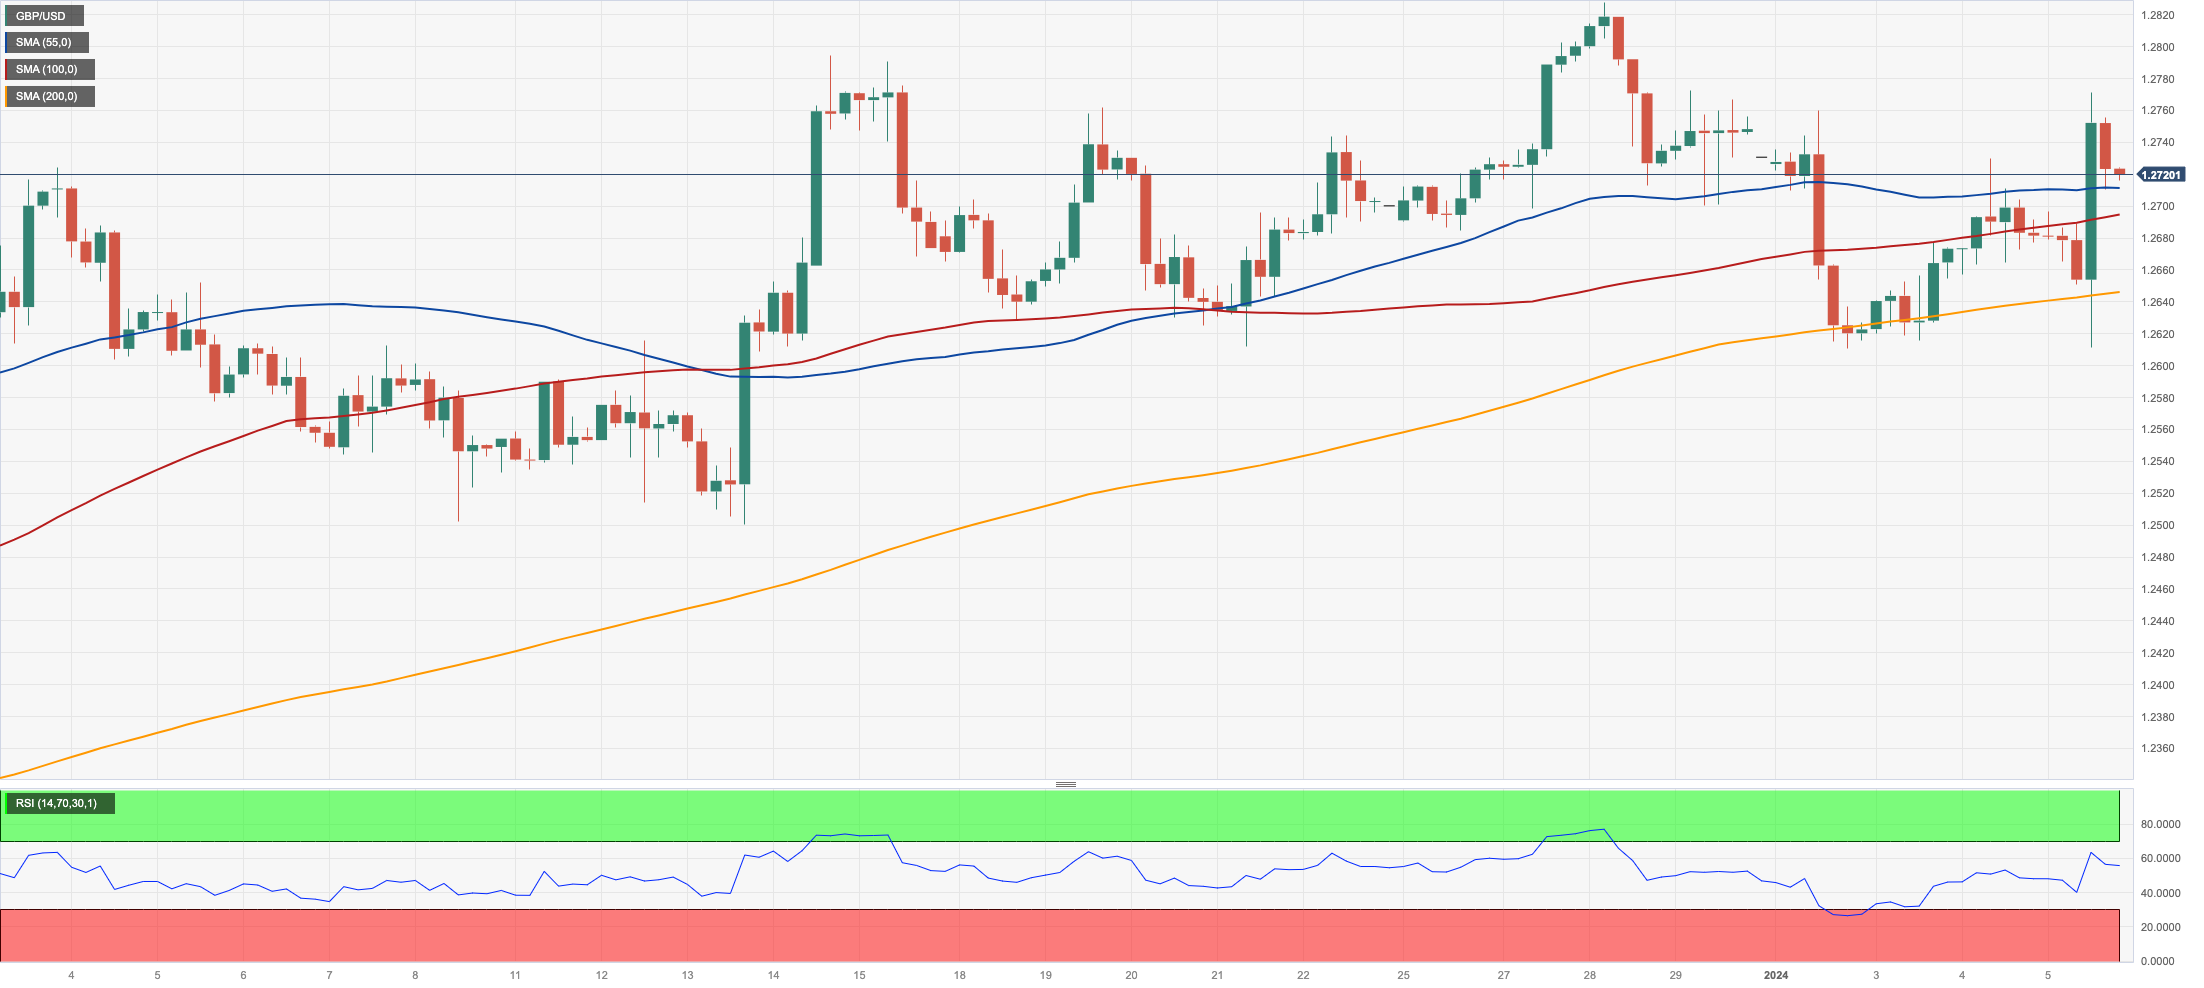
GBP/USD rose for the third consecutive session, this time reaching fresh four-day highs near 1.2770, although ending the session around 1.2720 and closing the week with tepid losses after three consecutive advances.
The persistent optimism around the British pound came on the back of the vacillating price action in the greenback and firm results from the UK docket, where the Construction PMI improved to 46.8 in December, New Car Sales expanded 9.8% YoY in the same month, and house prices tracked by Halifax rose 1.1% MoM at the end of 2023 and 1.7% from a year earlier.
In the UK debt market, 10-year gilt yields remained on the rise, flirting with the 3.85% level.
If the recovery continues, GBP/USD may revisit the December 2023 high of 1.2827 (December 28), followed by the weekly top of 1.2995 (July 27 2023), which is just over the critical 1.3000 threshold. On the downside, a break below the so-far 2024 low of 1.2610 (January 2) may cause the pair to test the crucial 200-day SMA at 1.2532 before the December 2023 low of 1.2500 (December 13) and the intermediate 55-day SMA at 1.2485. The latter is broken down to show a weekly low of 1.2187 (November 10 2023), which comes before the October 2023 low of 1.2037 (October 3), the crucial 1.2000 mark, and the 2023 bottom of 1.1802 (March 8). The daily RSI climbed to the boundaries of 56.
Resistance levels: 1.2771 1.2827 1.2995 (4H chart)
Support levels: 1.2610 1.2500 1.2373 (4H chart)
AUDUSD
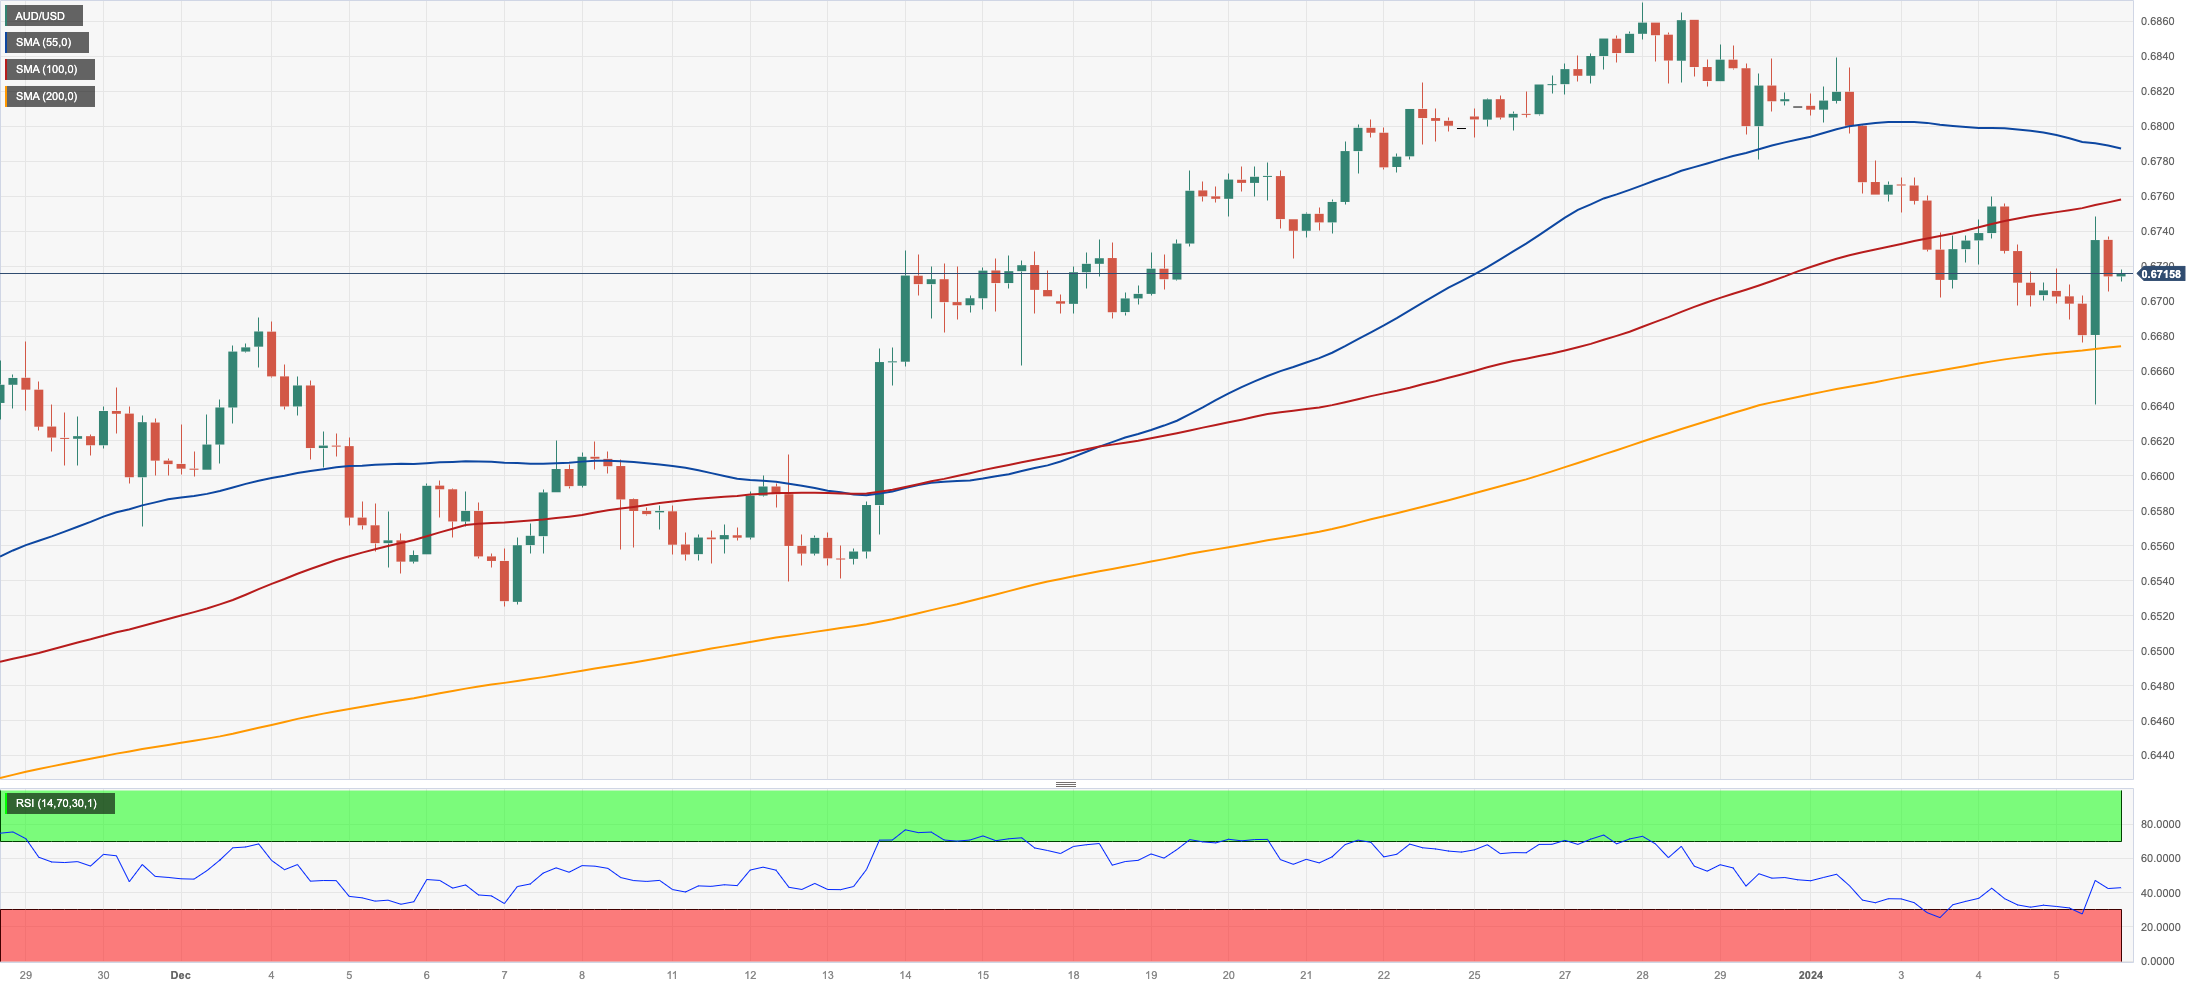
The Aussie dollar managed to regain some balance soon after the NFP-driven pullback to a new three-week low around 0.6640 vs. the greenback, eventually reclaiming the 0.6700 barrier and beyond.
That said, AUD/USD saw its multi-session decline come to a halt, despite the sharply negative weekly performance.
The marginal gains in the pair were also accompanied by the persistent pessimism in the commodity universe, where both copper prices and iron ore shed ground.
There were no data releases scheduled for Oz on Friday.
Further weakness could prompt AUD/USD to retest the 2024 low of 0.6640 (January 5) in the near term. The loss of this level could spark a drop to the 200-day SMA of 0.6582 ahead of the December 2023 bottom of 0.6525 (December 7), which comes before the 2023 low of 0.6270 (October 26) and the round level of 0.6200, all prior to the 2022 low of 0.6169 (October 13). On the other hand, a breakout of the December 2023 high of 0.6871 (December 28) might open the way for a journey to the July 2023 top of 0.6894 (July 14) and the June 2023 peak of 0.6899 (June 16), both of which are positioned just before the crucial 0.7000 yardstick. The daily RSI rebounded a tad past 52.
Resistance levels: 0.6759 0.6871 0.6894 (4H chart)
Support levels: 0.6640 0.6539 0.6525 (4H chart)
GOLD
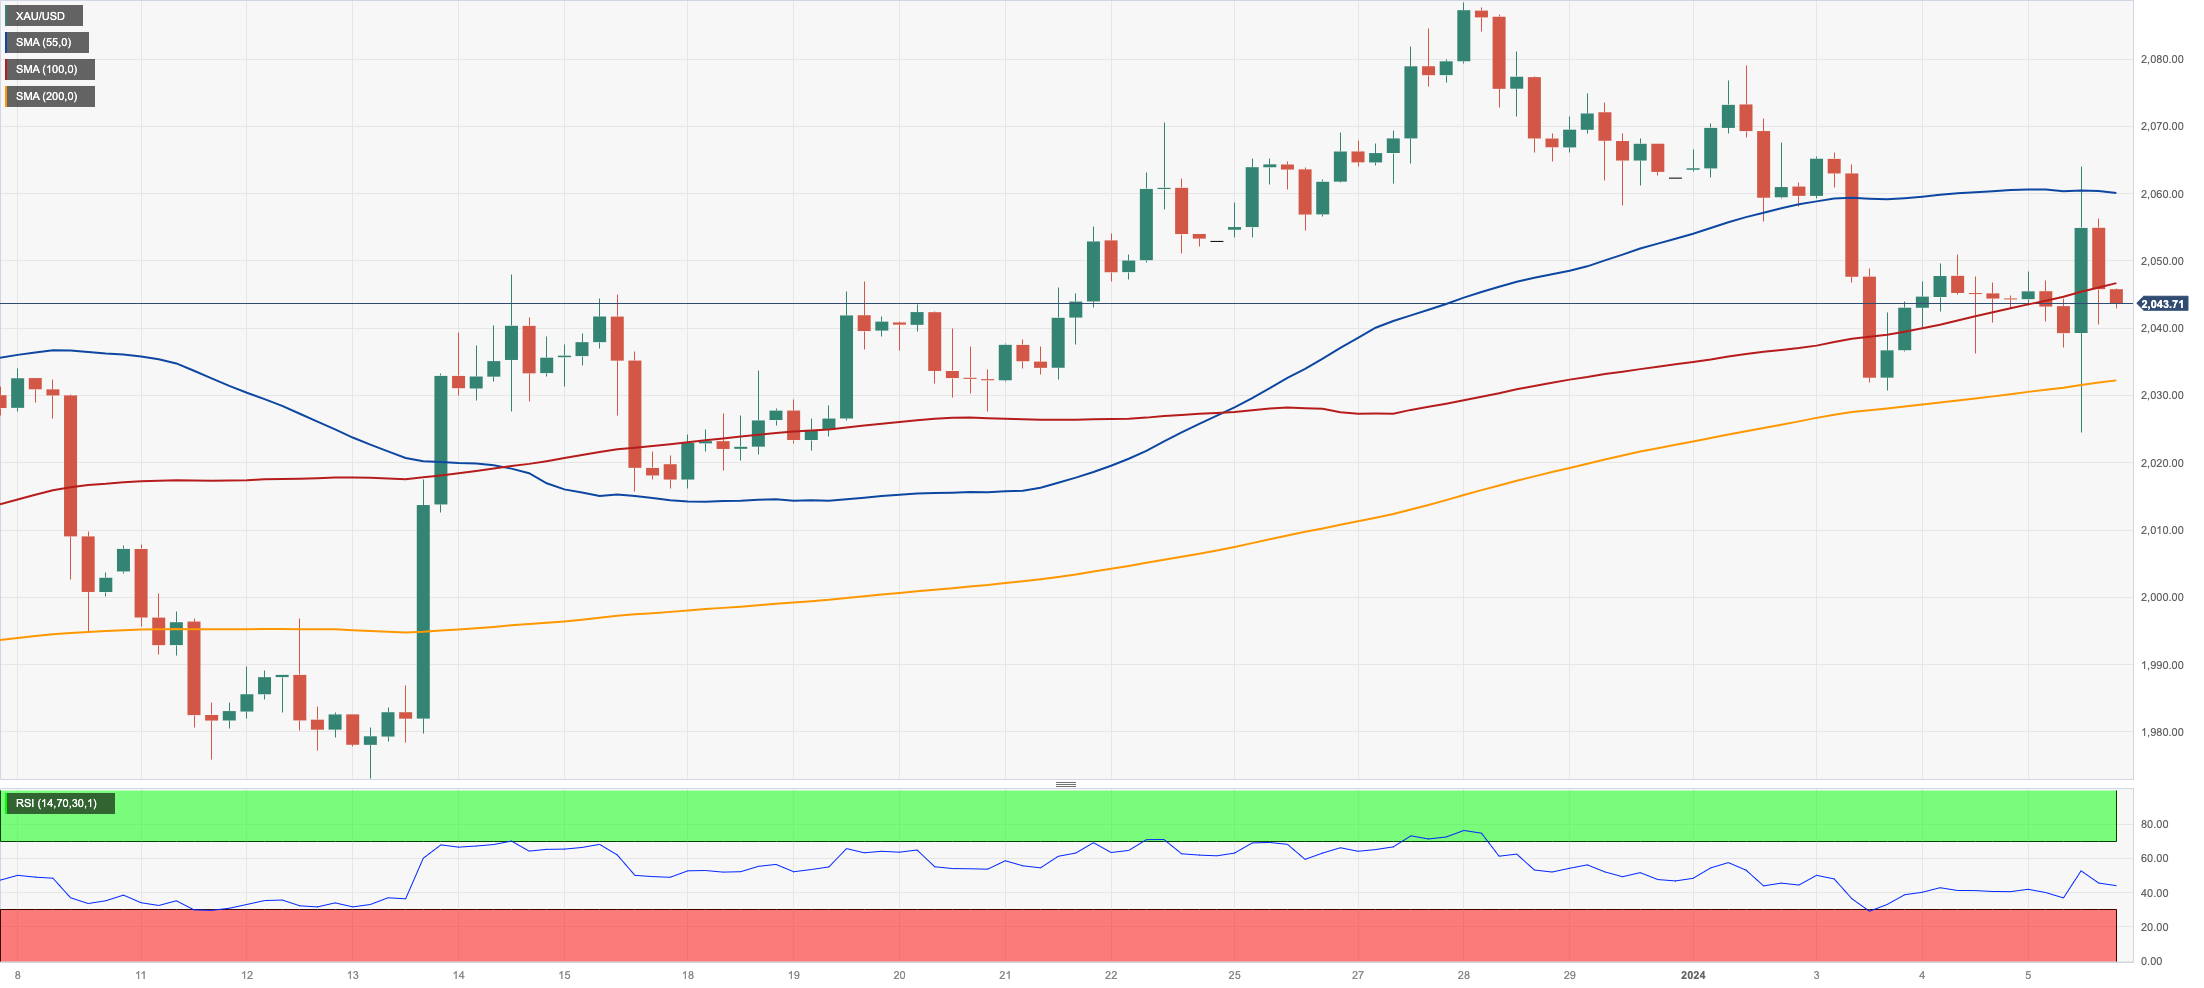
Gold prices ended Friday’s session in the middle of the daily range, near $2040 per troy ounce, following a volatile trading day.
Indeed, the yellow metal finished barely unchanged on the back of a lacklustre move higher in the dollar and the continuation of the upside momentum in US yields across different maturities.
Meanwhile, the macro scenario for the precious metal appears unchanged against the backdrop of a solid conviction of rate cuts by the Fed (most likely) in March, while the next risk event emerges along with the release of US CPI next week.
The loss of the 2024 low of $2024 (January 5) could drag gold prices to the interim 55-day SMA at $2007 prior to the key contention zone around $2000. The breakdown of this region reveals the possibility of a slide to the December 2023 low of $1973 (December 13), ahead of the 200-day SMA of $1962 and the November 2023 low of $1931 (November 13). South of here, the October 2023 low of $1810 (October 6), the February 28th 2023 low of $1804, and, finally, the critical $1800 support region may be observed. On the contrary, the next level of resistance aligns at the weekly high of $2088 (December 28), seconded by the all-time top of $2150 (December 4 2023).
Resistance levels: $2064 $2078 $2088 (4H chart)
Support levels: $2024 $2015 $1973 (4H chart)
CRUDE WTI
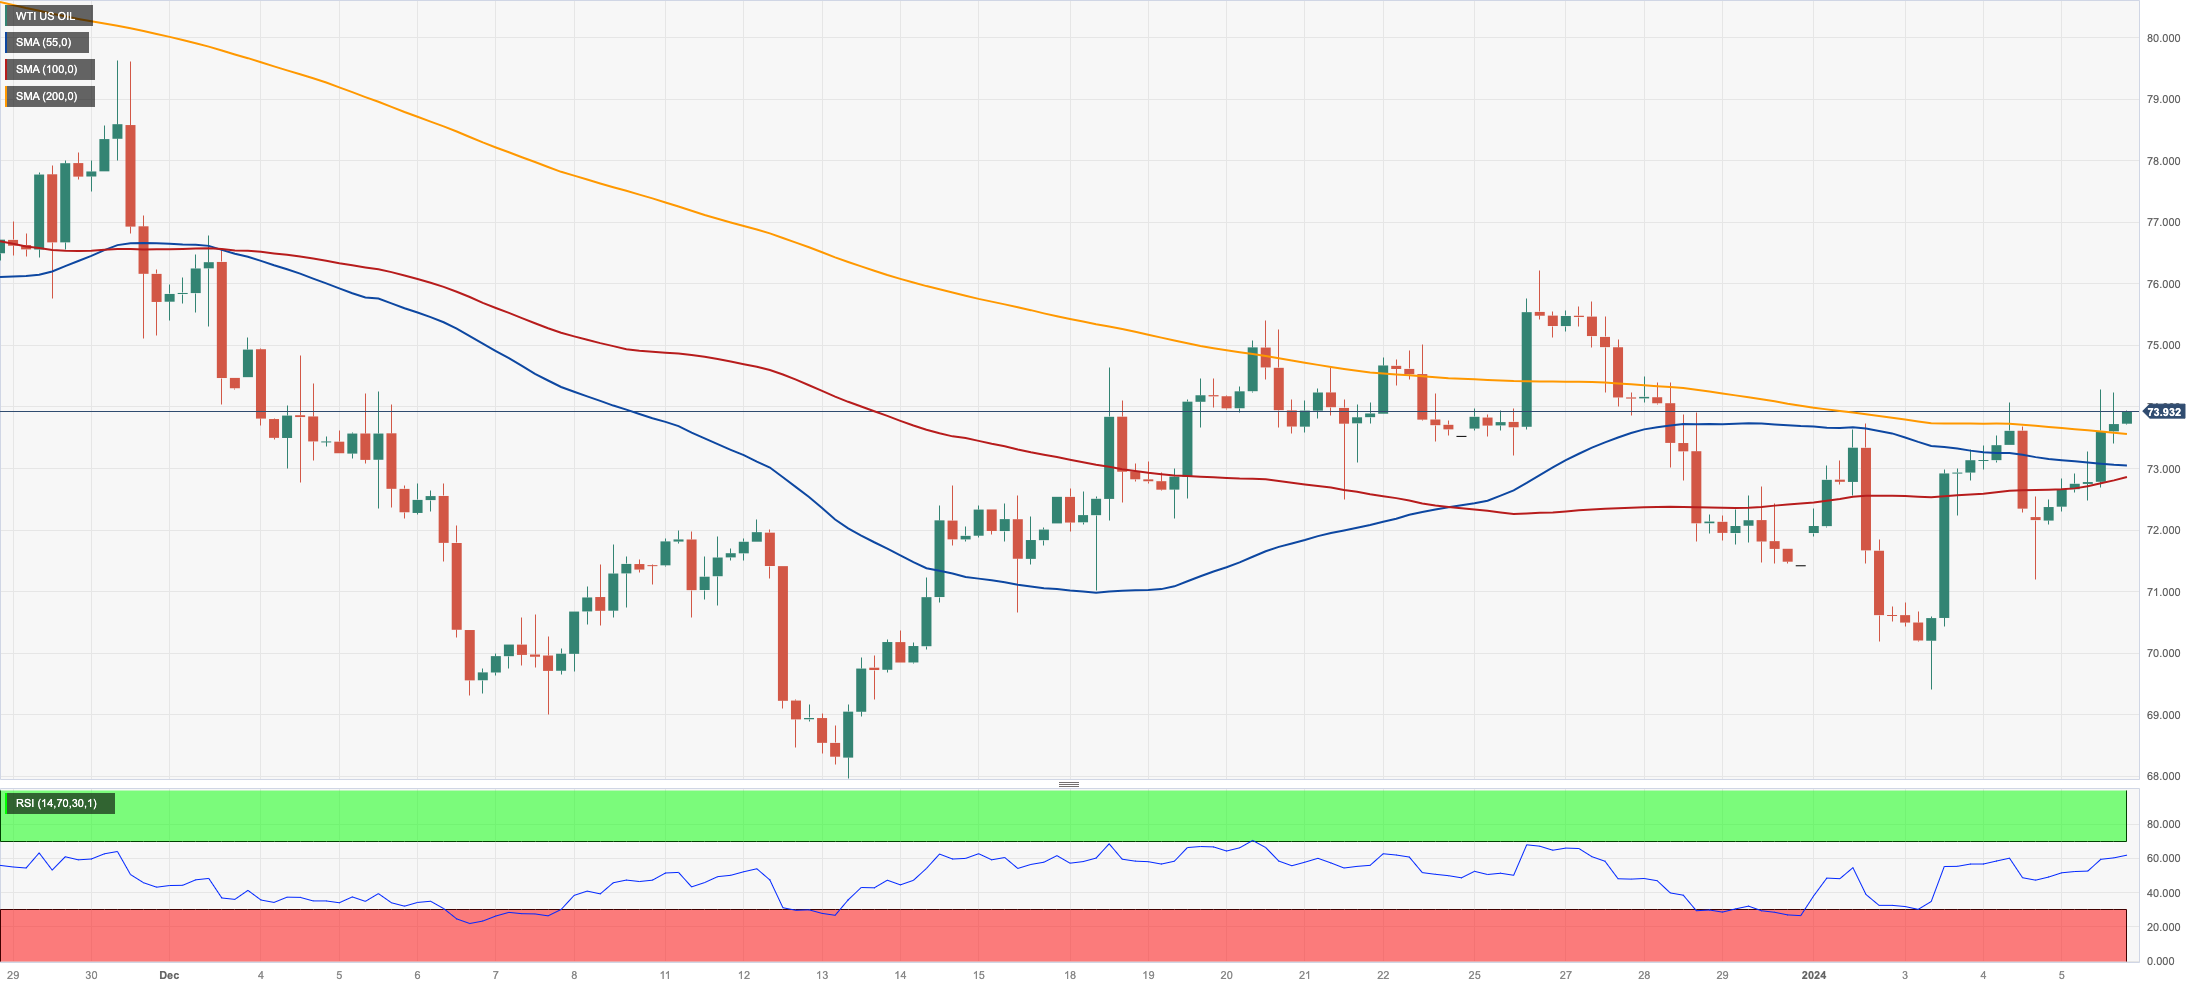
WTI prices resumed the upside and closed a positive first week of the year on Friday, advancing to multi-day highs north of the $74.00 mark per barrel.
The daily uptick in crude oil followed persevering effervescence in the Middle East, where the Israel-Hamas conflict threatens to spread to neighbouring regions, and the supply disruption spectre continues to hover around the Red Sea.
Somewhat limiting the upside potential appears to have raised some concerns regarding the likelihood that the Fed might delay its (March?) rate cut, as per the stronger-than-expected Payrolls seen in December.
Closing the docket, the US total active oil rig count went up by 1 to 501 in the week to January 5, according to driller Baker Hughes.
Next on the upside for WTI emerges the weekly top of $76.14 (December 26 2023), before the major 200-day SMA at $77.89, the critical $80.00 barrier, and the November 2023 peak of $80.15 (November 3). Further gains from here may take the market back to its weekly high of $89.83 (October 18 2023), ahead of the 2023 top of $94.99 (September 28 2023) and the August 2022 peak of $97.65 (August 30), all before the crucial $100.00 mark. On the flip side, the breach of the YTD low of $69.31 (January 3) could pave the way for a deeper decline to the December 2023 low of $67.74 (December 13) ahead of the June 2023 low of $66.85 (June 12) and the 2023 bottom of $63.61 (May 4). Down from here aligns the crucial $60.00 support.
Resistance levels: $74.20 $76.14 $79.56 (4H chart)
Support levels: $71.03 $69.25 $67.68 (4H chart)
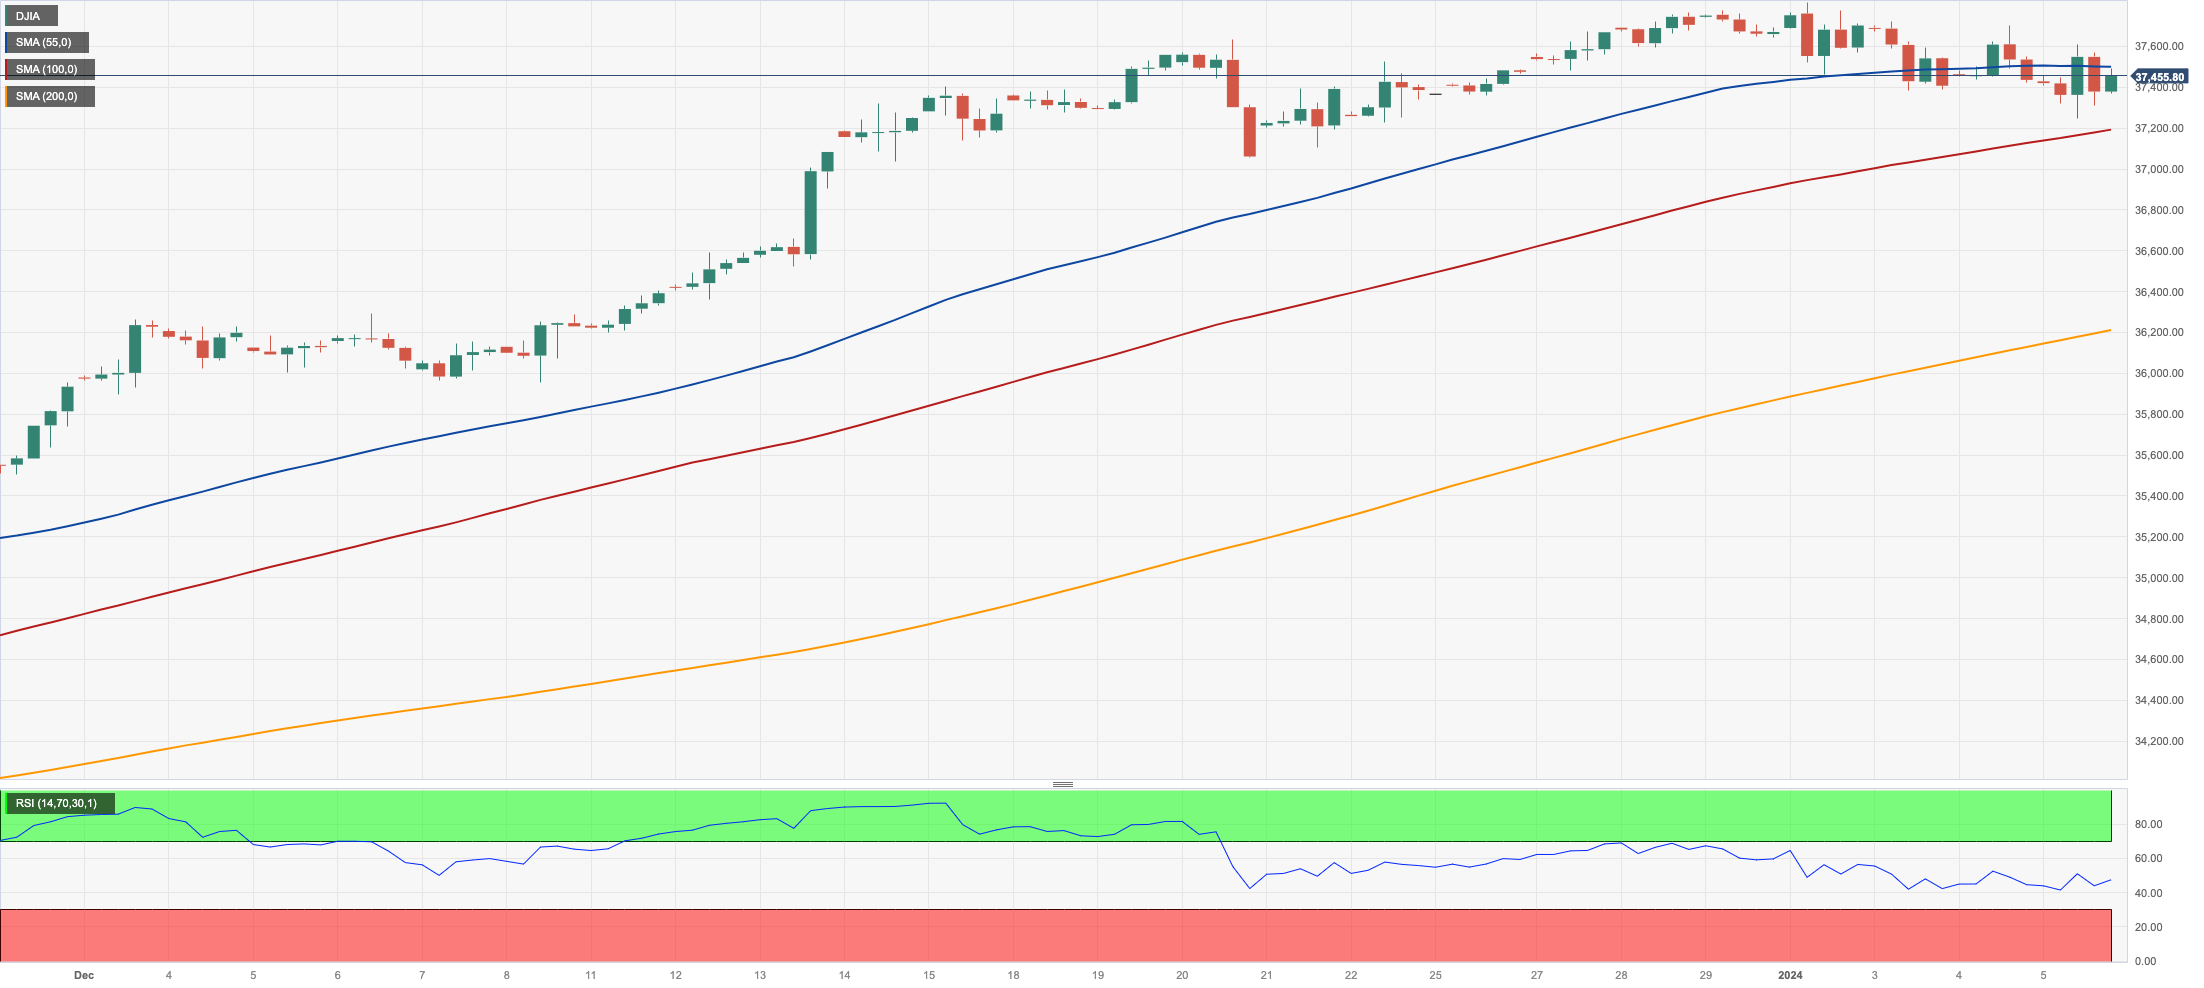
DOW JONES
US stocks tracked by the Dow Jones charted another inconclusive session on Friday, this time hovering around the 37500 area and closing with weekly losses for the first time after an impressive nine-week positive streak.
Meanwhile, market participants maintained their optimism well in place after stimulating readings from the Nonfarm Payrolls in December, where the economy added 216K jobs, pouring cold water at the same time over hot expectations of rate cuts by the Fed in Q2.
On Friday, the Dow Jones rose 0.07% to 37466, the S&P500 advanced 0.17% to 4696, and the tech-benchmark Nasdaq Composite gained 0.09% to 14524.
If the bulls maintain control, the Dow will try to surpass its all-time high of 37790 (January 2). Immediate support in the opposite direction might be located at the weekly low of 37073 (December 20 2023), which is previous to the December 2023 low of 36010 (December 5), as well as the critical 200-day SMA at 34404. The weekly low of 33859 (November 7, 2023) comes before the October 2023 low of 32327 (October 27) and the 2023 low of 31429 (March 15). If this is broken, the 2022 low of 28660 may be challenged (October 13). The daily RSI eased from the overbought zone and approached 68.
Top Performers: Walgreen Boots, Verizon, Boeing
Worst Performers: UnitedHealth, IBM, McDonald’s
Resistance levels: 37790 (4H chart)
Support levels: 37073 36021 34855 (4H chart)
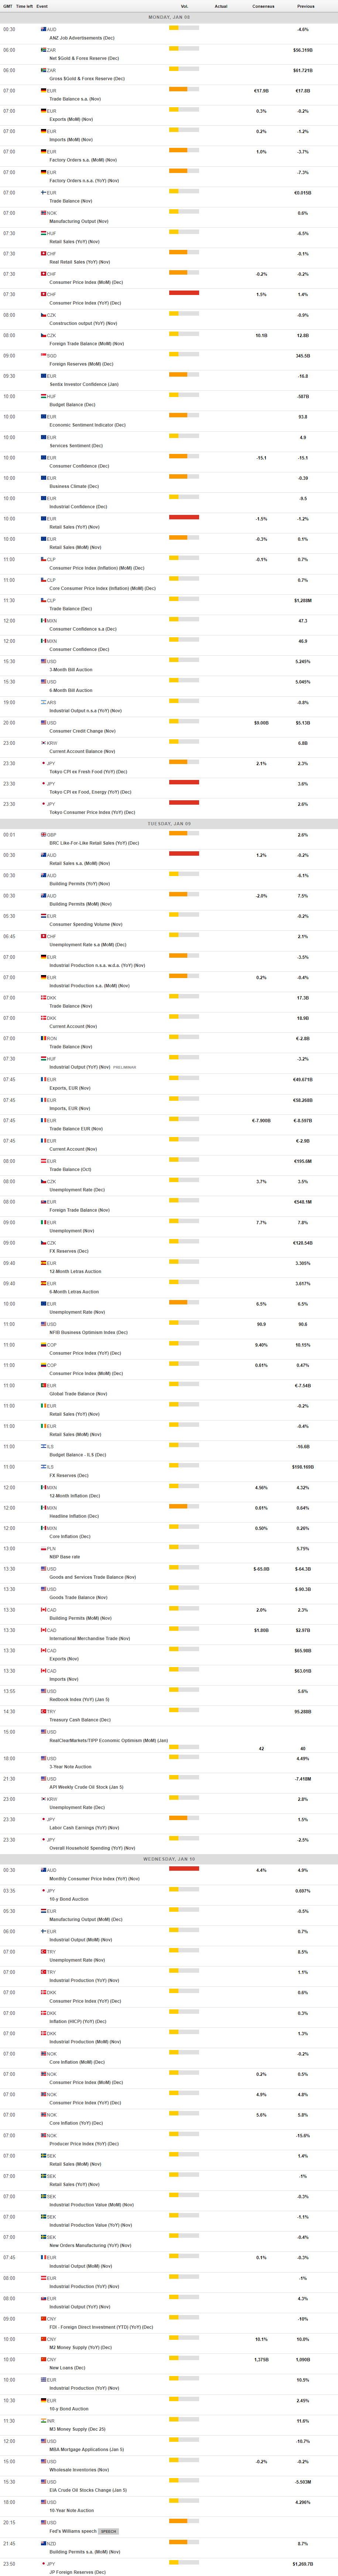
MACROECONOMIC EVENTS
All Information & Updates provided by:

All information relating to the financial markets available on this page has been prepared and issued by FXStreet (Forexstreet SL, Spain, Reg: B62498233) on the basis of publicly available information and all information believed to be reliable and does not conflict with Kuwaiti local laws, and all necessary care has been taken to before the company to ensure that the facts mentioned are correct from the source.
NCM Investment nor any of its directors or employees shall in any way be held responsible for the contents of this news, and the information contained on this page is intended only to provide clients with publicly available information and should not be construed as investment advice, report or analysis and/or constitute an offer or invitation to buy or sell financial instruments of any kind.
RISK WARNING: Forex and CFDs are highly risky leveraged products, as losses can exceed deposits. Please ensure you understand all the risks and take independent advice if necessary. NCM will segregate the clients based on the criteria of the regulator and its bylaws. NCM does not provide any advisory service; the material published does not constitute advice or a recommendation for a transaction in any financial instrument. NCM accepts no responsibility for any use of the content presented and any consequences of that use. Anyone acting on the information provided does so at their own risk.