
- Contact Us:
-

-

-

-


Daily Market Updates
09 Jan 2024
USDJPY
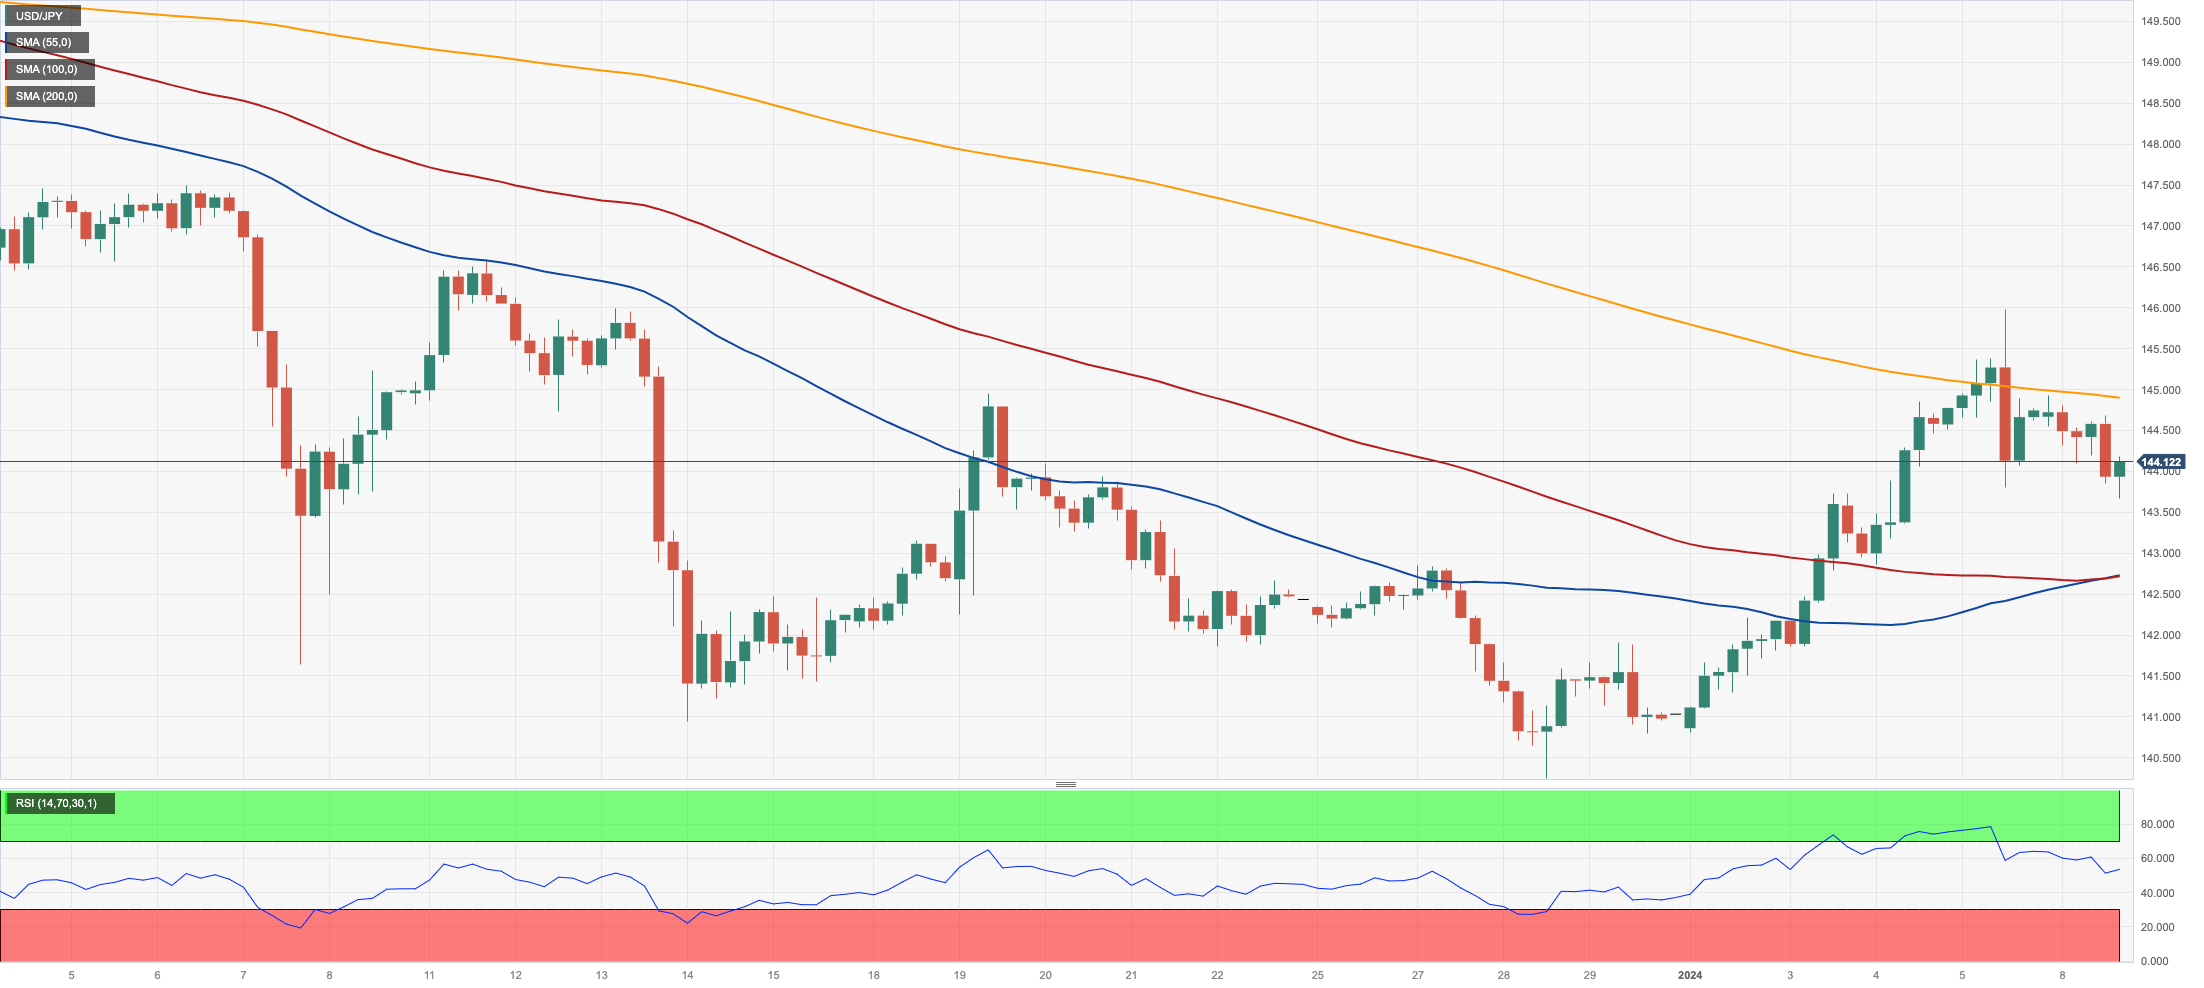
The negative start of the week in the greenback encouraged sellers to step in and maintain the selling bias unchanged around USD/JPY on Monday.
That said, the pair dropped markedly following Friday’s irresolute price action, testing two-day lows near 143.60 against the backdrop of the intense weakness in the dollar and declining US yields across the board.
The same developments in the Japanese money market saw the JGB 10-year yields recede further and revisit the 0.60% zone.
The Japanese docket was empty on Monday.
If the downside momentum continues, a break below the December 2023 low of 140.24 (December 28) will expose USD/JPY to the round level of 140.00 before the July 2023 low of 137.23 (July 14) and the March 2023 low of 129.63 (March 24). The other way around, extra gain face the next up-barrier at the so far 2024 high of 145.97 (January 5) before testing the temporary 55-day SMA of 146.97. The key 150.00 barrier emerges north of here, prior to the 2023 top of 151.90 (November 13), the 2022 peak of 151.94 (October 21), and the round figure of 152.00. The daily RSI seems retreated to the sub-50 area.
Resistance levels: 145.97 146.58 147.49 (4H chart)
Support levels: 143.66 140.24 138.05 (4H chart)
GBPUSD
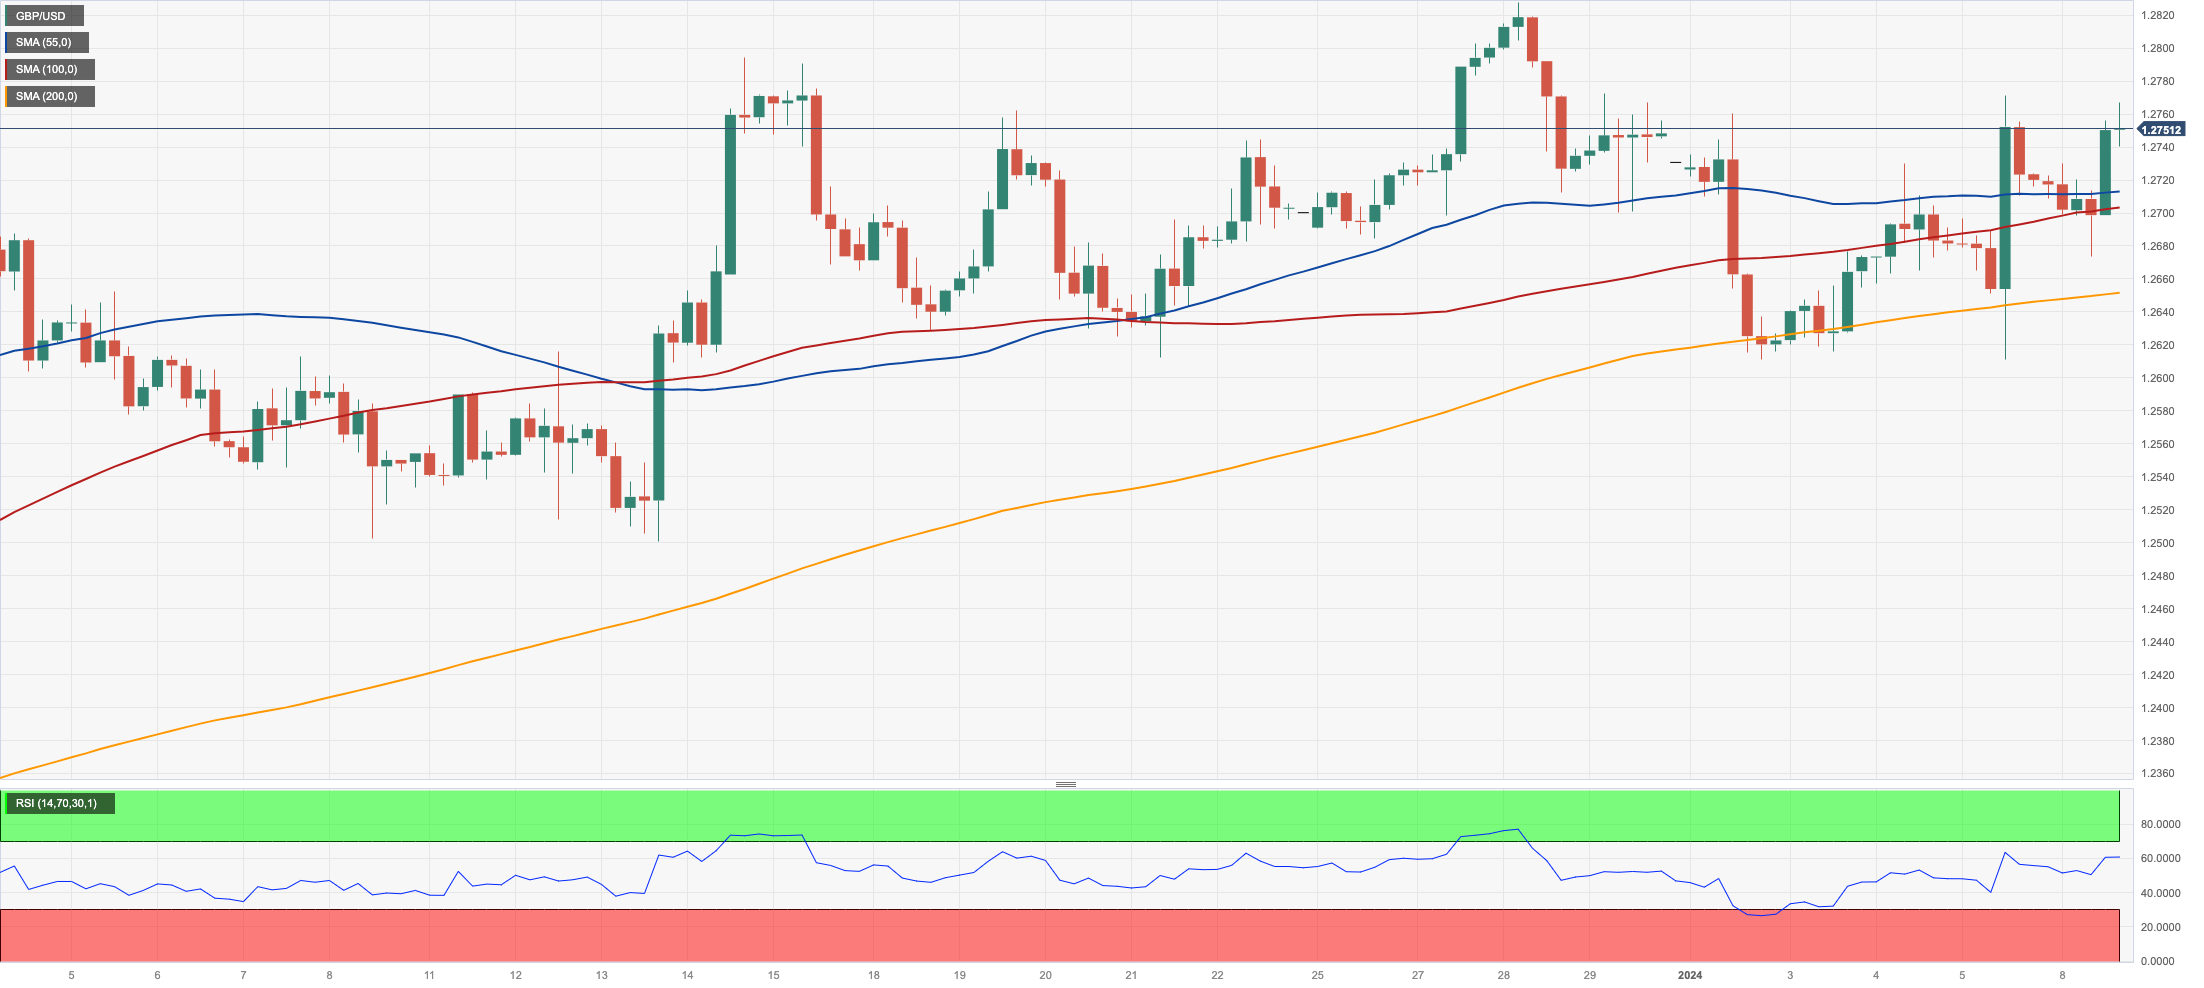
GBP/USD extended its upside bias for the fourth session in a row and revisited recent peaks near the 1.2770 zone on Monday.
Once again, the enduring positivity surrounding the British pound was fueled by the downward movement in the dollar and the generally favorable sentiment across risk-associated markets.
In the UK bond market, the upside momentum in the 10-year gilt yields appears to have taken a breather after two daily advances in a row.
There were no data releases scheduled across the Channel at the beginning of the week.
If the rebound continues, GBP/USD may revisit the December 2023 high of 1.2827 (December 28), followed by the weekly top of 1.2995 (July 27 2023), which is just over the key 1.3000 level. On the downside, a break below the so-far 2024 low of 1.2610 (January 2) may send the pair testing the 200-day SMA at 1.2534 before the December 2023 low of 1.2500 (December 13), which appears propped up by the intermediate 55-day SMA. The breakdown of this level reveals a weekly low of 1.2187 (November 10 2023), which comes before the October 2023 low of 1.2037 (October 3), the key 1.2000 level, and the 2023 bottom of 1.1802 (March 8). The daily RSI surpassed the bounds of 58.
Resistance levels: 1.2771 1.2827 1.2995 (4H chart)
Support levels: 1.2610 1.2500 1.2373 (4H chart)
AUDUSD
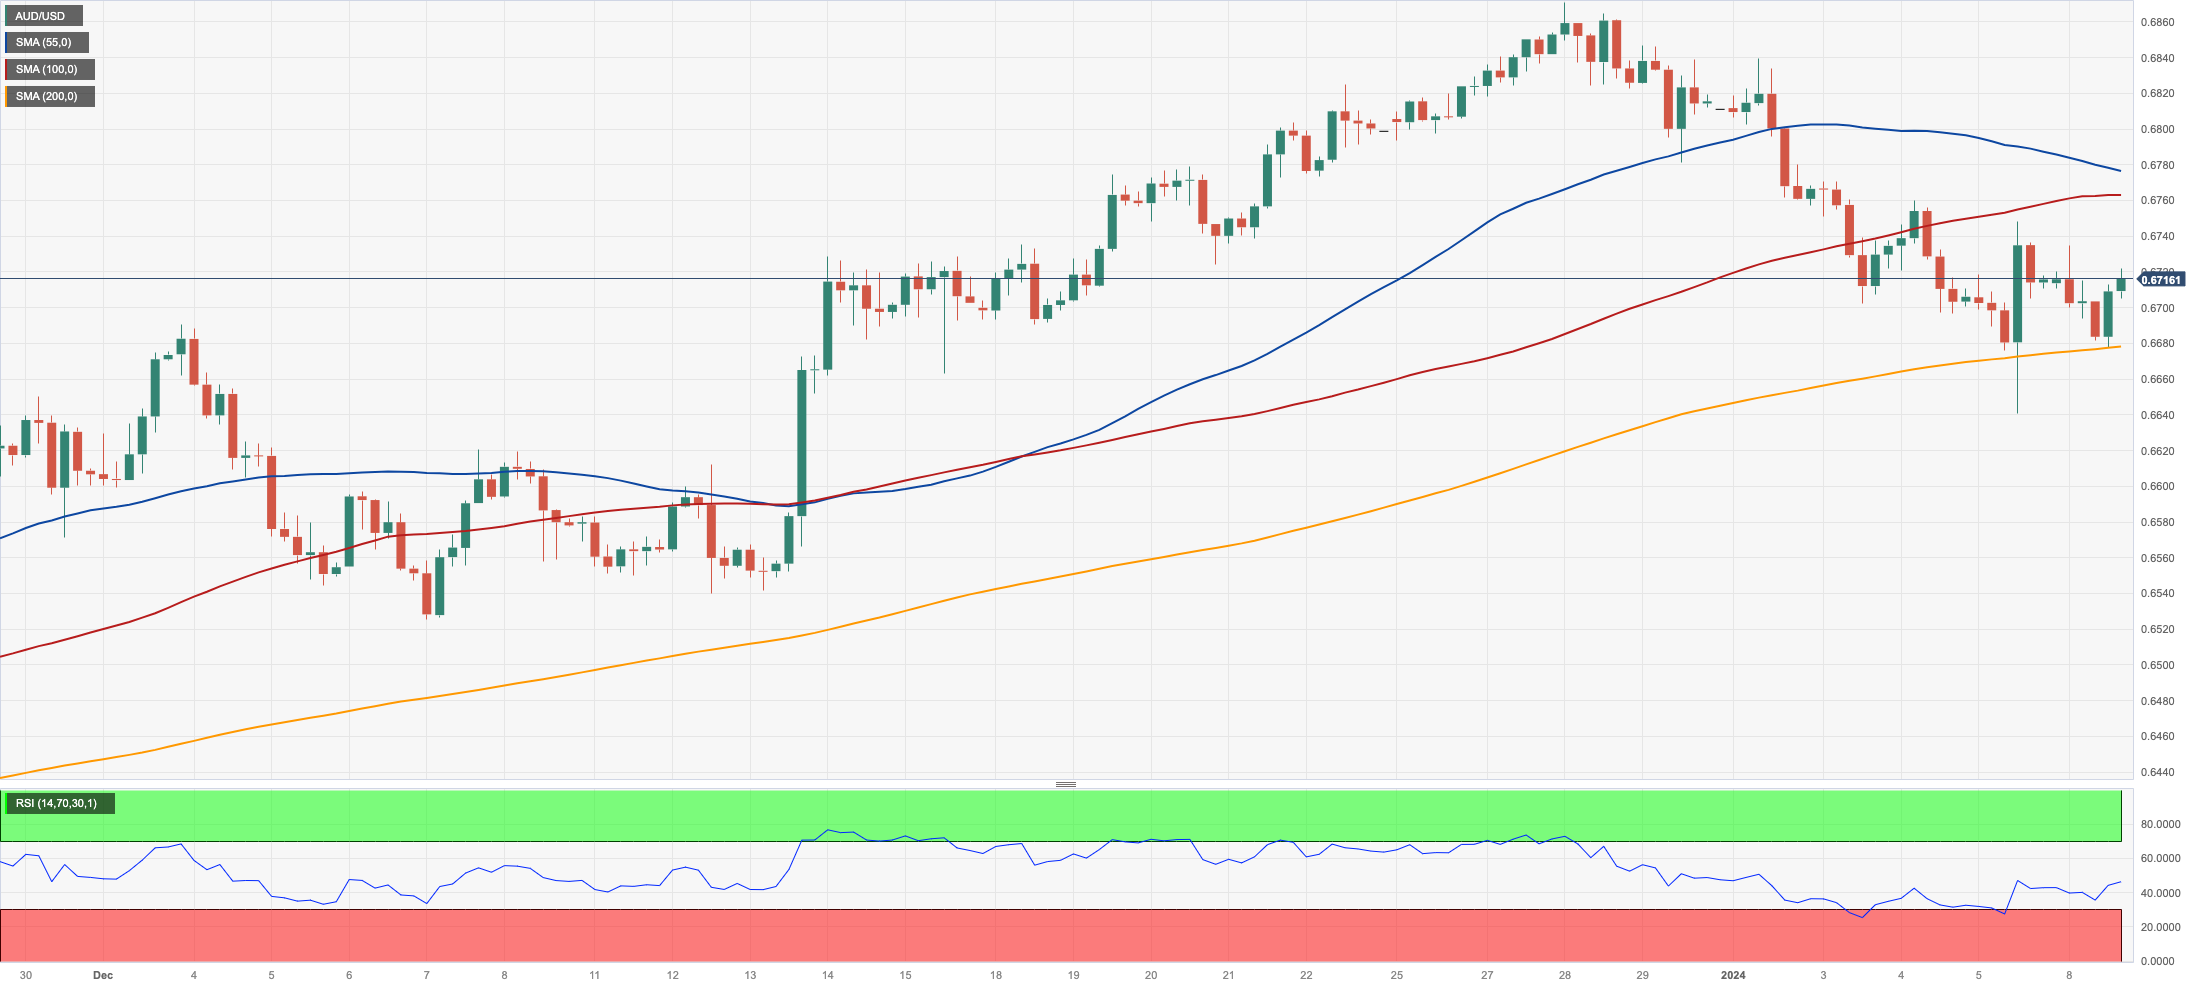
The marked selling pressure in the greenback favoured a lacklustre recovery in AUD/USD in the area beyond 0.6700 the figure at the beginning of the week.
That said, spot added to Friday’s small gains almost exclusively on dollar dynamics, while the Aussie dollar also managed to bypass another negative session in the commodity space as well as disheartening readings from Chinese stocks.
There were no data releases or events in Oz on Monday.
Further loss might drive the AUD/USD to revisit the 2024 low of 0.6640 (January 5) in the short future. The loss of this area may trigger a decline to the 200-day SMA of 0.6582 ahead of the December 2023 bottom of 0.6525 (December 7), which comes before the 2023 low of 0.6270 (October 26) and the round level of 0.6200, both of which are prior to the 2022 low of 0.6169 (October 13). On the contrary, a break above the December 2023 top of 0.6871 (December 28) might pave the way for a trip to the July 2023 peak of 0.6894 (July 14) and the June 2023 high of 0.6899 (June 16), both of which are located just before the critical 0.7000 yardstick. The daily RSI settled around the 52 zone.
Resistance levels: 0.6759 0.6871 0.6894 (4H chart)
Support levels: 0.6640 0.6539 0.6525 (4H chart)
GOLD
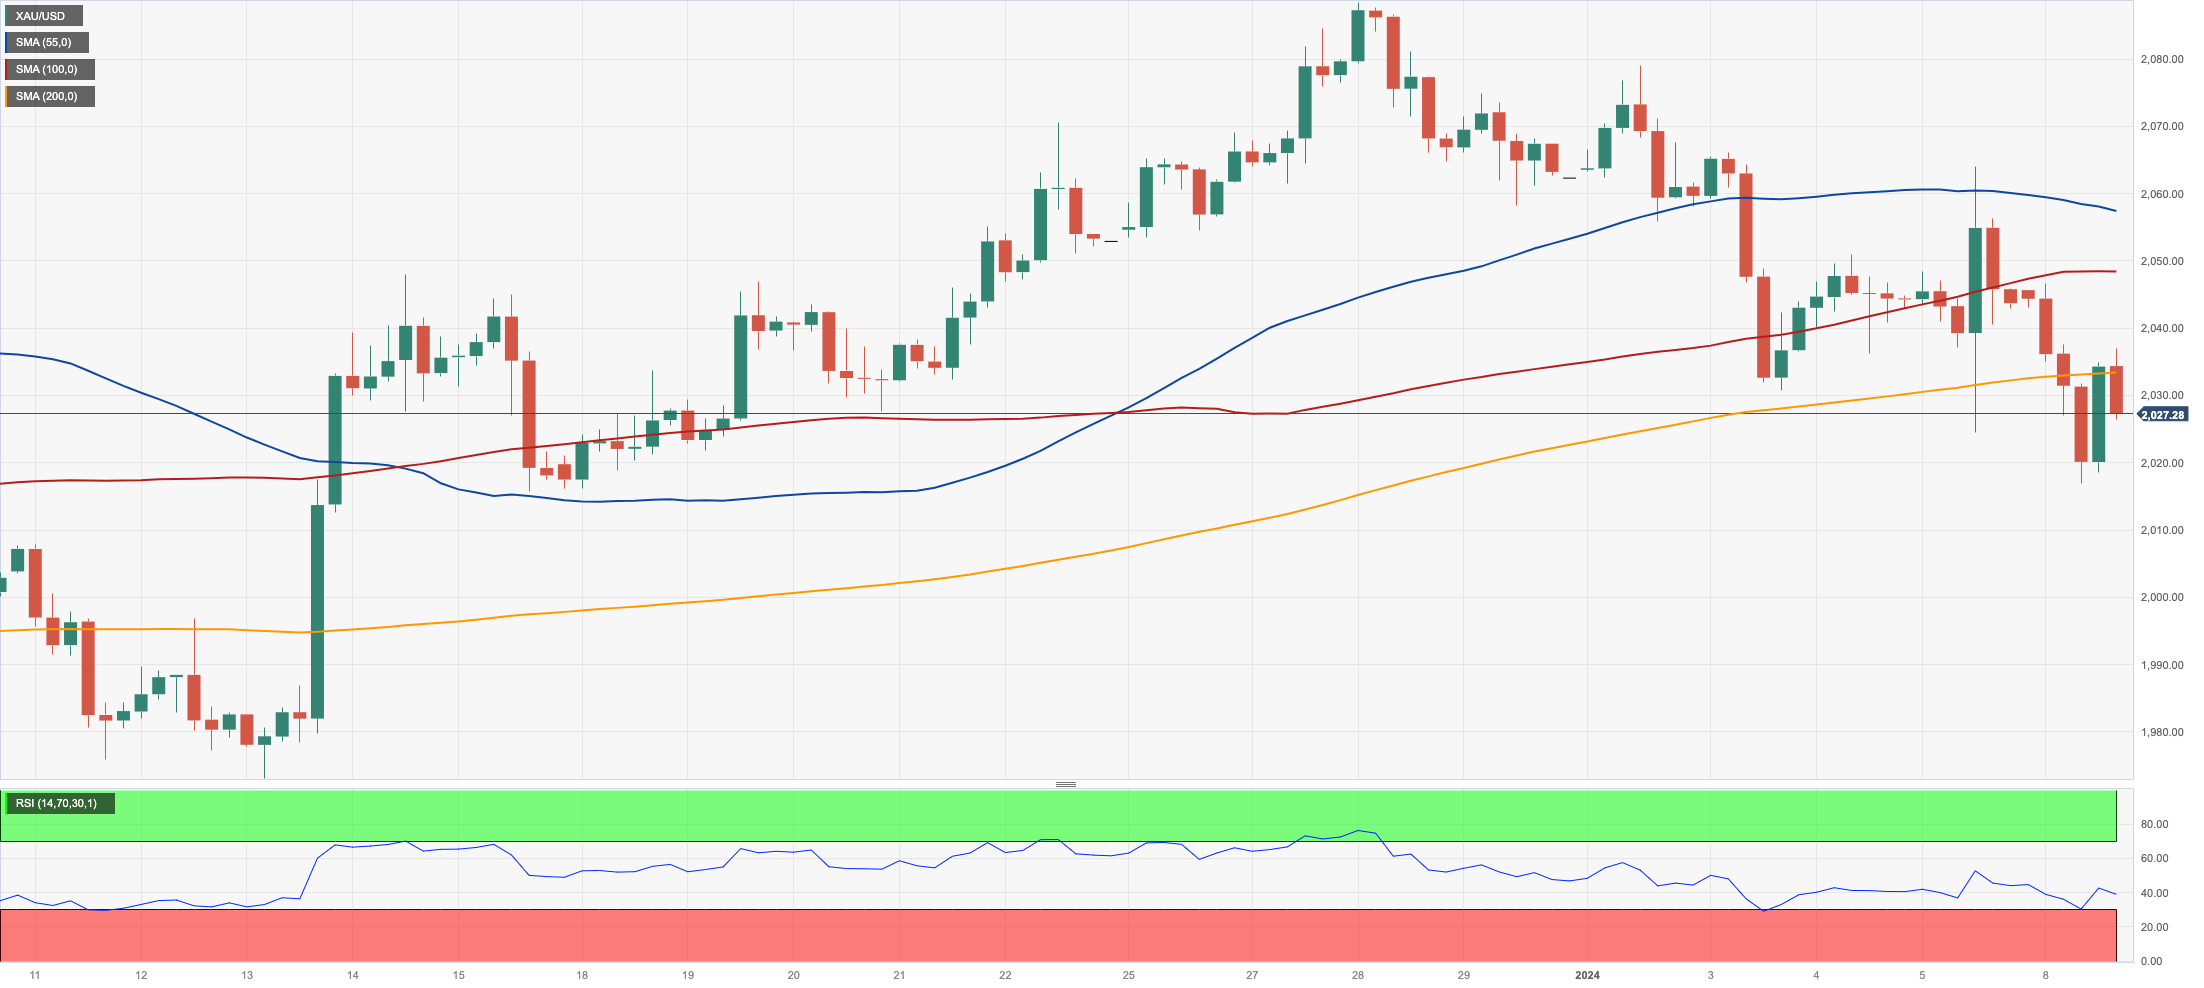
Gold prices charted a pronounced drop at the beginning of the week.
In fact, the price of the troy ounce of the yellow metal revisited the $2015 zone despite the soft tone in the greenback and the move lower in US yields across various maturities.
Friday’s stronger-than-expected US job creation seems to have reignited some concerns that the Fed might keep its restrictive stance for longer, while prudence also kicked in ahead of the release of key US inflation figures later in the week.
If the 2024 low of $2016 (January 8) is breached, gold prices may be dragged to the interim 55-day SMA at $2008, before to the important contention zone around $2000. The breakdown of this area suggests the probability of a drop to the December 2023 low of $1973 (December 13), which is ahead of the 200-day SMA of $1962 and the November 2023 low of $1931 (November 13). The October 2023 low of $1810 (October 6), the 2023 low of $1804 (February 28), and, ultimately, the important $1800 support zone can be seen south of here. The next level of resistance, on the other hand, is aligned at the weekly high of $2088 (December 28), followed by the all-time top of $2150 (December 4 2023).
Resistance levels: $2064 $2078 $2088 (4H chart)
Support levels: $2016 $1973 $1965 (4H chart)
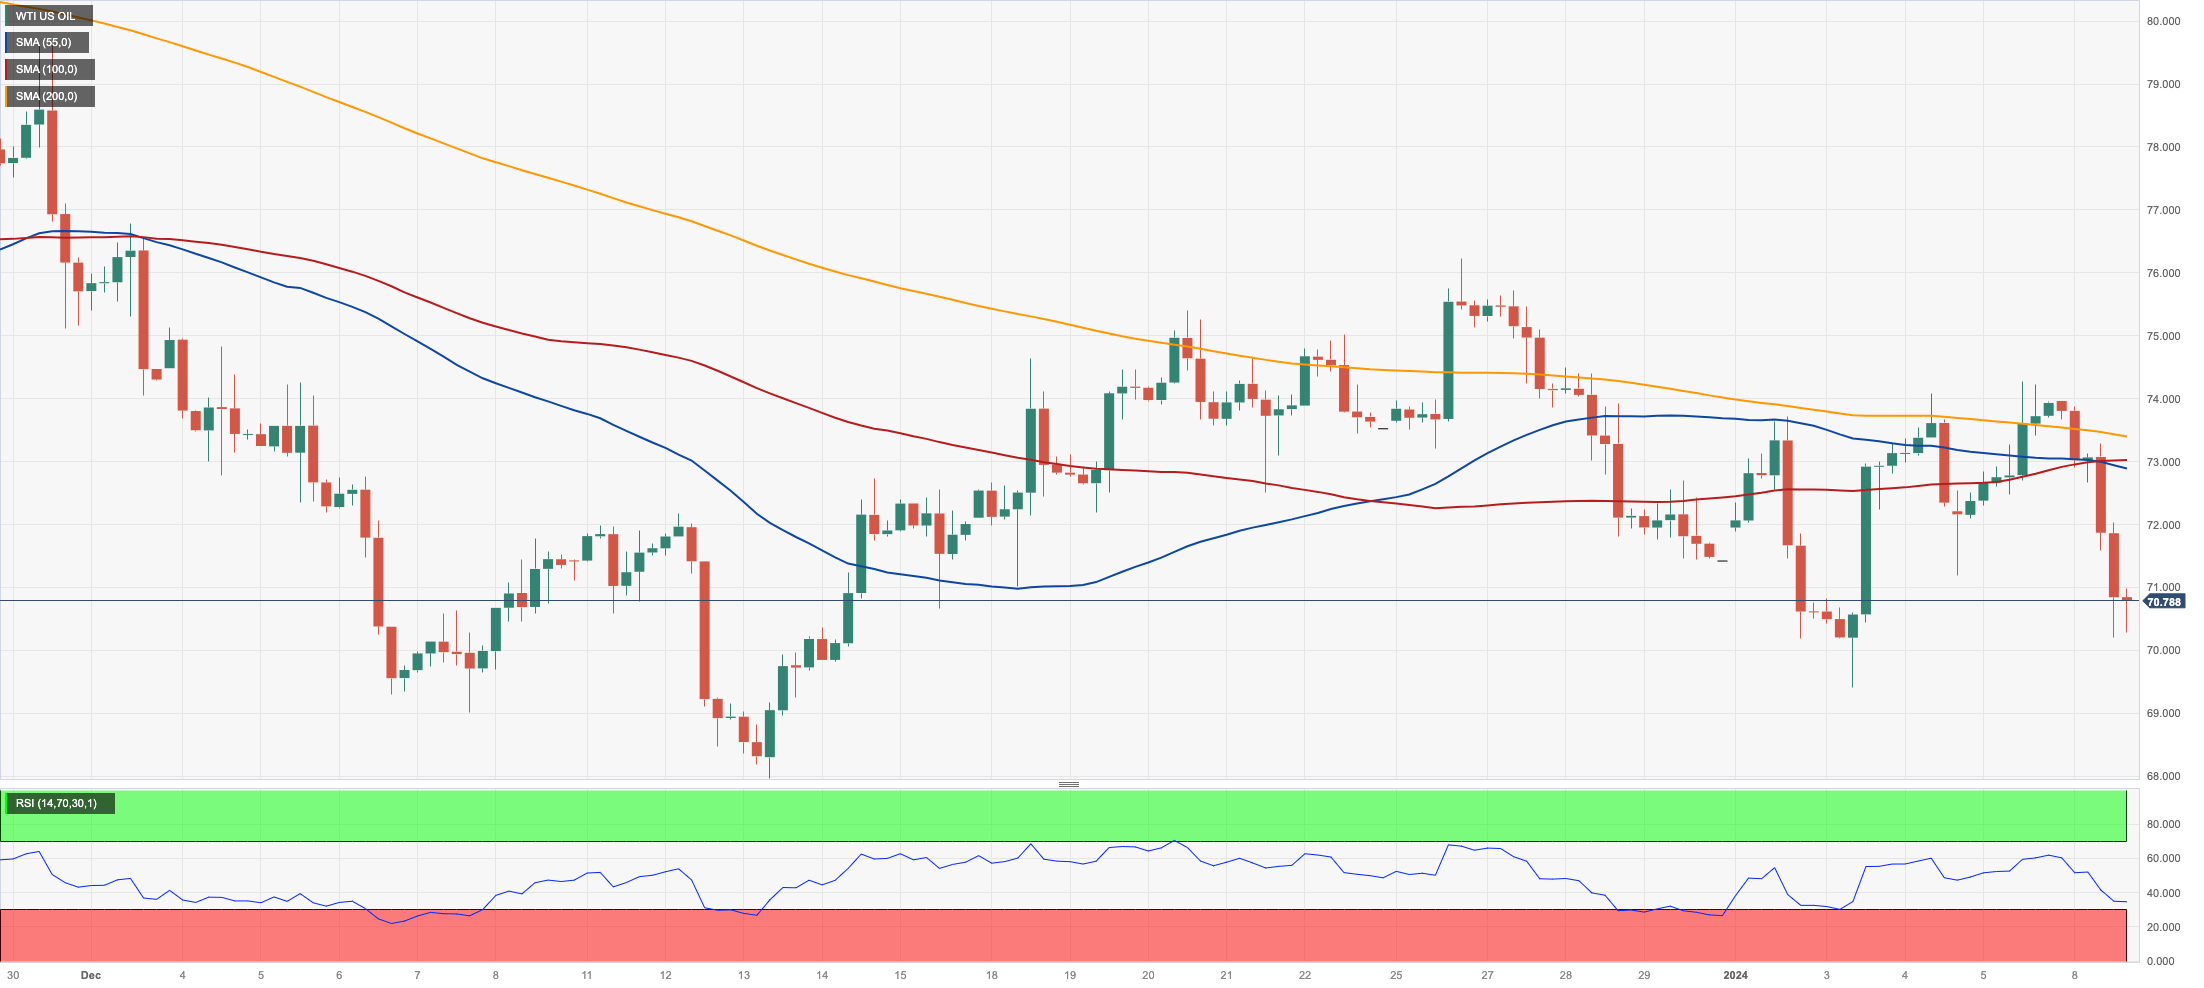
CRUDE WTI
Prices of the American reference for the sweet light crude oil plummeted to three-day lows near the key $70.00 mark per barrel at the beginning of the week.
In fact, crude oil prices faded Friday’s uptick after major player Saudi Arabia trimmed its crude price to Asian clients to nearly 30-month lows, eclipsing persevering geopolitical concerns in the Middle East and the still unabated effervescence in the Red Sea.
On the positive side for crude oil, force majeure has been declared at the Libyan Sharara oilfield over the weekend, which further reinforced the tight supply narrative.
It is worth noting that these two factors have been lending support to the commodity in the past few weeks.
The weekly high of $76.14 (December 26 2023) comes next for WTI, followed by the important 200-day SMA at $77.89, the critical $80.00 barrier, and the November 2023 peak of $80.15. (November 3). Further advances from here may return the market to its weekly high of $89.83 (October 18 2023), ahead of the 2023 high of $94.99 (September 28 2023) and the August 2022 peak of $97.65 (August 30), all before the critical $100.00 mark. On the other hand, a break of the YTD low of $69.31 (January 3) might open the door to a further slide to the December 2023 low of $67.74 (December 13), ahead of the June 2023 low of $66.85 (June 12) and the 2023 bottom of $63.61.
Resistance levels: $74.20 $76.14 $79.56 (4H chart)
Support levels: $70.16 $69.25 $67.68 (4H chart)
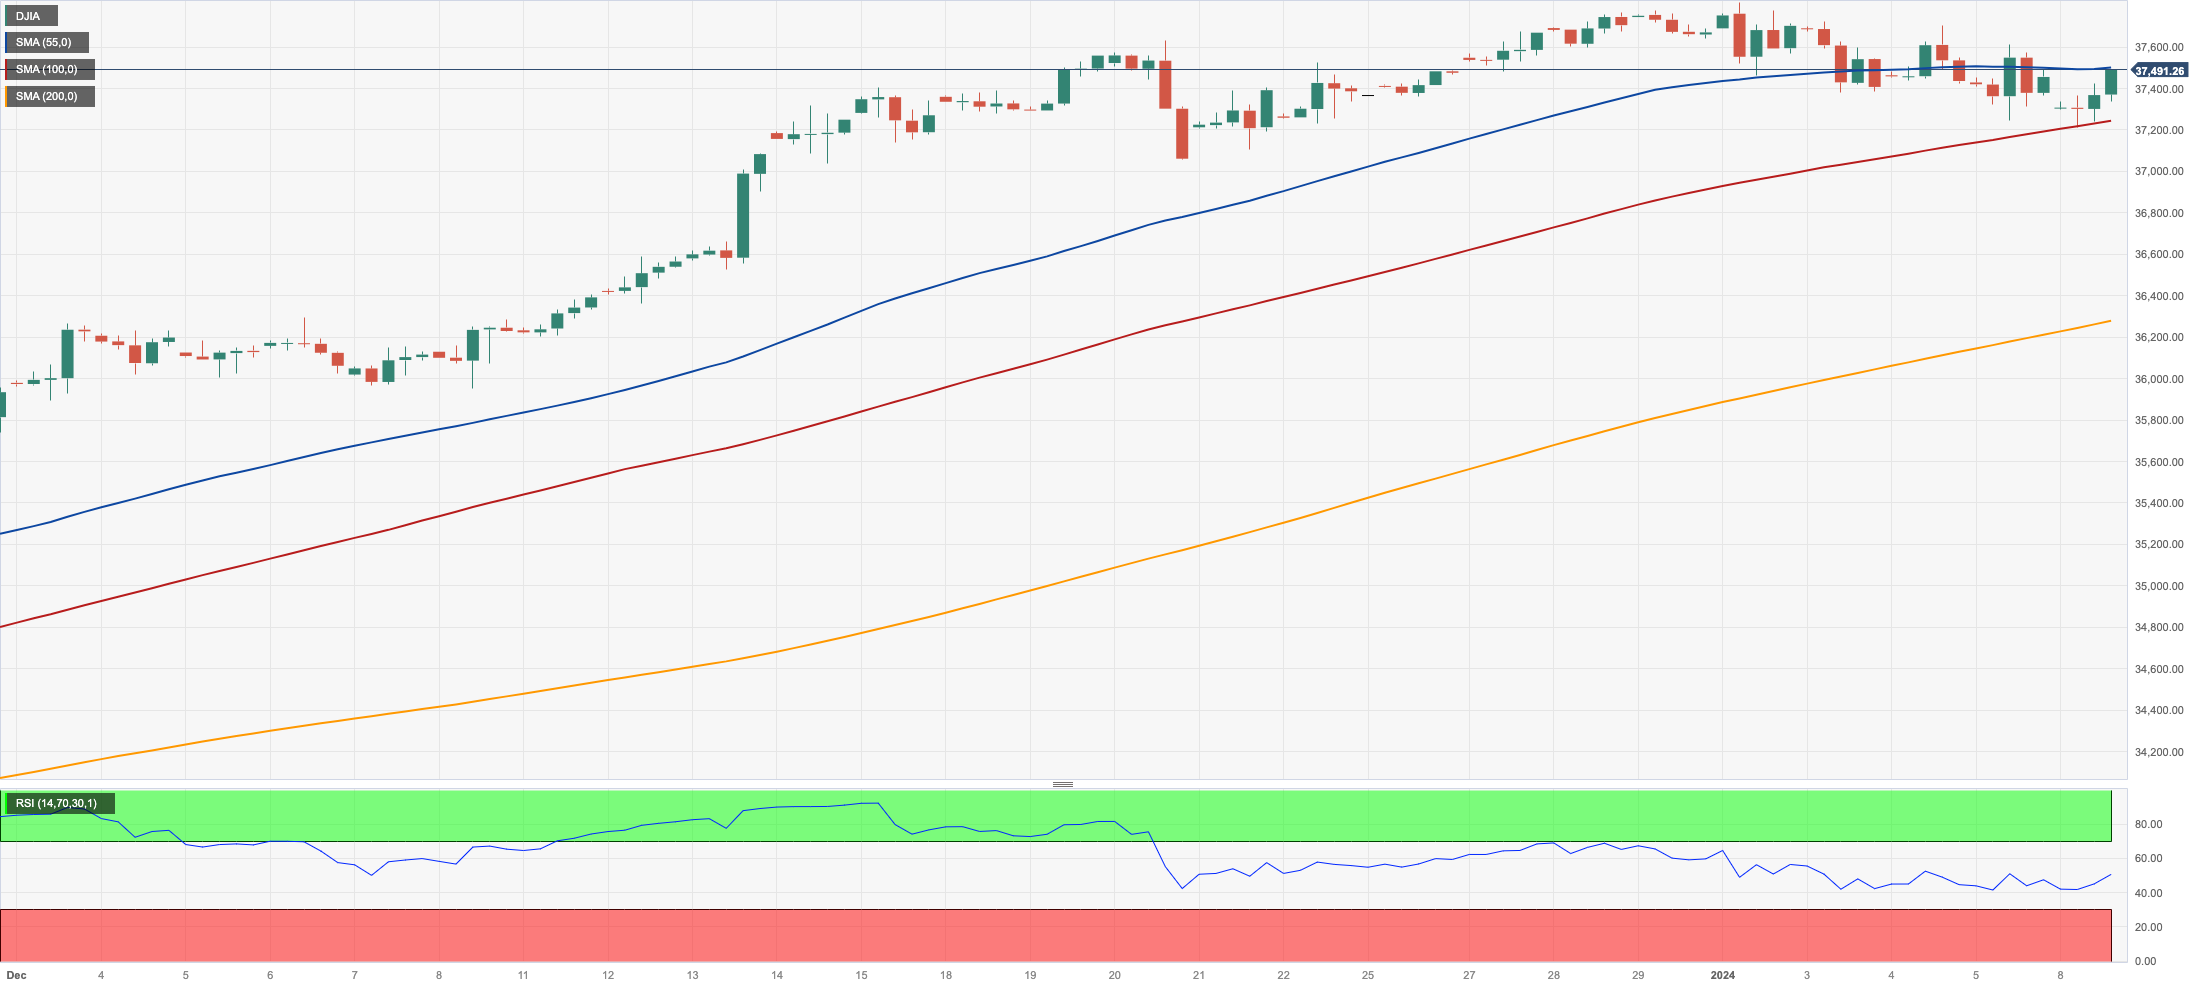
DOW JONES
US equities kicked off the week in a directionless mood near the 37500 zone when gauged by the benchmark Dow Jones.
In the meantime, investors maintained a cautious approach following stimulating readings from Friday’s Nonfarm Payrolls (+216K jobs) against the backdrop of increasing cautiousness in light of the publication of critical US inflation figures later in the week.
On Monday, the Dow Jones gained 0.02% to 37468, the S&P500 rose 0.81% to 4735, and the tech-heavy Nasdaq Composite advanced 1.66% to 14765.
If the bulls keep control, the Dow will attempt to break beyond its all-time high of 37790 (January 2) sooner rather than later. Having said that, immediate contention might be found at the weekly low of 37073 (December 20 2023), which is prior to the December 2023 low of 36010 (December 5), as well as the important 200-day SMA at 34431. The weekly low of 33859 (November 7, 2023) comes next before the October 2023 low of 32327 (October 27) and the 2023 low of 31429 (March 15). If this level is breached, the 2022 low of 28660 may be challenged (October 13). The daily RSI looked stable past 67.
Top Performers: Intel, Salesforce Inc, Walgreen Boots
Worst Performers: Boeing, Chevron, JPMorgan
Resistance levels: 37790 (4H chart)
Support levels: 37249 37073 36021 (4H chart)
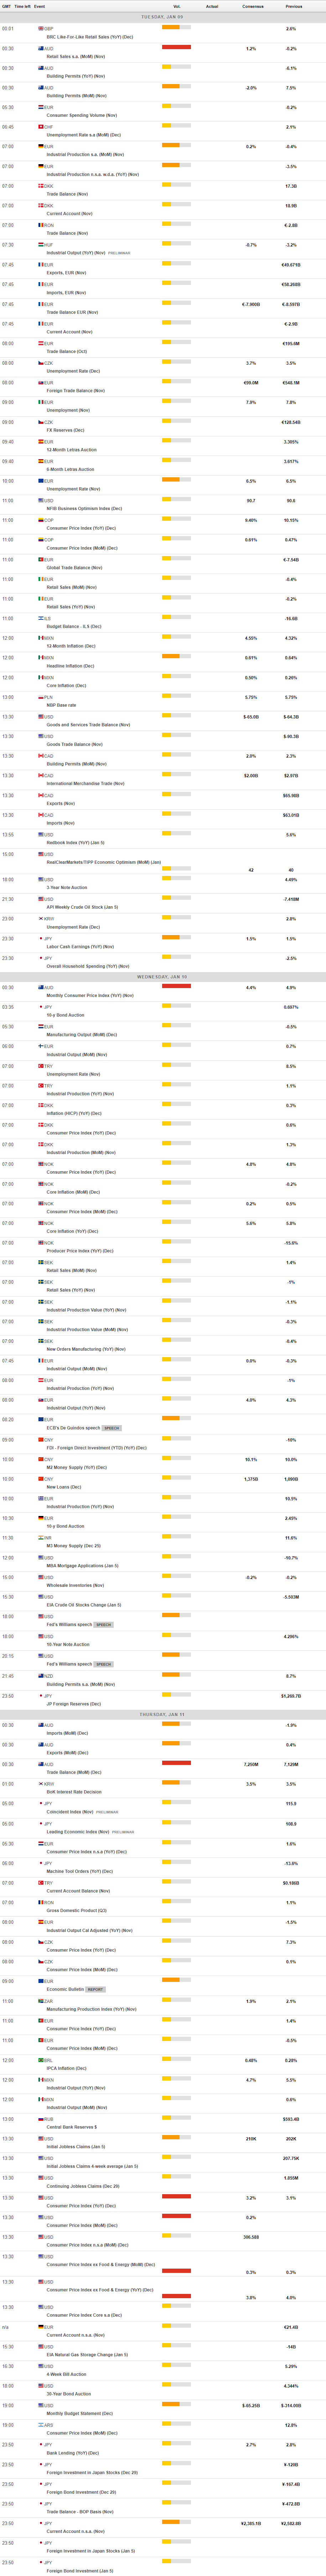
MACROECONOMIC EVENTS
All Information & Updates provided by:

All information relating to the financial markets available on this page has been prepared and issued by FXStreet (Forexstreet SL, Spain, Reg: B62498233) on the basis of publicly available information and all information believed to be reliable and does not conflict with Kuwaiti local laws, and all necessary care has been taken to before the company to ensure that the facts mentioned are correct from the source.
NCM Investment nor any of its directors or employees shall in any way be held responsible for the contents of this news, and the information contained on this page is intended only to provide clients with publicly available information and should not be construed as investment advice, report or analysis and/or constitute an offer or invitation to buy or sell financial instruments of any kind.
RISK WARNING: Forex and CFDs are highly risky leveraged products, as losses can exceed deposits. Please ensure you understand all the risks and take independent advice if necessary. NCM will segregate the clients based on the criteria of the regulator and its bylaws. NCM does not provide any advisory service; the material published does not constitute advice or a recommendation for a transaction in any financial instrument. NCM accepts no responsibility for any use of the content presented and any consequences of that use. Anyone acting on the information provided does so at their own risk.