
- Contact Us:
-

-

-

-


Daily Market Updates
10 Jan 2024
EURUSD
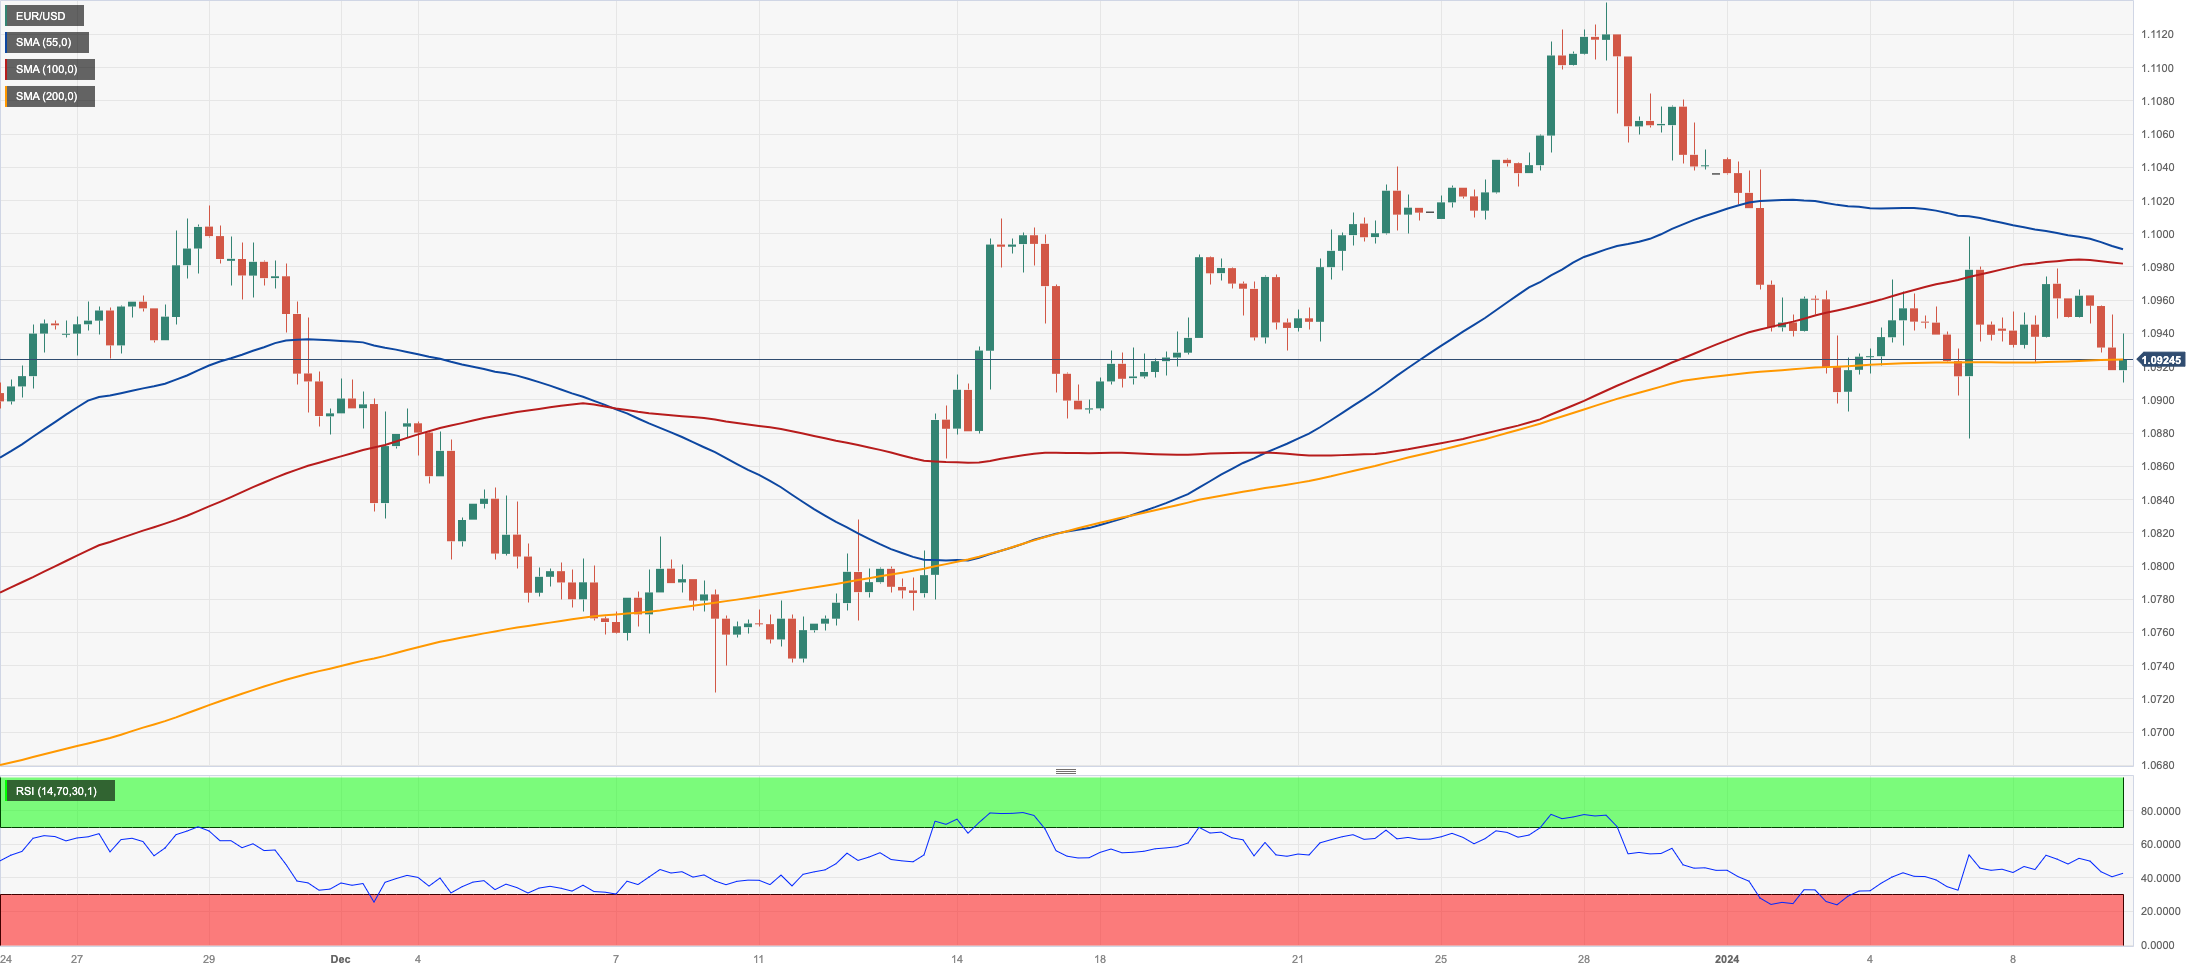
EUR/USD extended its pre-US CPI consolidative theme on turnaround Tuesday, this time briefly revisiting the 1.0910 zone against the backdrop of the marked bounce in the greenback.
On the latter, the USD Index (DXY) managed to revisit the proximity of 102.60 amidst marginal developments in US yields across the curve.
There were no changes to the broader macro scenario, where investors continued to factor in potential interest rate cuts by the Federal Reserve at some point in Q2, with March being a suitable candidate so far.
Still around the Fed, FOMC member M. Bowman said that the current policy stance appears sufficiently restrictive to hit the inflation target, while she ruled out rate cuts for the time being.
In the euro docket, Industrial Production in Germany contracted at a monthly 0.7% in November and 4.8% from a year earlier, while the unemployment rate in the broader euro bloc ticked a tad lower to 6.4% in the same period.
Across the Atlantic, the trade deficit shrank to $63.2B in November, and the NFIB Business Optimism Index improved to 91.9 in December.
The breakout of the weekly top of 1.0998 (January 5) might prompt EUR/USD to revisit the December 2023 peak of 1.1139 (December 27), which is also supported by the 200-week SMA at 1.1150, both of which precede the 2023 high of 1.1275 (July 18). Instead, a breach of the 2024 low of 1.0892 (January 3) could put a potential test of the crucial 200-day SMA of 1.0846 back on the radar, ahead of the transitory 100-day SMA of 1.0763 and the December 2023 bottom of 1.0723 (December 8). If the latter is broken, the weekly low of 1.0495 (October 13, 2023) and the 2023 low of 1.0448 (October 3) may be achieved before the round level of 1.0400. On a daily basis, the RSI dropped below the 49 level.
Resistance levels: 1.0998 1.1009 1.1139 (4H chart)
Support levels: 1.0910 1.0876 1.0723 (4H chart)
USDJPY
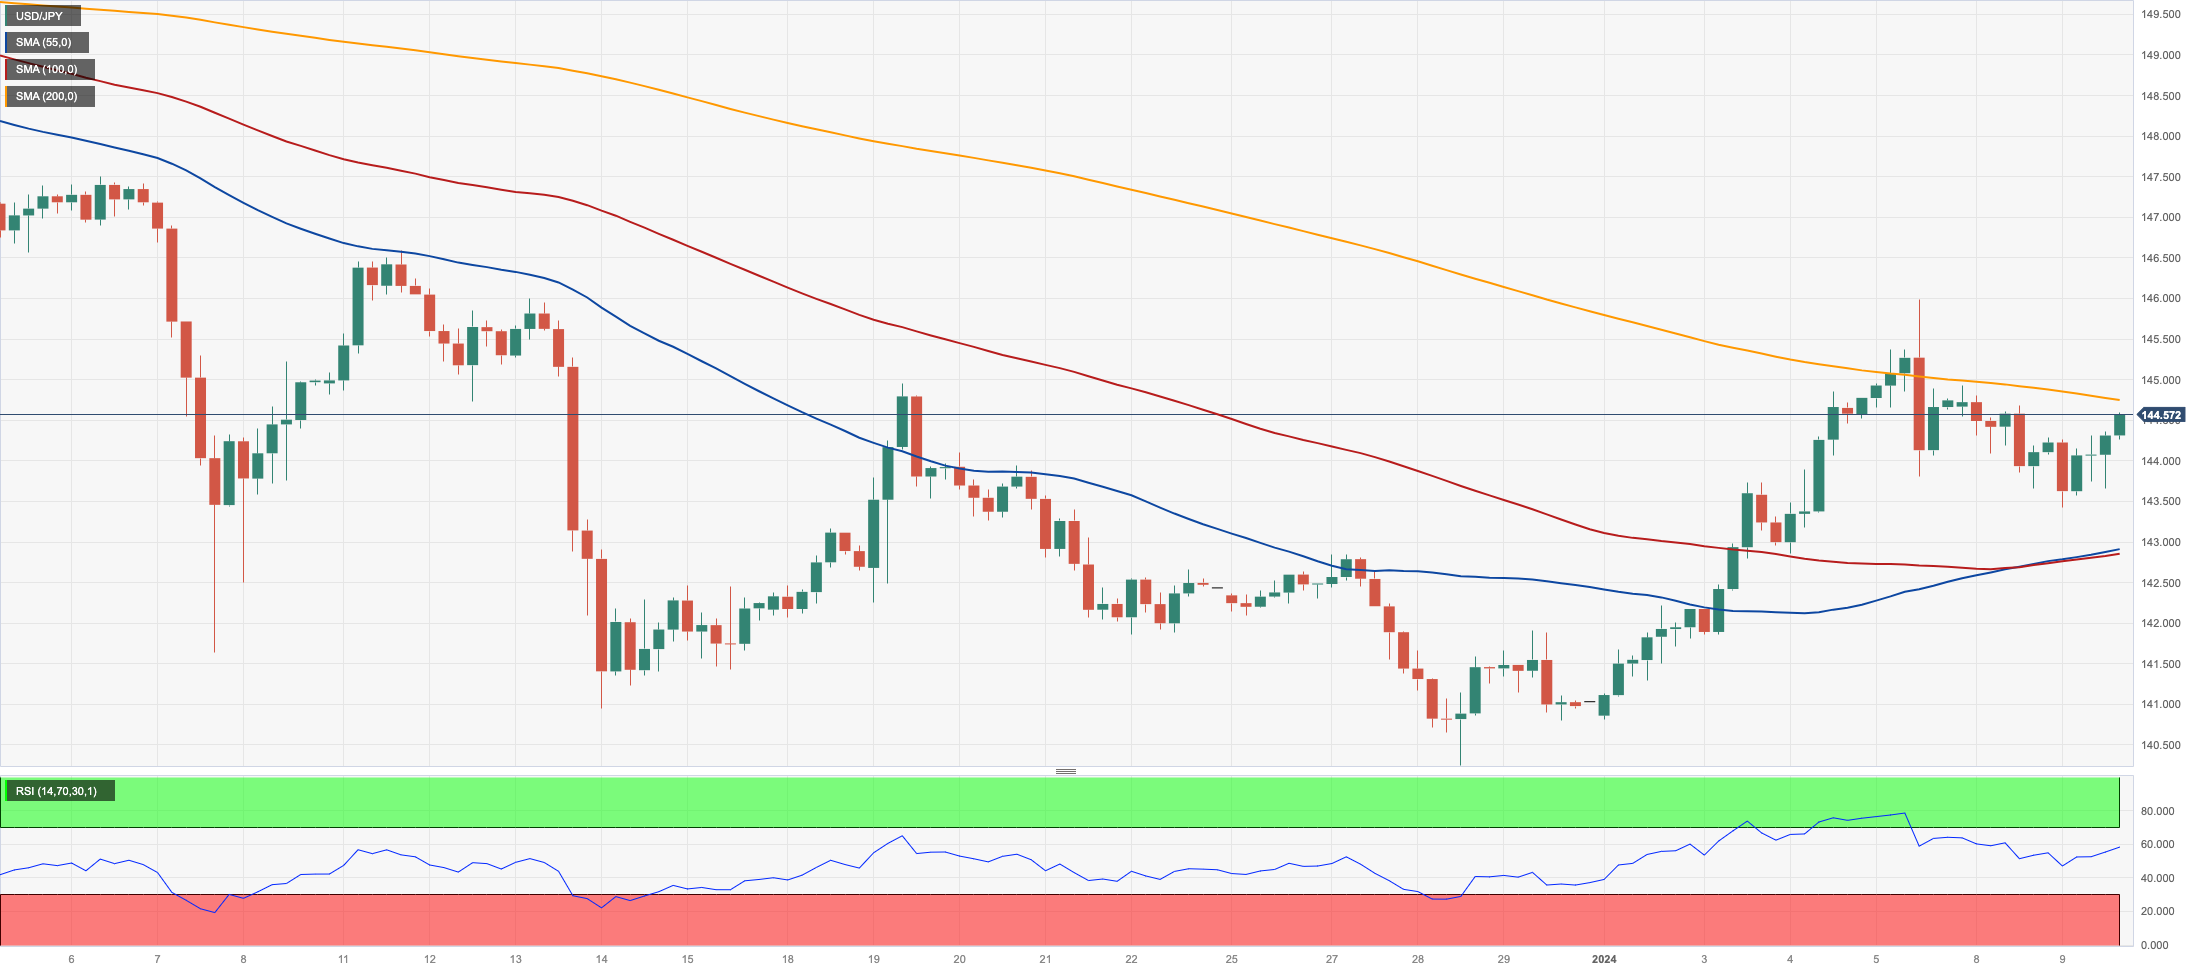
USD/JPY set aside part of its recent bearish performance on Tuesday, this time briefly putting the critical 200-day SMA near 143.30 to the test before staging a meaningful rebound well north of 144.00 the figure.
Price action in the pair came against the backdrop of a firm bounce in the greenback and marginal moves in US yields across different timeframes vs. a drop to multi-day lows in the JGB 10-year yields.
On a separate note, the BoJ signalled its intention to decrease its monthly acquisitions of government bonds spanning 10 to 25 years. However, this adjustment primarily addresses the alleviation of JGB yield pressures rather than suggesting the imminent withdrawal of accommodation by the BoJ.
In the domestic calendar, Household Spending contracted 1.0% MoM in November and 2.9% vs. the same month in 2023.
If the bearish trend continues and USD/JPY breaks below the key 200-day SMA at 143/35, it could then confront the December 2023 low of 140.24 (December 28) prior to the round level of 140.00. South from here emerges the July 2023 bottom of 137.23 (July 14) followed by the March 2023 low of 129.63 (March 24). On the other hand, extra gains will meet the next up-barrier at the 2024 high of 145.97 (January 5) before challenging the transitory 55-day SMA of 146.87. The critical 150.00 barrier appears north of here, prior to the 2023 top of 151.90 (November 13), the 2022 peak of 151.94 (October 21), and the round number of 152.00. The daily RSI rose past the 52 mark.
Resistance levels: 145.97 146.58 147.49 (4H chart)
Support levels: 143.42 140.24 138.05 (4H chart)
GBPUSD
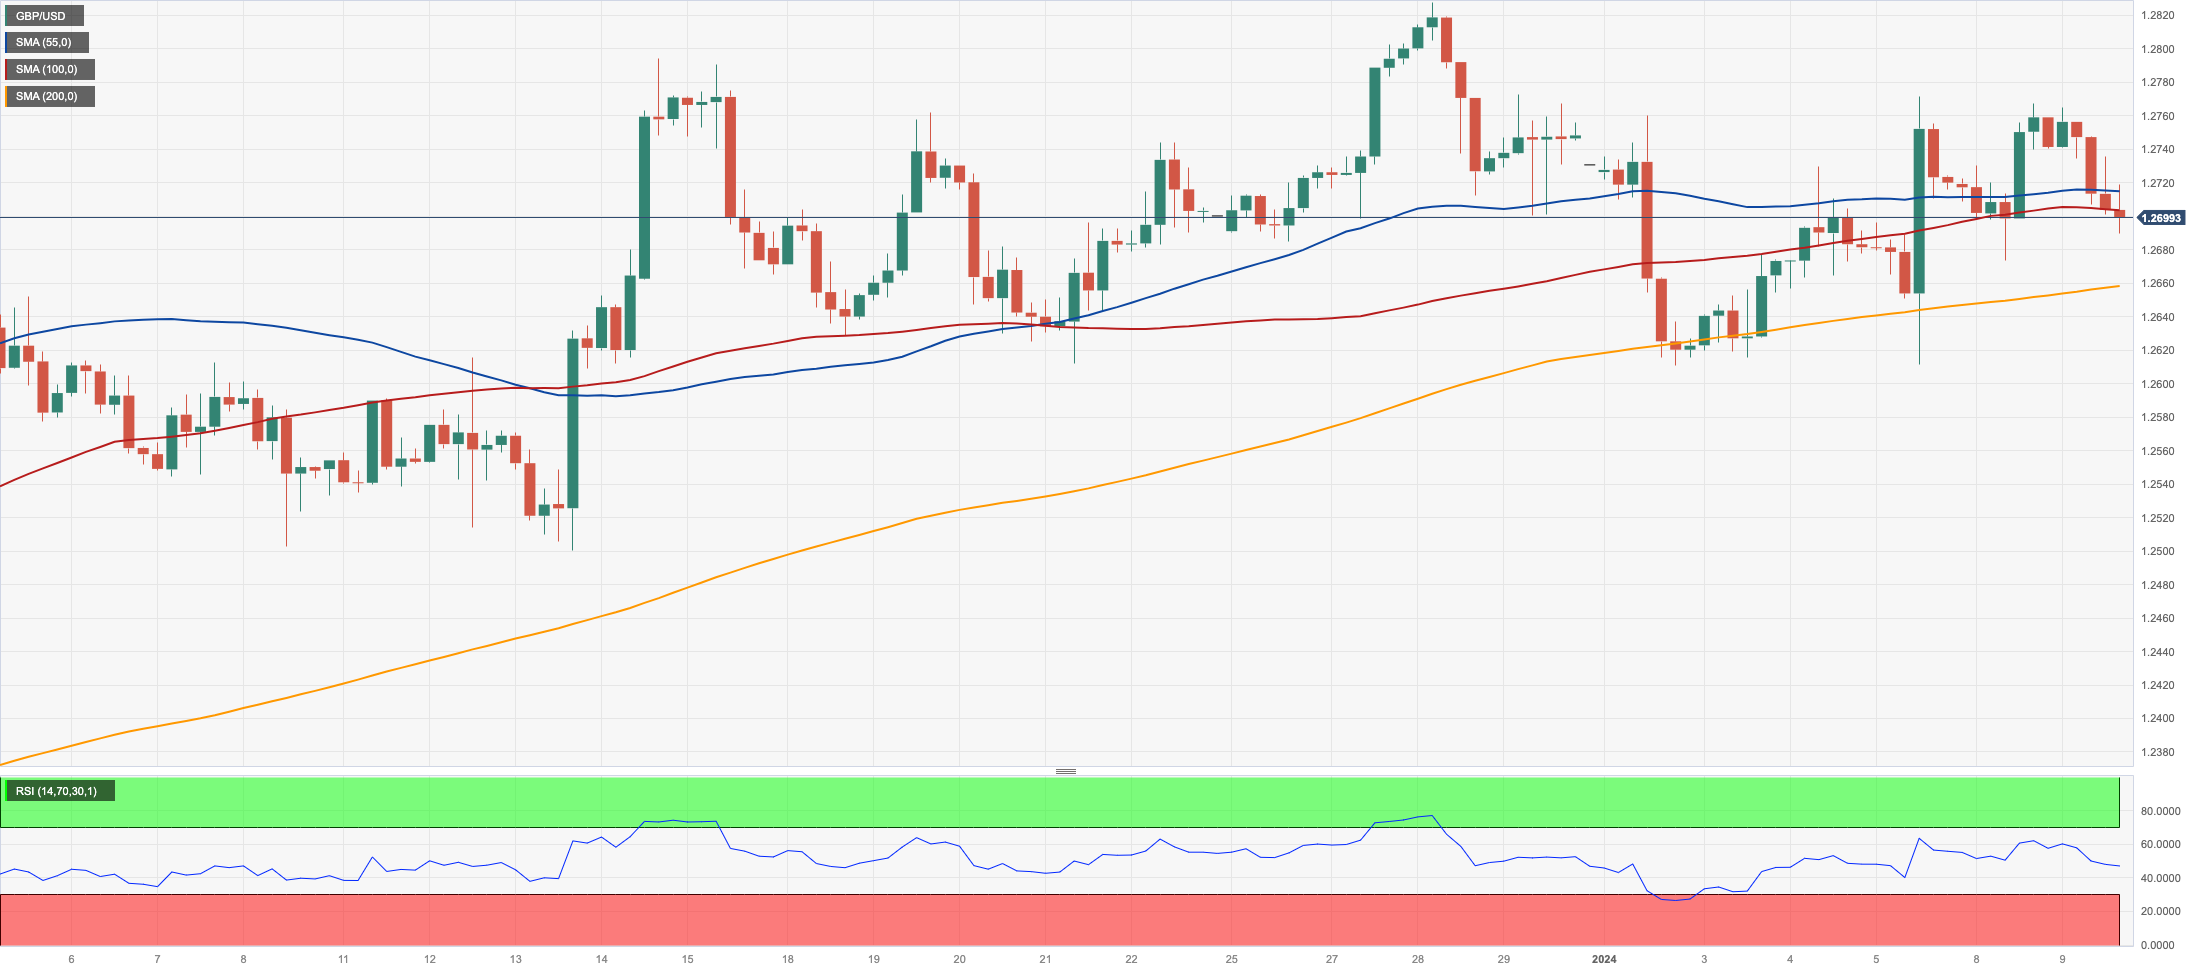
The robust rebound in the greenback sparked an equally strong knee-jerk in the British pound on Tuesday.
That said, GBP/USD returned to the sub-1.2700 neighbourhood amidst noticeable losses, leaving behind four consecutive daily upticks. So far the 1.2760/70 band emerges as quite a decent resistance for the time being.
No big news in the UK money market, where the 10-year gilt yields charted another irresolute session around 3.80%.
In the UK, BRC Retail Sales Monitor rose at an annualized 1.9% in the last month of 2023.
If the ongoing recovery gathers fresh steam, GBP/USD may revisit the December 2023 peak of 1.2827 (December 28), seconded by the weekly high of 1.2995 (July 27 2023), which is just over the critical 1.3000 threshold. On the flip side, a break below the so-far 2024 low of 1.2610 (January 2) might send the pair probing the 200-day SMA at 1.2536 before the December 2023 low of 1.2500 (December 13), which looks to be supported by the vicinity of the temporary 55-day SMA. Once Cable clears this region, it could embark on a potential move to the weekly low of 1.2187 (November 10, 2023), which comes before the October 2023 low of 1.2037 (October 3), the critical 1.2000 level, and the 2023 bottom of 1.1802 (March 8). The daily RSI broke below the 54 level.
Resistance levels: 1.2771 1.2827 1.2995 (4H chart)
Support levels: 1.2648 1.2610 1.2500 (4H chart)
GOLD
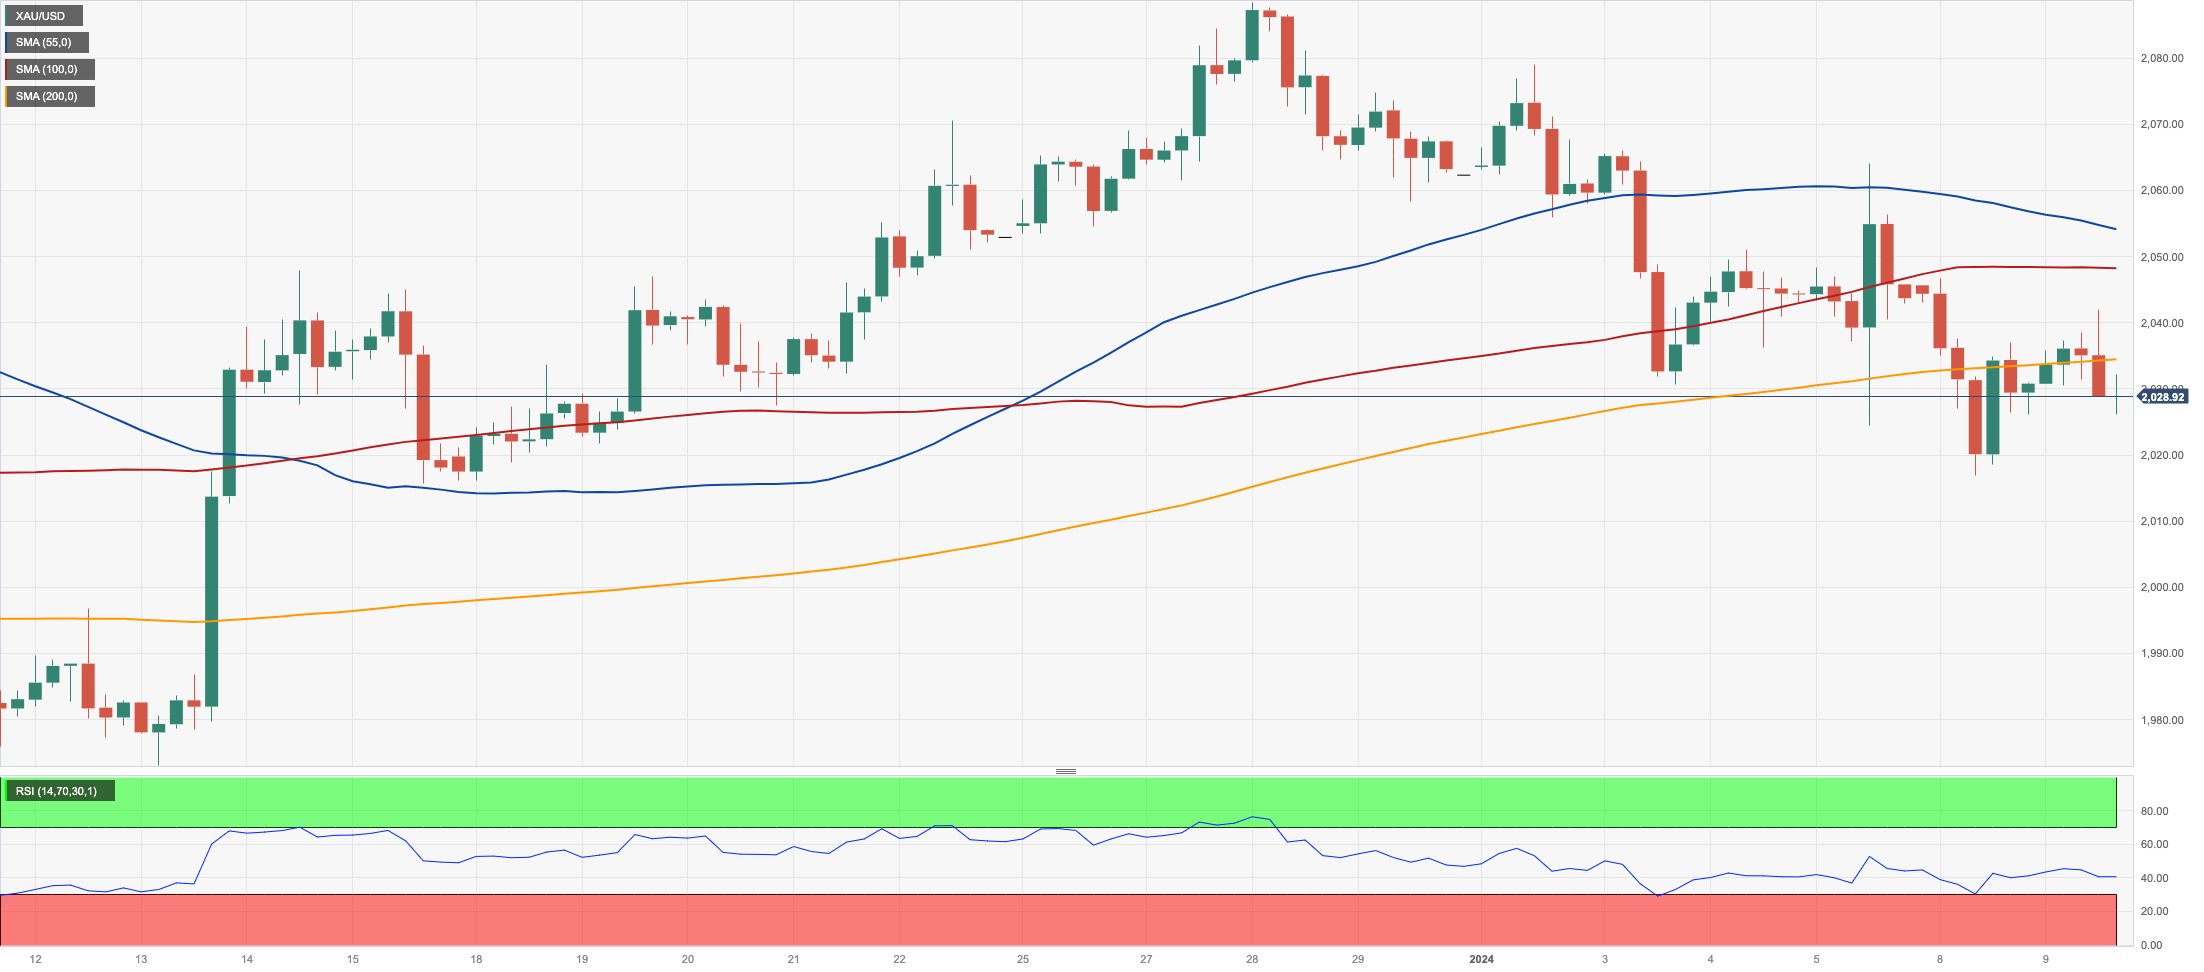
Prices of the yellow metal partially reversed Monday’s negative start of the week and advanced marginally to levels past the $2040 mark per troy ounce on Tuesday.
The daily improvement in bullion came despite a decent advance in the greenback, although the continuation of the weekly corrective downtrend in US yields appears to have lent fresh legs to the metal.
Moving forward, the precious metal is expected to face some renewed volatility and cautious trade ahead of the release of US inflation figures measured by the CPI on January 11.
If the 2924 low of $2016 (January 8) is breached, gold prices may be pulled to the intermediate 55-day SMA around $2009, before reaching the crucial contention zone around $2000. The breakdown of this sector points to a drop to the December 2023 low of $1973 (December 13), which is above the 200-day SMA of $1962 and the November 2023 low of $1931 (November 13). South of here, the October 2023 low of $1810 (October 6), the 2023 low of $1804 (February 28), and, finally, the critical $1800 support zone may be observed. Having said that, the following level of resistance is oriented at the weekly top of $2088 (December 28), ahead of the all-time peak of $2150 (December 4 2023).
Resistance levels: $2064 $2078 $2088 (4H chart)
Support levels: $2016 $1973 $1965 (4H chart)
CRUDE WTI
WTI prices regained their smile and managed to trim part of the pronounced pullback recorded at the beginning of the week on Tuesday.
Indeed, this time, persistent geopolitical concerns stemming from the Red Sea and the potential ramifications of the Israel-Hamas crisis underpinned the tight supply narrative and lent much-needed support to the commodity.
Also contributing to the upside bias in crude oil prices was the inactivity in the Libyan Sharara oilfield after a force majeure was declared over the weekend by the NOC.
On the not-so-bright side, the EIA reported that US crude oil production is expected to increase to record levels this year.
The weekly high of $76.14 (December 26 2023) is next for WTI, followed by the significant 200-day SMA at $77.87, the vital $80.00 barrier, and the November 2023 top of $80.15 (November 3). Further gains from here may send the market back to its weekly peak of $89.83 (October 18 2023), ahead of the 2023 high of $94.99 (September 28 2023) and the August 2022 top of $97.65 (August 30), all before the important $100.00 threshold. The other way around, a breach of the YTD low of $69.31 (January 3) would open the door to a deeper decline to the December 2023 low of $67.74 (December 13), ahead of the June 2023 low of $66.85 (June 12) and the 2023 bottom of $63.61.
Resistance levels: $74.20 $76.14 $79.56 (4H chart)
Support levels: $70.10 $69.25 $67.68 (4H chart)
GER40
Equities in Germany traded on the defensive, leaving behind the promising start of the week on the back of investors’ rising concerns over the health of the economy on the old continent.
The prevailing risk-off sentiment weighed on stocks on Tuesday, while the German 10-year bund yields ticked higher and flirted with the 2.20% zone.
Additionally, disappointing results from industrial production in Germany also seem to have played against any recovery attempt, while the unexpected improvement in the broader euro area jobless rate appears to have somewhat mitigated losses.
Further gains might propel the DAX40 to the so-far YTD high of 16963 (January 2) prior to the all-time top of 17003 (December 14). On the contrary, early support may be found at the 2024 low of 16448 (January 5) prior to the weekly low of 15915 (November 28), and the critical 200-day SMA of 15853. Down from here aligns the October 2023 low of 14630 (October 23) before the March 2023 low of 14458 (March 20). The daily RSI receded to the sub-60 region.
Best Performers: Sartorius AG VZO, E.ON SE, RWE AG ST
Worst Performers: BASF, Infineon, Munich Re Group
Resistance levels: 16963 17003 (4H chart)
Support levels: 16448 15915 15837 (4H chart)
GBPJPY
GBP/JPY added to the pessimism seen at the beginning of the week and charted a marked pullback to the 182.70 zone, or three-day lows, on Tuesday.
The negative development in the cross came in response to the dominating risk-off sentiment, which put the British pound under extra pressure along with the rest of the risk-linked assets.
That said, the cross extended further its rejection from so-far yearly tops around 184.30 recorded earlier in the month, fading at the same time the auspicious start of the new trading year.
Immediately to the upside for GBP/JPY comes the 2024 high of 184.31 (January 5), ahead of the 2023 top of 188.65 (November 24). Further up comes the November 2015 peak of 188.80 (November 19) before the August 2015 high of 195.28 (August 18). On the downside, the loss of the key 200-day SMA at 179.66 could drag the cross to the December 2023 low of 178.33 (December 14) prior to the October 2023 low of 178.03 (October 3) and the July 2023 low of 176.30 (July 28). The breakdown of this level could spark a deeper pullback to the May 2023 low of 167.83 (May 11) ahead of the March 2023 low of 158.25 (March 24). The day-to-day RSI retreated to the 54 area.
Resistance levels: 184.31 187.56 188.66 (4H chart)
Support levels: 182.75 181.72 178.74 (4H chart)
-638404349061971188.png)
NASDAQ
The optimism in the US tech sector remained well in place on Tuesday, pushing the benchmark Nasdaq 100 to multi-session highs past the 16700 level.
The third consecutive daily gain in the index came despite firmer demand for the greenback, while the inconclusive session in US yields across the curve seems to have bolstered the mood in the tech sector.
The Nasdaq 100's immediate upside target is the all-time high of 16969 (December 28 2023). For all that, there is an initial support at the January low of 16249 (January 5) prior to the December 2023 low of 15695 (December 4), which comes ahead of the key 200-day SMA of 14866 seconded by the October 2023 low of 14058 (October 26). Once the latter is cleared, the index might challenge the April 2023 bottom of 12724 (April 25) ahead of the March 2023 low of 11695 (March 13) and the 2023 low of 10696 (January 3). The everyday RSI rose to the vicinity of 60.
Top Gainers: Illumina, CrowdStrike Holdings, Zscaler
Top Losers: Moderna, Charter Communications, GE HealthCare
Resistance levels: 16710 16969 (4H chart)
Support levels: 16249 15695 15471 (4H chart)
DOW JONES
US stocks measured by the Dow Jones faded part of Monday’s strong advance against the backdrop of dominating risk-off sentiment and rising prudence ahead of the publication of US inflation figures and consumer sentiment, due on Thursday and Friday, respectively.
Collaborating with the daily retracement also emerged steady cautiousness prior to the earnings season kick-off, as well as some shrinking bets that the Fed might start reducing rates as soon as Q2.
All in all, the Dow Jones retreated 0.55% to 37473, the S&P500 dropped 0.15% to 4756, and the tech-focused Nasdaq Composite gained 0.17% to 14868.
If the bulls maintain control, the Dow will seek to break over its all-time high of 37790 (January 2) as soon as possible. However, immediate support might be located at the weekly low of 37073 (December 20 2023), which is previous to the December 2023 low of 36010 (December 5), as well as the crucial 200-day SMA at 34431. Following that is the weekly low of 33859 (November 7, 2023), followed by the October 2023 low of 32327 (October 27) and the 2023 low of 31429. (March 15). If this level is broken, the 2022 low of 28660 might be threatened (October 13). The daily RSI seems to be consistent over 67.
Top Performers: Merck&Co, Salesforce Inc, Walmart
Worst Performers: Dow, Chevron, Walt Disney
Resistance levels: 37790 (4H chart)
Support levels: 37249 37073 36021 (4H chart)

MACROECONOMIC EVENTS
All Information & Updates provided by:

All information relating to the financial markets available on this page has been prepared and issued by FXStreet (Forexstreet SL, Spain, Reg: B62498233) on the basis of publicly available information and all information believed to be reliable and does not conflict with Kuwaiti local laws, and all necessary care has been taken to before the company to ensure that the facts mentioned are correct from the source.
NCM Investment nor any of its directors or employees shall in any way be held responsible for the contents of this news, and the information contained on this page is intended only to provide clients with publicly available information and should not be construed as investment advice, report or analysis and/or constitute an offer or invitation to buy or sell financial instruments of any kind.
RISK WARNING: Forex and CFDs are highly risky leveraged products, as losses can exceed deposits. Please ensure you understand all the risks and take independent advice if necessary. NCM will segregate the clients based on the criteria of the regulator and its bylaws. NCM does not provide any advisory service; the material published does not constitute advice or a recommendation for a transaction in any financial instrument. NCM accepts no responsibility for any use of the content presented and any consequences of that use. Anyone acting on the information provided does so at their own risk.